Improving T-cell Immunotherapy for Melanoma Through a
Mathematically Motivated Strategy: Efficacy in Numbers?
Natalie Kronik,* Yuri Kogan,
w
Paul G. Schlegel,
z
and Matthias Wo¨lfl
z
Summary:T-cell mediated immunotherapy for malignant diseases has become an effective treatment option, especially in malignant melanoma. Recent advances have enabled the transfer of high T-cell numbers with high functionality. However, with more T cells becoming technically available for transfer, questions about dose, treatment schedule, and safety become most relevant. Mathema-tical oncology can simulate tumor characteristics in silico and predict the tumor response to novel therapeutics. Using similar methods to classical pharmacokinetics/pharmacodynamics-type models, mathematical oncology translates the findings into a multiparameter model system and simulates T-cell therapy for malignant diseases. The tumor and immune system dynamics model can provide minimal requirements (in terms of T-cell dose and T-cell functionality) depending on the tumor characteristics (growth rate, residual tumor size) for a clinical study, and help select the best treatment schedule (repetitive doses, minimally required duration, etc.). Here, we present a new mathematical model developed for modeling cellular immunotherapy for melanoma. Computer simulations based on the new model offer an explanation for the observed finding from clinical trials that the patients with the smallest tumor load respond better. We simulate different parameters critical for improvement of cellular therapy for patients with high tumor load of fast-growing tumors. We show that tumor growth rate and tumor load are crucial in predicting the outcome of T-cell therapy. Rather than intuitively extrapolating from experimental data, we demonstrate how mathematical oncology can assist in rational planning of clinical trials.
Key Words:mathematical oncology, computer simulations, cancer immunotherapy, melanoma, adoptive T-cell transfer
(J Immunother2012;35:116–124)
A
doptive immunotherapy using tailored T-cell infusions to treat malignancies has been proven to be effective in certain types of malignancy.1,2However, our understanding as to why certain patients respond whereas others progress, is still limited. Moreover, clinical approaches using T-cell therapy still vary widely in issues such as how to generate large numbers of specific T cells, how many T cells to use for therapy, and what schedule would be most effective. The expansion of tumor-specific T cells have been hinderedby the often low-precursor frequency in patients or healthy individuals, the loss of high-affinity T cells during ex vivo culture and the terminal differentiation of extensively cultured and expanded T cells, resulting in loss of function and persistence upon transfer to the patient.3 Recently, progress has been made with genetic engineering of chimeric antigen receptors, T-cell receptor transfer, and silencing of genes exerting unfavourable functions.4,5 Furthermore, use of new cytokine combinations allows the rapid expansion of less differentiated T cells with an enhanced functional capacity.6However, recent preclinical and clinical data also reveal the dangers of this type of therapy with several serious adverse events related to T-cell infusions being reported.7–9 Therefore, with high numbers of antigen-specific T cells becoming available for clinical use and at the same time considering the potential risks, we asked, whether rather than intuitively deciding on a given T-cell regimen, mathematical modeling would help to define the prerequisites of an effective immunotherapy approach.
Integrative mathematical oncology is widely used to decode the cancerous process.10 Several, mechanistic or descriptive, models have been proposed to better under-stand the growth dynamics of cancerous cells embedded in the nonmalignant environment. Part of the models has studied 3-dimensional growth of tumors, whereas others have preferred the use of nonspatial mathematical models.11,12
In this context, modeling tumor-immune interactions has been key issue over the past 2 decades. De Boer et al13 were one of the first to model the interaction between T cells, macrophages, and tumor cells, taking into account a variable immunogenicity of the tumor cells. In this in silico model, small variations in specific T-cell subsets, especially the number of activated helper T cells, had a large impact on tumor cell growth, whereas calculated required number of cytotoxic T cells to achieve the same effect was 1000-fold higher. However, Takayanagi and Ohuchi14provided mathematical analysis showing that an increased number of cytotoxic T cells may ultimately tilt the balance between tumor and immune system in favor of the latter. Other groups have investigated different aspects of immunotherapy such as the role of tumor dormancy, the therapeutic use of interleukin-2 (IL-2) and the effects of tumor-associated cytokines such as transforming growth factor b (TGFb) or epidermal growth factor.15–19 For a comprehensive review of simulation methods of tumor immunology see Woelke et al.20
We recently developed a mathematical model of T-cell therapy for glioblastoma that includes the mutual inter-actions between the immunosuppressive tumor and the expression of major histocompatibility complex (MHC) receptors, which can be induced by cytotoxic T-lymphocyte (CTL)-secreted cytokines.21 The mathematical model, Received for publication June 18, 2011; accepted August 28, 2011.
From the *Department of Applied Mathematics, Holon Institute of Technology, Holon, Israel;wInstitute for Medical BioMathematics, Bene Ataroth, Israel; andzDepartment of Pediatric Hematology, Oncology and Bone Marrow Transplantation, University Chil-dren’s Hospital, University of Wuerzburg, Wuerzburg, Germany. Reprints: Natalie Kronik, Department of Applied Mathematics, Holon
Institute of Technology, 52 Golomb St, Holon, Israel (e-mail: [email protected]).
Supplemental Digital Content is available for this article. Direct URL citations appear in the printed text and are provided in the HTML and PDF versions of this article on the journal’s Website, www.immunotherapy-journal.com.
furthermore, predicts the existence of a threshold value of T-cell infusion rate, which needs to be crossed, before a significant impact on the tumor growth can be observed.22 In this study, we present a mathematical model for immunotherapy in the context of published clinical data. We chose immunotherapy by transfer of ex vivo expanded tumor-specific T cells for melanoma patients, as this therapeutic strategy has been shown to be especially effective in this patient population. At the same time, little is known about the actual numbers of T cells required for therapeutic treatment, resulting in a wide variation in T-cell numbers across clinical studies. In fact, T-cell dosing is often calculated based on body surface area—a concept, which stems from pharmacological substances which rely on renal excretion—or on body weight, rather than on the estimated tumor burden. However, this is exactly where mathematical modeling may help to design an individua-lized treatment schedule for each patient. On the basis of reported parameters in the literature, a mathematical model was built by transferring a descriptive model into mathe-matical equations. Using experimental quantitative data reported recently, the model was then retrospectively validated. We then analyzed treatment schedules used previously in clinical trials, to assess the magnitude of a functional T cells response required to efficiently target malignant melanoma. We show that even high T-cell numbers used for therapy will unlikely influence large and fast-growing tumors, unless the functional capacity of each T-cell product is improved. Furthermore, finer quantifica-tion of residual tumor load may assist in identifying patients, which will benefit from this type of therapy.
METHODOLOGY
In our previous study,21 a simplified mechanism for alloreactive cellular therapy for glioblastoma was intro-duced. Partially, based on this previous study, we developed a new model with special adaptation to melanoma and melanoma immunotherapy parameters. Figure 1 shows a scheme of the model. The mathematical equations are:
Mathematical Equations . T¼rT 1T K aT MI eT þMI aT;bFbþeT;b FbþeT;b C T hT hTþT ð1Þ
Equation (1) describes the tumor cell, T, dynamics, (the dot is the time derivative), as influenced by tumor cell maximal number,K, CTL population,C, killing efficacy of the CTLs,aT, presence of MHC class I receptors,MI, and
the level of TGFbsecretion. For full explanations here and hereafter and list of parameters see Appendix, Supple-mental Digital Content 1, http://links.lww.com/JIT/A157.
.
C¼ mCCþI ð2Þ
Equation (2) describes the dynamics of the CTLs,C, by the death rate of CTLs proportional to the population of CTLs, with coefficient mC, and finallyI, the CTL infusion
rate.
.
Fb¼ab;TTmbFb ð3Þ Equation (3) describes the dynamics of TGFb,Fb, as
proportional to the tumor cell population,T, withab,T, as a
proportion coefficient and is destroyed at a rate of mb
proportional toFb.
.
Fg¼ag;CCmgFg ð4Þ Equation (4) describes the dynamics of IFNg,Fg, as
proportional to the population of CTLs, C, with propor-tion coefficient, ag,c, and is destroyed at a rate mg
proportional to the amount ofFg.
.
MI¼gMIþ
aMI;gFg FgþeMI;g
mMIMI ð5Þ
Equation (5) describes the dynamics of MHC class I molecules,MI,are presented on the tumor cell surface at a rate gMI,this rate is augmented by a Michaelis-type term dependent on Fg. The MI molecules are internalized at a
ratemg.
Model Assumptions
The current model assumes that a primary tumor cell population and a metastatic tumor cell population are indistinguishable by size alone or level of malignancy per metastatic population. We feel it is a safe assumption to make for most of the patients, at least at this fundamental stage of model development.
FIGURE 1. A simplified model for the interaction of melanoma cells and cytotoxic T cells and the respective cytokines. Melanoma cells express immunogenic antigens in the context of the MHC I complex, but also secrete TGFb, which inhibits T-cell activity. Upon contact with melanoma cells, exogenously infused CTLs lyse their target and secrete IFN-g. IFN-gleads to upregulation of MHC class I in the melanoma cells, which in return increases the CTL-mediated effect. IL-2 injections prolong persitence of infused CTLs. Endogenous cytotoxic T cells are included as constant influx to the T-cell effector compartment. CTL indicates cytotoxic T lymphocyte; IFN, interferon; IL, interleukin; MHC, major histocompatibility class; TGFb, trans-forming growth factorb.
COMPUTER SIMULATIONS
Computer simulations were performed using Matlab. For all computer simulations, tumor initial population size was determined between 11010to 51011cells. We divi-ded this range into 50 equal intervals. Tumor growth rates were set between 0.0001 to 0.01/hour. In the same manner that range was divided into 10 equal intervals. All combinatorial possibilities were then crossed, creating 5010 = 500 combinations of tumor initial population size and tumor growth rates. The crossing imitates a virtual population of patients with a wide range of personal disease characteristics. Computer simulations predicting tumor population size under different adoptive T-cell therapy regi-mens over 300 days were run with these initial conditions. Of this 500 virtual patients’ grid (or data set), 100 patients were selected randomly and their simulation results were presented in plots and summary statistics. The results of randomly selected 100 patients were plotted.
Clinical Interpretation of Computer Simulation Results
Response Evaluation Criteria in Solid Tumors are being adopted in many clinical studies to help harmoniza-tion of data analysis for clinical outcome.23 We adopted these criteria for the definition of progression/nonrespon-ders (larger than 120% of original size), stable disease (70% to 120%), and partial (30% decrease) or complete response (disappearance).
RESULTS Description of the Model
This mathematical model simulates the effect of cyto-toxic lymphocytes on melanoma cells (Fig.1). It consists of 5 differential equations describing the dynamics of the tumor growth, CTL persistence, cytokine secretion, and MHC class-I expression. The exact dynamics is controlled by the following key parameters: cytolytic activity of the T cells, tumor growth rate, survival of the T cells, and the collective sensitivity of the tumor cells to killing (hT). It is a refined model of our previous study modeling immunother-apy for glioblastoma patients.21,22A detailed description of the model and all the relevant parameters is given in the Appendix, Supplemental Digital Content 1, http://links. lww.com/JIT/A157.
Selection of Studies Simulated With This Model
We wanted to simulate 4 representative immunother-apy studies based on the data obtained from published literature to model the greatly varying treatment schedules and results.24–26 The 4 studies were selected using the
following criteria: clinical trials (phase I/II) using antigen-specific T cells to target malignant melanoma; data available in the literature to model treatment schedule in terms of dose and timing; different research groups with only 1 study per group.
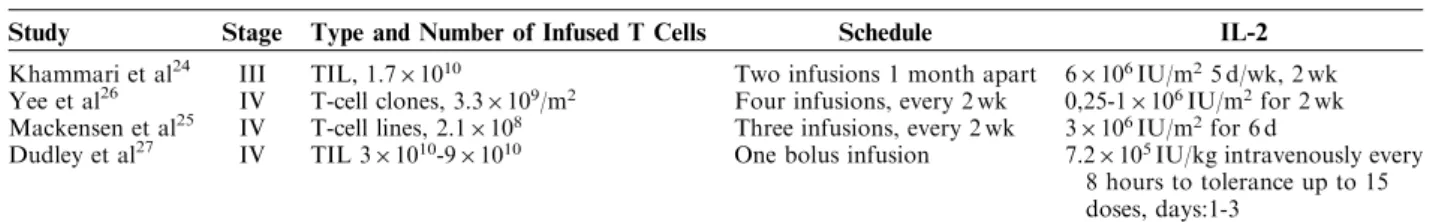
The 4 selected studies are summarized in Table 1 illustrating the significant variation in terms of T-cell numbers administered, frequency of infusions, and initial tumor load. Therefore, these main factors were analyzed with this model.
Polyclonal T-cell Lines in Stage III Melanoma
Khammari et al24 compared infusions of ex vivo expanded tumor infiltrating lymphocytes (TILs) with IL-2 versus IL-2 treatment alone. Eighty-eight patients were enrolled and equally distributed into each arm of the study. These patients had not received earlier systemic treatment and were enrolled when regional lymph node recurrence occurred after surgery (stage III, T1-4N recurrent M0). The group reports on a long follow-up of more than 10 years.
Patients with 1 invaded lymph node were compared with patients with multiple lymph node metastasis. Patients with only 1 invaded lymph node receiving TIL and IL-2 had a striking survival advantage over patients receiving IL-2 only (33.3% vs. 68.42% relapse percentage). This difference was not seen in patients with multiple lymph node metastases, suggesting that tumor load impacts efficacy of the treatment. Tumor load and tumor growth rate for each individual patient, however, are not reported in the study.21,22To model this study, we therefore chose a range of initial tumor sizes and tumor growth rates (see Methodology section for details) and simulated the potential outcome for 500 different combinations of initial tumor load and growth rate values (Fig. 2). In analogy to the clinical protocol, we simulated a treatment regimen with 2 infusions given 1 month apart. Simulations were performed using the reported median cell dose of 1.71010 TILs (Fig. 2A), and the lowest (2.2109, Fig. 2B) and highest (2.71010, Fig. 2C) doses. As the best reported value of tumor specific T cells was 13.8%, T-cell dose was corrected for 10%.
Simulated response rate (all the patients but the nonresponders) varied between 1% and 25% (Figs. 2B, C) depending mainly on TIL dose. However, even with the highest T-cell dose, and assuming favorable conditions for the T cells, only tumors with the lowest size could be delayed significantly in their growth or reduced in size reflecting complete remission according to Response Evaluation Criteria in Solid Tumors’ criteria. Thus, the mathematical model predicts that repetitive lysis of tumor cells by each T-cell infused, results only in rare
TABLE 1. Actual Treatments Chosen for Simulation
Study Stage Type and Number of Infused T Cells Schedule IL-2 Khammari et al24 III TIL, 1.7
1010 Two infusions 1 month apart 6106IU/m25 d/wk, 2 wk
Yee et al26 IV T-cell clones, 3.3109/m2 Four infusions, every 2 wk 0,25-1106IU/m2for 2 wk
Mackensen et al25 IV T-cell lines, 2.1
108 Three infusions, every 2 wk 3106IU/m2for 6 d
Dudley et al27 IV TIL 31010-91010 One bolus infusion 7.2105IU/kg intravenously every
8 hours to tolerance up to 15 doses, days:1-3
circumstances, such as low residual tumor size, in a signifi-cant impact on the tumor.
The fact that only patients with involvement of a single lymph node showed a benefit in this study, suggested a qua-ntitative effect of the T cells in the tumor load. However, in a subgroup analysis of the 27 patients for whom data on the content of tumor-reactive T cells were available, no cor-relation was found between clinical outcome (as indicated by relapse vs. no relapse) and the applied dose of antigen-specific T cells.28One likely explanation may be the small sample size. Computer simulation offers an alternative explanation: Figure 3 plots initial tumor size versus simulated final tumor size. Simulations are shown for the same 3 different T-cell doses. For tumors larger than 11011, no correlation can be seen between outcome (final tumor size) and initial tumor volume, regardless of the T-cell dose infused. This is in line with the clinical observ-ation. Only when the initial tumor burden is sufficiently small, a dose-effect relationship of the T cells can be established, suggesting that rather than clinical staging as was done in this trial, a detailed volumetric analysis of residual tumor masses—if at all possible—may represent better correlation with clinical effectiveness of a T-cell response. TIL dose-effect relationship can be seen only for small initial tumor size and completely vanishes for large initial tumor cell numbers (Fig. 3).
T-cell Clones With Defined Specificity
The exact fraction of antigen-specific T cells within the infused T-cell lines remained unknown in the study by Khammari et al.24 To address better the actual number of antigen-specific T cells, we simulated a different study, in which clonally expanded antigen-specific T cells, thus suggesting similar tumor reactivity, were used.26 Ten stage IV melanoma patients (metastatic disease) were treated with 3.3109/m2 CTLs given in biweekly in-fusions 4 times—with 2 patients receiving 6 and 7 inin-fusions respectively, and 2 patients receiving only 3 infusions. Detailed data on initial tumor burden are not available. Yee et al’s26 clinical data report on 7 of 10 patients as having partial responses, 5 of which reaching stable disease with a mean duration of approximately 1 year and 2 patients with progressive disease. Mathematical modeling suggests a 59% response rate (complete and partial responses) at 300 days posttreatment (Fig. 4). Bearing in mind that the actual tumor burden or tumor growth rates of the patients were not available, the agreement between the clinical trial and the simulations is good. The number of antigen-specific T-cell numbers of each infusion in Yee et al’s26 trial was comparable to the highest T-cell dose infused in the Khammari study; however, 4 infusions were given in Yee et al’s study as opposed to 2 infusions in the Khammari trial. This may account for the higher response
0 50 100 150 200 250 300 0 2 4 6 8 10 x 10 11 Time (days)
Tumor cell number
CR=14 PR=3 SD=6 NR=77 0 50 100 150 200 250 300 0 2 4 6 8 10 x 10 11 Time (days)
Tumor cell number
CR=0 PR=1 SD=0 NR=99 0 50 100 150 200 250 300 0 2 4 6 8 10 x 10 11 Time (days)
Tumor cell number
CR=15 PR=2 SD=8 NR=75 A C B
FIGURE 2. Simulations of tumor cell number and TIL dose in the Khammari et al24clinical trial. A to C, Simulations of time-dependent tumor cell number dynamics of 100 random simulations are shown. Virtual tumors with randomly chosen initial tumor sizes (1010 to 51011cells) and different growth rates (0.0001 to 0.001/h) are simulated with (A) 0.851010TILs given twice, 1 month apart; (B) 0.111010TILs twice, 1 month apart; and (C) 1.351010TILs twice, 1 month apart. Tumors that have reduced in size to practical 0 (RECIST complete response, CR) are marked in red (thin solid line), tumors that have reduced by 30% (RECIST partial response, PR) are marked in blue (thick solid line). Tumors that have stabilized between 70% and 120% of their original size (RECIST stable disease, SD) are marked in green. Black (dotted line) marks time-dependent tumor cell numbers simulations that were nonresponsive, NR. The 2 ripples observed up to day 44 are due to the IL-2 treatment given for 2 weeks after each TIL transfusion. IL indicates interleukin; RECIST, Response Evaluation Criteria in Solid Tumors; TIL, tumor infiltrating lymphocyte.
rates—observed clinically and simulated mathematically— in Yee et al’s trial.
Multiple Infusions With Short-term Cultured T-cell Lines
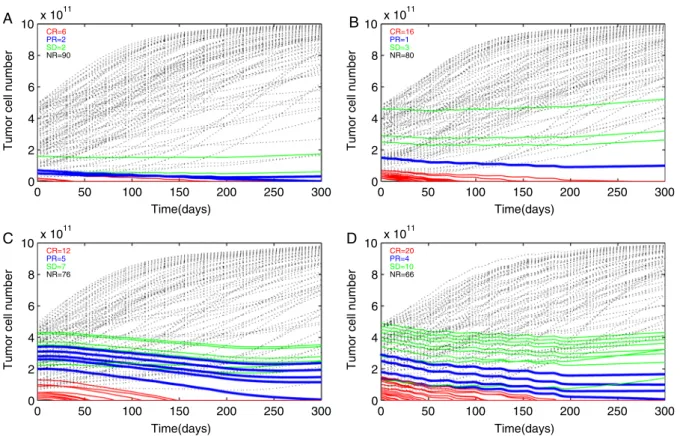
To address the question, how the number of infusions affects treatment success, we chose a study performed by Mackensen et al.25 Polyclonal T-cell lines were generated against a single epitope (MelanA/MART1) and infused (average: 2.1108 T cells). Three T-cell infusions were scheduled 2 weeks apart, followed by up to 10 infusions in 4-week intervals. IL-2 was administered for 6 days after each infusion. Eleven patients were treated.25One patient achieved a complete response and 1 patient achieved partial response; 2 others had stable disease and mixed reactions. Computer simulations of randomly selected virtual patients showed a positive response rate of 10% (at day 300 posttreatment), which is lower than the reported clinical data (36%, 3 mo minimal observation time) (Fig. 5A). Next, we used the model to search for more effective regimens, which were not observed in Mackensen clinical trial. Figure 5B shows that all other parameters being equal, increasing the T-cell dose to 5108cells (which is still 10 times less than the dose apllied in Yee et al26) increases response rates within the simulation to 20%. When T-cell mediated tumor lysis parameter was increased 2-fold (Table 1 in Supplemental Appendix, Supplemental Digital Content 1, http://links.lww.com/JIT/A157 ), a posi-tive effect was observed on 24% of the simulated patients
(Fig. 5C) combining higher lytic capacity and increased T-cell dose lead to a greatly increased efficacy of 34% (Fig. 5D).
Excessive T-cell Numbers Combined With Chemotherapy
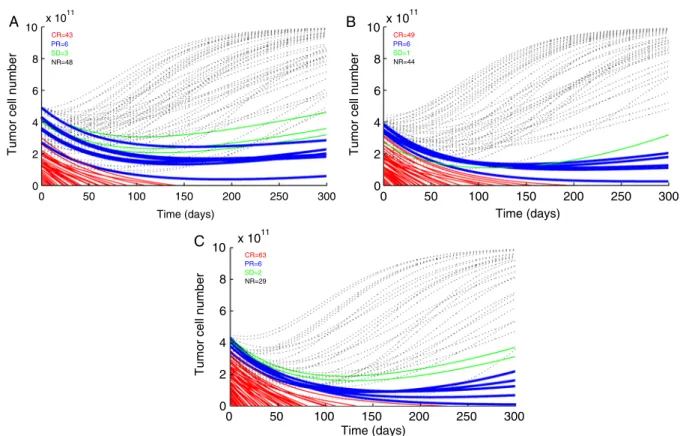
Whereas experimentally it is possible but difficult to assess differences in lytic capacity between different clinical studies, due to differences in handling the T cells and per-forming the assays, T-cell numbers are more comparable. A correlation between cell numbers and clinical efficacy was already established with the aforementioned simulations. However, the magnitude of the T-cell dose needed to achieve durable responses in most of the patients was unclear. We therefore analyzed data of a clinical trial performed by Steve Rosenberg group, in which a very high number of T cells were used—in fact, to the best of our knowledge, it is the highest number of T cells used and reported for adoptive T-cell therapy.27,29These studies have used nonmyeloablative chemotherapy before the TIL infusion. A total of 11011 cells were given in 1 bolus infusion and more importantly total body irradiation (TBI) therapy in a low dosage (2 Gy) and in high dosage (12 Gy) was added to the therapy.29The positive response rate was 13 of 25 (52%) and 18 of 25 (72%), respectively. In the simulations we show here, we chose to simulate the high-dose treatment assuming antigen specificity of 10% based on Table 3 in Dudley et al’s study.29When this high dose was given alone, a positive response in 52% of the patients
0 0.5 1 1.5 2 2.5 3 3.5 4 4.5 5 x 10¹¹ 0 2 4 6 8 10x 10 11 0 0.5 1 1.5 2 2.5 3 3.5 4 4.5 5 x 10¹¹ 0 2 4 6 8 10x 10 11 0 0.5 1 1.5 2 2.5 3 3.5 4 4.5 5 x 10¹¹ 0 2 4 6 8 10x 10 11
Final Tumor Size (cells)
Initial Tumor Size (cells)
FIGURE 3. Predictions of the final tumor cell number as a result of TIL dosage according to data derived from Khammari et al.24One hundred virtual patients were simulated as in Figure 2 except that TIL dose was also randomly chosen from 5 different dosages between 0.111010to 1.351010, given twice, 1 month apart. Upper illustration shows simulated treatment results using the lowest TIL dose, middle illustration shows simulated results using intermediate TIL dose (0.731010), and lower illustration shows simulated treatment results with the highest TIL dose. Red dashed line delineates the separation between responsive tumor sizes to its left, and nonresponsive tumor sizes to its right. TIL indicates tumor infiltrating lymphocyte.
was predicted (Fig. 6A). Next, we simulated a possible effect of low intensity TBI immediately before the TIL infusion. We assumed that such a treatment could decrease tumor load. Figure 6B shows that reducing tumor load by 10% increased positive responses to 56%. To simulate the high TBI treatment, we assumed that in addition to tumor size reduction, the high dose TBI sensitizes tumor cells to CTL-mediated lysis (eg, by an increase in tumor accessibility due to proinflammatory signals). Such a change in the tumor-CTL accessibility is reflected in the parameter, hT. A simu-lated increase of 33% results in a similar positive response in 71% of the virtual patients (Fig. 6C). The accessibility parameter hT is used in modeling tumor-immune inter-actions to attenuate the killing efficacy of CTLs as the tumor increases (for instance de Pillis et al30). Of all parameters used, it is the most difficult parameter to assess experimentally, as multiple events leading to a potential increase in sensitivity of the tumor cells for T-cell-mediated lysis may be represented by this parameter (eg, the elimination of regulatory T cells). However, it is a valid alternative explanation to increased efficiency of T-cell immunotherapy through a general effect on tumor sensi-tivity due to the preparative chemotherapy/radiotherapy, which results in higher response rates.
DISCUSSION
This new mathematical model, simulating 4 indepen-dent clinical trials, emphasizes 3 critical issues for this type of therapy: (1) cellular therapy is based on the functional capacity of each individually transferred cell; (2) even high T-cell numbers used for therapy will unlikely influence large and fast-growing tumors; and (3) the current classification
of tumors (stage and grade) needs to be refined for proper estimation of the residual tumor cell mass. Future model modifications may include classification of tumors by the metastatic sites and their malignancy scores. Currently, we feel, however, that even population size alone can provide us with ample insights and predictions as to the success of T-cell therapy.
Absolute tumor burden and growth dynamics can be estimated within a certain degree of certainty at the start of cellular therapy taking into account size, stage, and grade of the tumor. As demonstrated here, low initial tumor cell mass is critical for the success of T-cell therapy. For instance, although Mackensen et al25 do not report exact tumor burden, it is hard to ignore the fact that all patients that showed any response at all (mixed, partial, or stable disease) were the ones with only one disease site (Table 1 in Mackensen et al study), which is consistent with Kham-mari’s findings. This underlines the importance of quanti-tative effects in cancer progression and the existence of a window of opportunities for efficacious treatment.
In the simulations presented here, both tumor cell numbers and growth rates were randomly chosen within a preset range to simulate various biological preconditions. This hands-on way of simulating variable and parameter ranges is uncommon in mathematical articles modeling immunotherapy. However, we believe such simulations are closer to the clinical situation, and this way of presenting mathematical modeling may be more tangible for physician scientists. This model is based on the assumption that T cells lyse tumor cells repetitively throughout their life span. Therefore, it is logical that a T-cell dose effect will be observed, but the extent of this effect could not be foreseen. However, what is becoming evident by mathematical modeling and computer simulation is the degree to which cellular therapy needs to be augmented to expect a significant impact. The data clearly illustrates the quanti-tative effects for clinical trials: the T-cell dose ranged throughout all 4 studies from 1108 to 11011 T cells. Assuming the lytic activity of the cells being equal, there was little chance of a tumor response using Mackensen’s approach, whereas the use of a 1000 times higher T-cell dose combined with synergistic measures (such as TBI before therapy) increased the likelihood of a response significantly. Delving deeper into Dudley et al’s29data the percentage of CD8+cells of TILs is consistently higher for responders than for nonresponder patients (82.1% vs. 74.9% in the 2 Gy treatment, and 86.0% vs. 60.5% in the 12 Gy treatment). When comparing the percentage of specific Mart-1 of CD8+cells, we find the same trend as before, as responder patients were administered with a higher percentage of Mart-1 cells (19.6% vs. 3.4% in the 2 Gy treatment, and 2.8% vs. 1.6% in the Gy treatment). Therefore, the responder patients clearly received higher dosage of effective Mart-1 cells. Therefore, taking a mechanistic view of the T-cell effect, the broad range alone can explain success or failure of the respective regimen. This model allows for the first time to compare unrelated studies with immensely varying treatment schedules.
Very little data is available on the exact numbers required for an efficient immune response against tumor antigens. As shown in Figure 3, simulation suggests the existence of a threshold of T-cell dose that has to be crossed before an effect on the tumor can be observed. The existence of such a threshold in a tumor T-cell therapy type of system was predicted by Kogan et al.22Its clinical
0 100 200 300 0 2 4 6 8 10 x 10 11 Time (days)
Tumor cell number
CR=50
PR=4
SD=5
NR=41
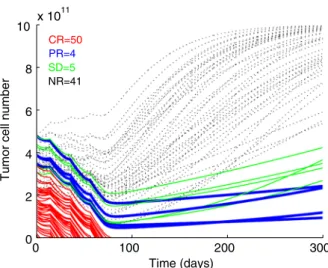
FIGURE 4. Simulations of time-dependent tumor cell number dynamics as a result of the Greenberg protocol (Yee et al).26 Infusions of 5.9109 (3.31091.8 m2 surface area of a human) were given at days 0, 14, 35, and 56. Tumors that have reduced in size to practical 0 (RECIST complete response, CR) are marked in red (thin solid line), tumors that have reduced by 30% (RECIST partial response, PR) are marked in blue (thick solid line). Tumors that have stabilized between 70% and 120% of their original size (RECIST stable disease, SD) are marked in green. Black (dotted line) marks time dependent tumor cell numbers simulations that were nonresponsive, NR. RECIST indicates Response Evaluation Criteria in Solid Tumors.
meaning is that the high renewal potential of the tumor renders any trial to just reduce the tumor and keep it in check, futile. Unless the tumor is eradicated, no long-term stable equilibrium can exist. If the doses used are just below and above the threshold, this effect will be most striking in the smallest tumors as can be seen in Figure 3.
In a recent study by Budhu et al,31the efficiency of T-cell-mediated killing has been carefully correlated with the T-cell concentration. It is shown that the efficacy of such killing significantly increases, once the T-cell dose is beyond a certain threshold. In Budhu et al’s study, it is demonstrated that—in an in vitro setting—a ratio of 1000:1 to 10:1 of effector-to-tumor cells ensures the elimination of a tumor cell population of 1104to 1106, respectively. When the researchers incubated melanoma B16 cells with T cells at roughly 1:1 ratio for 7 days in the presence of IL-2, they received nearly 100% killing. Without the presence of IL-2, the researchers required a 20:1 ratio to achieve tumor eradication and the functionality of the T cells lasted for only 5 days. A distinct threshold value of T cells is apparent below which the effect of T-cells is very weak and above which it is dramatic (Budhu et al 2010, Fig. 5). The existence of a numerical threshold effect has recently been predicted in a mathematical analysis of the immunotherapy
for treatment of glioblastoma.22Such stepwise function of immunotherapy is counter intuitive for the physician— although not entirely unfamiliar when thinking of pharma-cokinetics and pharmacodynamics. Identifying this step on the basis of mathematical modeling may increase the success rate of cellular immunotherapy.
In a clinical setting, a T-cell dose in the order administered by the Rosenberg group (11011), which may be called a supraphysiological T-cell dose, may induce a cytokine storm—with release of interferon-g, IL-8, tumor necrosis factor-a etc. Ultimately, the inhibitory milieu of the tumor environment might be overcome, leading to upregulation of MHC class-I expression on the tumor cells and consequently increased tumor cell lysis.
In summary, mathematical modeling holds the promise that immunology—and especially human immunology—is not just a black box, where the effects of a certain treatment are unpredictable, but that before a clinical trial the interplay between crucial parameters can be analyzed and predicted. The model is dependent on quantitative data: some of the parameters implemented in the model are deduced from diverse sources. The accuracy of model prediction can be improved, when such quantitative data are available for each individual study. It seems therefore
0 50 100 150 200 250 300 0 2 4 6 8 10 x 10 11 Time(days)
Tumor cell number
CR=6 PR=2 SD=2 NR=90 0 50 100 150 200 250 300 0 2 4 6 8 10 x 10 11 Time(days)
Tumor cell number
CR=16 PR=1 SD=3 NR=80 0 50 100 150 200 250 300 0 2 4 6 8 10 x 10 11 Time(days)
Tumor cell number
CR=12 PR=5 SD=7 NR=76 0 50 100 150 200 250 300 0 2 4 6 8 10 x 10 11 Time(days)
Tumor cell number
CR=20 PR=4 SD=10 NR=66 B A D C
FIGURE 5. Simulations of time-dependent tumor cell number dynamics as a result of the Mackensen et al25clinical trial (A) and simulated improvement to the trial (B), (C), and (D). Simulations of time-dependent tumor cell number dynamics of 100 random simulations are shown. Virtual tumors with randomly chosen initial tumor sizes (1010to 51011cells) and different growth rates (0.0001 to 0.001/h) are simulated with (A) a presumed general Mackensen regimen (2.1108cell given 10 times at intervals indicated in the text). B, All parameters the same as in (A) except CTL dose simulated here to be 5108(A). C, All parameter the same as in (A) except the CTL-induced tumor cell kill rate is simulated here to be twice as in (A). D, Combined effect of intensified regimens in (B) and (C). Tumors that have reduced in size to practical 0 (RECIST complete response) are marked in red (thin solid line), tumors that have reduced by 30% (RECIST partial response) are marked in blue (thick solid line). Black (dotted line) marks time-dependent tumor cell numbers simulations that were nonresponsive. RECIST indicates Response Evaluation Criteria in Solid Tumors.
necessary to raise the awareness of cellular therapists for the potential of mathematical modeling and improve the quality of quantitative data.
But even without exact data on tumor size and growth rate, we tried to account for biological variability by allowing a range of initial tumor sizes and growth rates. The efficacy of the T cells—being regarded as “serial killers” in this model—may be lower than the values used for simulation, thus, if anything, required T-cell doses would even be higher.
Proliferation of tumor-specific T cells may be crucial to solve the need for large amounts of T cells as simulated in this study. The proliferative capacity of antigen-primed T cells depends on the differentiation state: late stage effector cells have a good lytic capacity but poor proli-ferative capacity and little in vivo persistence, whereas early effector memory T cells or central memory T cells have the capacity to further expand in vivo. Exciting new studies point toward differentiation pathways that can be manipu-lated ex vivo to maintain or induce a central memory phenotype, thus increasing the persistence, functionality, and the potential efficacy of such T cells.32–34
Biomathematical modeling of T-cell immunotherapy has its greatest value, when sufficient numbers of T cells are available. In fact, we recently calculated for a glioblastoma model, that—technical challenges aside—a constant rate of
T-cell infusions directly into the tumor bed over a pro-longed time (weeks) may defeat even large tumors22; such regimen also avoids peak T-cell load. Mathematical model-ing can also predict the minimum number of T cells needed to have a reasonable chance to have an impact onto the residual tumor masses. In other words, mathematical modeling can provide the order of magnitude of the T-cell treatment required.
We are aware of the technical challenges of generation and application of such large numbers of antigen-specific T cells. However, for some antigens such as Melan-A, using improved protocols, the T cells can already be expanded to very high numbers within a short culture time,6 or—for antigens with a lower T-cell precursor frequency—large numbers of peripheral blood mononuclear cell can be transduced to express modified and functionally improved tumor-specific T-cell receptors.4 At the same time recent reports on severe adverse events after adoptive immuno-therapy7and preclinical animal models showing significant toxicity after transferringTCRgene transferred peripheral blood mononuclear cell also emphasize the risks of T-cell immunotherapy and stress the need for meticulous pre-clinical evaluation including mathematical modeling. Math-ematical modeling can help rationalize the design of either appropriate dose per patient, or alternatively determine exclusion criteria, for patients with large tumor burden in
0 50 100 150 200 250 300 0 2 4 6 8 10 x 10 11 Time (days)
Tumor cell number
CR=43 PR=6 SD=3 NR=48 0 50 100 150 200 250 300 0 2 4 6 8 10x 10 11 Time (days)
Tumor cell number
CR=49 PR=6 SD=1 NR=44 0 50 100 150 200 250 300 0 2 4 6 8 10 x 10 11 Time (days)
Tumor cell number
CR=63 PR=6 SD=2 NR=29 A B C
FIGURE 6. Simulations of time-dependent tumor cell number dynamics as a result of the Rosenberg intensive protocol.29A, 11011 (multiplied by 0.1 assumed antigen specificity ratio) antigen-specific T cells given in a 1 time bolus infusion. B, The same treatment as in (A) given to tumors 20% smaller than the initial tumor size in (A). C, The same treatment as in (A) given to tumors 20% smaller than the initial tumor size in (A) and hTlarger by 33%. Tumors that have reduced in size to practical 0 (RECIST complete response) are marked in red (thin solid line), tumors that have reduced by 30% (RECIST partial response) are marked in blue (thick solid line). Black (dotted line) marks time dependent tumor cell numbers simulations that were nonresponsive. RECIST indicates Response Evaluation Criteria in Solid Tumors.
case large CTL (or TIL) dose is unavailable. In summary, mathematical modeling can help pick the right schedule for the right patient and thus hopefully improve treatment success.
ACKNOWLEDGMENTS
The authors thank Dr Michal Besser of the Ella Institute for the Treatment and Research of Melanoma and Skin Cancer at the Sheba Medical Center for helpful discussions.
CONFLICTS OF INTEREST/ FINANCIAL DISCLOSURES
N.K. and Y.K. were supported by the Chai foundation. M.W. is the recipient of a postdoctoral stipend from the Child-Philipp-Foundation (T/237/16586/2007), Germany. This study was supported by a Program Project Grant from BayImmuNet (to M.W. and P.G.S.) (F2-F5121.7.1.1/13/1/2009).
All authors have declared there are no financial conflicts of interest in regard to this work.
REFERENCES
1. June CH. Adoptive T cell therapy for cancer in the clinic.
J Clin Invest. 2007;117:1466–1476.
2. Disis ML, Bernhard H, Jaffee EM. Use of tumour-responsive T cells as cancer treatment.Lancet. 2009;373:673–683. 3. June CH. Principles of adoptive T cell cancer therapy.J Clin
Invest. 2007;117:1204–1212.
4. Kershaw MH, Teng MW, Smyth MJ, et al. Supernatural T cells: genetic modification of T cells for cancer therapy. Nat Rev Immunol. 2005;5:928–940 [Doi:nri1729 [pii] 10.1038/nri1729. 5. Stromnes IM, Blattman JN, Tan X, et al, Abrogating cbl-b in
effector CD8(+) T cells improves the efficacy of adoptive therapy of leukemia in mice. J Clin Invest 120 (10):3722-3734. Doi:41991 [pii] 10.1172/JCI41991.
6. Wolfl M, Merker K, Morbach H, et al, Primed tumor-reactive multifunctional CD62l(+) human CD8 (+) T cells for immunotherapy. Cancer Immunol Immunother. [Doi:10.1007/ s00262-010-0928-8].
7. Morgan RA, Yang JC, Kitano M, et al, Case report of a serious adverse event following the administration of T cells transduced with a chimeric antigen receptor recognizing erbb2. Mol Ther 18 (4):843-851. Doi:mt201024 [pii] 10.1038/mt.2010.24.
8. Warren EH, Fujii N, Akatsuka Y, et al, Therapy of relapsed leukemia after allogeneic hematopoietic cell transplantation with T cells specific for minor histocompatibility antigens. Blood 115 (19):3869-3878. Doi:blood-2009-10-248997 [pii] 10.1182/blood-2009-10-248997.
9. Yeh S, Karne NK, Kerkar SP, et al. Ocular and systemic autoimmunity after successful tumor-infiltrating lymphocyte immunotherapy for recurrent, metastatic melanoma. Ophthal-mology. 2009;116:981–989 e981.
10. Anderson AR, Quaranta V. Integrative mathematical onco-logy.Nat Rev Cancer. 2008;8:227–234.
11. Itik M, Banks SP. Chaos in a three-dimensional cancer model.
Int J Bifurcation Chaos. 2010;20:71–79.
12. Eftimie R, Bramson JL, Earn DJ, Interactions between the immune system and cancer: a brief review of non-spatial mathe-matical models. Bull Math Biol. Doi:10.1007/s11538-010-9526-3. 13. De Boer RJ, Hogeweg P, Dullens HF, et al. Macrophage
T lymphocyte interactions in the anti-tumor immune response: a mathematical model.J Immunol. 1985;134:2748–2758. 14. Takayanagi T, Ohuchi A. A mathematical analysis of the
interactions between immunogenic tumor cells and cytotoxic T lymphocytes.Microbiol Immunol. 2001;45:709–715. 15. Kuznetsov VA, Makalkin IA, Taylor MA, et al. Nonlinear
dynamics of immunogenic tumors: parameter estimation and global bifurcation analysis.Bull Math Biol. 1994;56:295–321.
16. Joshi B, Wang X, Banerjee S, et al. On immunotherapies and cancer vaccination protocols: a mathematical modelling approach.J Theor Biol. 2009;259:820–827.
17. d’Onofrio A, Gatti F, Cerrai P, et al.Delay-induced Oscillatory Dynamics of Tumour-immune System Interaction Mathematical and Computer Modelling. 2009;51:572–591.
18. Kirschner D, Panetta JC. Modeling immunotherapy of the tumor-immune interaction.J Math Biol. 1998;37:235–252. 19. Wang Z, Birch CM, Sagotsky J, et al. Cross-pathway
evaluation using an agent-based non-small cell lung cancer model.Bioinformatics. 2009;25:2389–2396.
20. Woelke AL, Murgueitio MS, Preissner R. Theoretical model-ing techniques and their impact on tumor immunology.
Clin Dev Immunol. 2010;271794 Doi:10.1155/2010/271794. 21. Kronik N, Kogan Y, Vainstein V, et al. Improving alloreactive
CTL immunotherapy for malignant gliomas using a simulation model of their interactive dynamics..Cancer Immunol Immun-other. 2008;57:425–439 Doi:10.1007/s00262-007-0387-z. 22. Kogan Y, Fory´s U, Shukron O, et al. Cellular immunotherapy
for high grade gliomas: mathematical analysis deriving efficacous infusion rates based on patient requirements.SIAM J App Mathematics. 2010;70:1953–1976.
23. Eisenhauer EA, Therasse P, Bogaerts J, et al. New response evaluation criteria in solid tumours: revised RECIST guideline (version 1.1).Eur J Cancer. 2009;45:228–247.
24. Khammari A, Nguyen JM, Pandolfino MC, et al. Long-term follow-up of patients treated by adoptive transfer of melanoma tumor-infiltrating lymphocytes as adjuvant therapy for stage iii melanoma.Cancer Immunol Immunother. 2007;56: 1853–1860.
25. Mackensen A, Meidenbauer N, Vogl S, et al. Phase I study of adoptive T-cell therapy using antigen-specific CD8+ T cells for the treatment of patients with metastatic melanoma.J Clin Oncol. 2006;24:5060–5069.
26. Yee C, Thompson JA, Byrd D, et al. Adoptive T cell therapy using antigen-specific CD8+ T cell clones for the treatment of patients with metastatic melanoma: in vivo persistence, migration, and antitumor effect of transferred t cells.Proc Natl Acad Sci U S A. 2002;99:16168–16173.
27. Dudley ME, Wunderlich JR, Yang JC, et al. A phase I study of nonmyeloablative chemotherapy and adoptive transfer of autologous tumor antigen-specific T lymphocytes in pa-tients with metastatic melanoma. J Immunother. 2002;25: 243–251.
28. Benlalam H, Vignard V, Khammari A, et al. Infusion of melan-a/mart-1 specific tumor-infiltrating lymphocytes en-hanced relapse-free survival of melanoma patients. Cancer Immunol Immunother. 2007;56:515–526.
29. Dudley ME, Yang JC, Sherry R, et al. Adoptive cell therapy for patients with metastatic melanoma: evaluation of intensive myeloablative chemoradiation preparative regimens. J Clin Oncol. 2008;26:5233–5239.
30. de Pillis LG, Radunskaya AE, Wiseman CL. A validated mathematical model of cell-mediated immune response to tumor growth.Cancer Res. 2005;65:7950–7958.
31. Budhu S, Loike JD, Pandolfi A, et al. CD8+ T cell con-centration determines their efficiency in killing cognate antigen-expressing syngeneic mammalian cells in vitro and in mouse tissues. J Exp Med 207:223-235. Doi:jem.20091279 [pii] 10.1084/jem.20091279.
32. Araki K, Turner AP, Shaffer VO, et al. Ahmed RMtor regulates memory CD8 T-cell differentiation. Nature. 2009;460:108–112.
33. Rao RR, Li Q, Odunsi K, et al, The mtor kinase determines effector versus memory CD8+ T cell fate by regulating the expression of transcription factors t-bet and eomesodermin. Immunity 32 (1):67-78 Doi:S1074-7613(09)00545-7 [pii] 10.1016/j.immuni.2009.10.010.
34. Butler MO, Friedlander P, Milstein MI, et al. Establishment of antitumor memory in humans using in vitro-educated CD8+ T cells.Sci Transl Med. 2011;3:80ra34.