EVALUATION AND CHARACTERIZATION OF QTL CONTROLLING SEED
COMPOSITION IN SOYBEAN AND BREEDING FOR RESISTANCE TO SUDDEN DEATH SYNDROME OF SOYBEAN
BY
TIMOTHY IGNATIUS PRUSKI
DISSERTATION
Submitted in partial fulfillment of the requirements for the Doctor of Philosophy in Crop Sciences
in the Graduate College of the
University of Illinois at Urbana-Champaign, 2012
Urbana, Illinois
Doctoral Committee:
Professor Brian Diers, Chair Professor Glen Hartman Professor Steven Huber Professor Randall Nelson
ii
ABSTRACT
The first quantitative trait locus (QTL) mapping study in soybean (Glycine max) was published over twenty years ago. Since then numerous QTL mapping studies have been
performed for most traits of economic interest within the soybean research community. Though many putative QTL regions have been identified follow up breeding work that is necessary for the practical use of these regions within breeding programs is lacking. In this research, follow up breeding work is performed on QTL controlling seed composition in soybean and QTL
conferring resistance to sudden death syndrome of soybean.
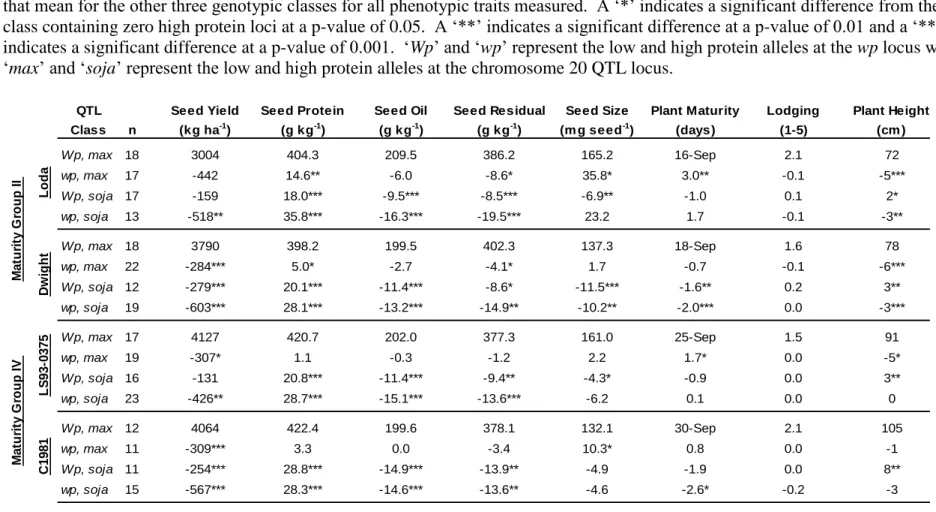
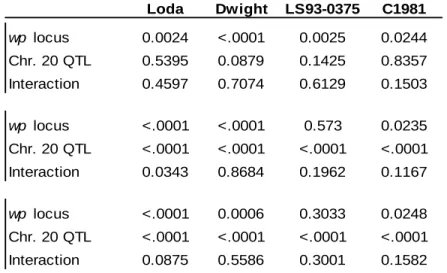
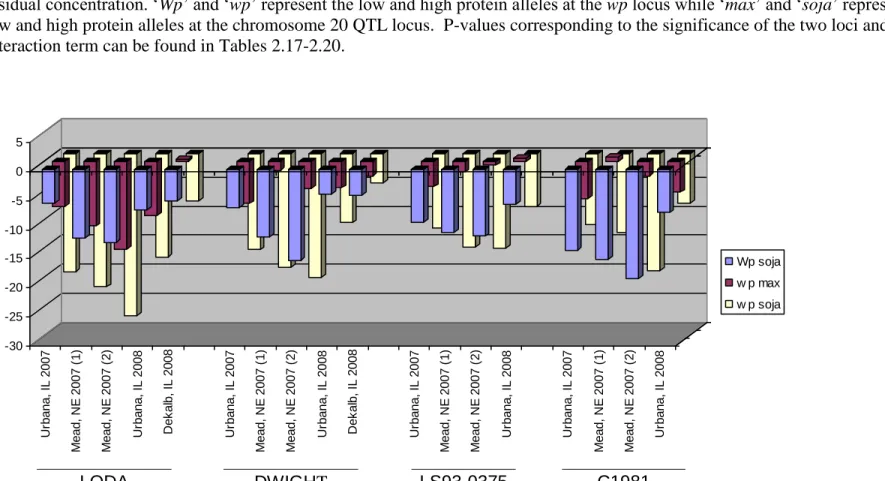
In chapter 2, a genetic locus conferring pink flowers, the wp locus, and a confirmed seed protein concentration QTL located on chromosome 20 are evaluated in four genetic backgrounds for associations with the traits: protein concentration, oil concentration, yield, plant height, seed size, plant maturity and lodging. The chromosome 20 QTL increased protein concentration and plant height while the QTL decreased oil concentration, yield, seed size, and days to maturity consistently across environments and genetic backgrounds. The wp locus increased protein concentration, seed size, and days to maturity but decreased oil concentration, yield, and plant height variably across genetic backgrounds and environments. Significant associations between the wp locus and the tested traits were most frequently observed in the Loda background. Significant interactions between the wp locus and the chromosome 20 QTL were rarely detected as the two genomic regions generally acted independent of each other for the traits tested. Lines containing high protein alleles at both loci often had the largest increase in protein concentration but also had the largest decreases in oil concentration and seed yield. The wp locus was
generally associated with a greater yield decrease and a smaller increase in protein concentration than the chromosome 20 QTL. The wp locus appears to be a poor candidate for use within a marker assisted selection program because of the inconsistent increases in protein concentration and the consistent, large decreases in seed yield associated with it.
In chapter 3, the chromosome 20 protein QTL is evaluated in four genetic backgrounds across ten environments for associations with the traits: protein concentration, oil concentration, yield, plant height, seed size, plant maturity and lodging. Protein concentration and oil
concentration were significantly associated with the QTL across genetic backgrounds and environments. The size of the QTL effect varied across environments. In the maturity group IV genetic backgrounds, significant increases in the size of the QTL effect were observed when the
iii
populations were grown in more southern locations. The magnitude differences observed for seed oil concentration were significantly associated with temperature and day length. Seed yield was variably associated with the QTL across genetic backgrounds and environments. This result suggests that environment and genetic background may influence the size and magnitude of the associated decrease in seed yield that is often observed with an increase in seed protein
concentration for this QTL.
In chapter 5, a previously identified QTL conferring resistance to sudden death syndrome (SDS) from the cultivar Ripley and located on chromosome 19 was tested and confirmed
(p<0.01) using greenhouse screening assays. The chromosome 19 QTL and a previously identified and confirmed QTL from Ripley located on chromosome 17 were backcrossed four generations in five genetic backgrounds to validate the QTL effects when the QTL have been transferred to different, relevant breeding backgrounds. The QTL conferred resistance to SDS variably across genetic backgrounds. This variability was observed in the greenhouse and the field.
iv
TABLE OF CONTENTS
CHAPTER 1: LITERATURE REVIEW OF BREEDING FOR ELEVATED PROTEIN
CONCENTRATION IN SOYBEAN……….……….1
CHAPTER 2: BREEDING WITH TWO QTL THAT CONDITION HIGH PROTEIN CONCENTRATION AND THEIR EFFECT ON OTHER AGRONOMIC
TRAITS.………...…………..………...………....23
CHAPTER 3: STABILITY OF THE CHROMOSOME 20 SEED COMPOSITION QTL
FROM PI 468916 ACROSS VARYING ENVIRONMENTAL CONDITIONS.….…...69
CHAPTER 4: LITERATURE REVIEW OF BREEDING FOR RESISTANCE TO
SUDDEN DEATH SYNDROME OF SOYBEAN………...………..114
CHAPTER 5: BREEDING WITH QUANTITATIVE TRAIT LOCI IDENTIFIED FROM A RECOMBINANT INBRED LINE POPULATION DEVELOPED FROM A CROSS
v
ACKNOWLEDGEMENTS
I would like to thank my adviser Dr. Brian Diers for providing me the opportunity to pursue my PhD within his program. Brian’s guidance proved invaluable in terms of successful completion of this research and preparation of this dissertation. I would also like to thank my committee members Dr. Randy Nelson, Dr. Glen Hartman, and Dr. Steve Huber for providing me with suggestions and thoughtful discussion on my research. I’d also like to acknowledge and thank the collaborators that contributed significantly to this work by growing research plots and collecting data at non-Illinois field sites. Dr. James Specht contributed to work performed in chapters 2 and 3. Additional collaborators for the chapter 3 work include Dr. Katy Martin Rainey, Dr. Pengyin Chen, Dr. James Orf, Dr. J. Rusty Smith, and Dr. Dechun Wang. For the chapter 5 work acknowledgment and thanks are extended to Dr. Glen Hartman, C. Roger Bowen, Laura Crull, Tara Slaminko, and Cathy Schmidt for the varying levels of assistance and guidance they provided with field and greenhouse SDS screening assays. Thanks also to past and present Diers Lab graduate students, undergraduate research assistants, and research technicians that have contributed to the completion of this work. Special thanks are extended to Troy Cary, Sarah Schultz, and Carol Bonin who all three have helped me over the years in too many ways to even begin to catalog here. Finally, I’d like to thank my parents Dennis and Rita for always pushing me to strive for academic achievement and my wife Roberta, for her unyielding support and encouragement.
1
CHAPTER 1: LITERATURE REVIEW OF BREEDING FOR ELEVATED
PROTEIN CONCENTRATION IN SOYBEAN
Introduction
The inability to increase the amount of protein in soybean seed while maintaining yield has been an ongoing frustration for soybean breeders. The soybean seed contains approximately 40% crude protein and almost optimal levels of essential amino acids for monogastric livestock production systems. The combination of high protein concentration and optimal levels of essential amino acids has allowed the crop to be a valuable protein rich food source for livestock (Smith, 2001). Poultry and swine are the main consumers of soybean protein meal, however, it is also used in beef, dairy, and aquaculture production systems (American Soybean Association, 2009). Soybean protein meal comprised 68% of the world protein meal consumption in 2008 (American Soybean Association, 2009). In the United States, roughly three fourths of the domestic meal production is utilized on livestock operations within the country, whereas the rest is exported (15% of the global soybean protein meal exports) (American Soybean Association, 2009). Increasing the value of the soybean and the meal produced from it can only help maintain and increase soybean’s domestic and global protein meal market share. One way to accomplish this is through an increase in total seed protein concentration (Wilson, 2004).
Increasing the percentage of protein in soybean seed would allow for the development of soybean cultivars more specifically designed for animal feed production. Soybean meal
produced from high protein cultivars produce a meal with greater percent protein (Wilson, 2004). Additionally, increasing the total crude protein in soybean meal above the current high standard of 48% will improve the meal by offering a greater supply of the limiting essential amino acids (Wilson, 2004).
Edwards et al. (2000) showed that soybean meal produced from high protein genotypes had a positive effect when fed to broiler chickens. Baker and Stein (2009) concluded that soybean meal produced from a high protein soybean cultivar had a higher feeding value than soybean meal produced from cultivar with normal protein levels when fed to growing pigs. High protein soybean cultivars would also be beneficial for direct feeding applications.
Previous estimates of direct feed use of full fat and partially defatted soybean as a percentage of domestic feed were roughly twelve percent (Lusas, 2004). Full fat and partially
2
defatted soybean meal has been important in the monogastric livestock industry as well as the dairy industry (Lusas, 2004). In a Holstein dairy cow feeding study, McNiven et al. (1994) found that feeding dry roasted soybeans from a high protein cultivar was beneficial to providing dry roasted soybeans or untreated soybeans from a cultivar with traditional protein levels. Substituting the dry roasted high protein cultivar for a traditional soybean meal increased total milk yield and percent lactose, while decreasing percent crude protein and percent fat in the milk. The authors concluded the high protein cultivar appeared to be an exceptional
supplemental energy and protein source for lactating dairy cows. Regardless of the feeding system, the livestock industry would benefit from a soybean cultivar with an increased seed protein concentration.
Factors that Contribute to Final Seed Composition
Many contributing factors determine the final seed composition of a soybean cultivar. These factors can be grouped in to three major categories: cultural practices, genetic content, and environmental conditions. Often combinations of these broad categories play major roles in determining the final seed composition. Below, these factors and their effect on seed
composition will be reviewed, starting with the variable temperature.
Temperature has been shown to greatly effect seed composition. In temperature controlled greenhouse and growth chamber studies results have varied from study to study. In general, seed oil concentration increases with increasing temperature, though leveling off and sometimes declining upon reaching a maximum temperature (Sato and Ikeda, 1979; Wolf et al., 1982; Gibson and Mullen, 1996; Dornbus and Mullen, 1992), though contradictory findings to this maximum temperature peak for high oil concentration have been observed (Ren et al., 2009). Protein concentration has been shown to remain relatively constant at lower temperatures but tends to increase with increasing temperatures after 28° C (Sato and Ikeda, 1979; Gibson and Mullen, 1996; Dornbus and Mullen, 1992). Field data have shown similar results as these controlled environment tests.
Using a large data set from the soybean uniform tests, Piper and Boote (1999) attempted to account for a protein discrepancy detected between northern and southern germplasm with mean daily temperature estimated from first pod (with SOYGRO) to the observed maturity date. The data covered twenty check cultivars representing ten maturity groups spanning twenty years
3
and over sixty locations. An analysis of the cultivars showed a negative correlation between oil and protein concentration. The negative correlation was generally more pronounced in the maturity groups grown in the more northern latitudes. A linear regression was performed between oil and protein concentration against mean temperature. For oil concentration, all cultivars had a positive slope meaning as temperature increased so did oil concentration, though the earlier maturity groups tended to have a larger slope. Protein concentration was different, in that for the early maturity groups, the regression of protein concentration on temperature
produced negative slopes. The later maturity groups had a positive slope while the intermediate groups did not have a significant slope. Blocking by cultivar to analyze the data together, oil and protein was found to best fit a quadratic model with temperature. Oil concentration increased with temperature and approached a maximum at 28° C. The temperature and cultivar effect accounted for nearly equal proportions of the variation explained by the model (R2= 0.4602). This contrasts with protein concentration in which temperature accounted for a very small proportion (R2=0.0166) of the variation compared to the cultivar effect (R2=0.3171). Other multi-environment experiments have attempted to evaluate the effect of temperature and other environmental factors on seed composition.
Masetri et al. (1998) evaluated twelve cultivars from three maturity groups across four locations for one year. Locations differed for latitude, altitude, temperature, and precipitation. Latitude and precipitation had a significant negative association with protein concentration. Precipitation and temperature had significant negative associations with oil concentration. Altitude was positively correlation with both oil and protein concentration. Temperature for protein concentration and latitude for oil concentration both had negative correlation
coefficients; however neither of them was significant.
Dardanelli et al. (2006) examined multi environment trials over a three year span. This study was focused on investigating the effect of maturity groups with environments and the interaction for oil, protein, and oil + protein. Six maturity groups were assessed across at least fourteen environments per year. Environments differed for latitude, altitude, temperature, and precipitation. It was found that maturity groups II-IV provided the highest oil concentration across all Argentine environments. Two to three mega environments were identified for protein concentration. These correspond to maturity group II-III and maturity group VI cultivars depending upon location. Temperature was hypothesized to explain the consistent pattern of oil
4
across environments. This is due to short season maturity groups being exposed to higher temperatures during seed fill. Delayed planting dates also showed the same relative effect. In lower latitudes, the classic inverse relationship between oil and protein was not observed.
Bellaloui et al (2008) examined the effect of maturity on seed composition. An earlier study (Dardanelli et al., 2006) had found effects of maturity group on seed composition, however, that study did not account for genetic background. In Bellaloui et al. (2008), they accounted for genetic background by testing the effect maturity had on protein concentration in two sets of isogenic lines segregating for maturity genes. The two sets were developed from the cultivars Clark and Harosoy. Results were inconsistent across genetic backgrounds for the relationship between seed protein concentration and maturity. Both sets displayed a negative linear relationship between maturity and oil concentration of the seed.
Drought conditions have also been shown to affect seed composition and a number of studies have reported conflicting results when it comes to the effect of drought conditions on seed composition in soybean. Dornbos and Mullen (1992) used a greenhouse environment with drip irrigation to simulate drought for two cultivars over two years. To simulate drought
conditions, water (100%, 75%, 50% soil saturation daily) and air temperature (27 – 35 C) were used as treatment effects. Across all experiments, severe drought conditions (highest air
temperature and strictest water regiment) increased protein concentration by 4.4% and decreased oil concentration by 2.9%. Furthermore, the increase of protein and decrease of oil concentration occurred in a linear fashion as environmental drought stress increased.
Specht et al. (2001) studied the genetic basis of soybean yield response to water deficits in a large recombinant inbred line (RIL) population. The second year of this two year study was characterized by substantial water deficits that coincided with windy, hot days. The lack of moisture in the soil and presence of daily conditions that promote high transpiration rates led to severe drought conditions. The experiment included six irrigation treatments that ranged from 0% to 100% evapotranspiration water replenishment for the experimental plots. In contrast to the results of Dornbos and Mullen (1992), protein concentration decreased as water deficits increased. Conversely, oil concentration increased in a consistent fashion as the availability of water decreased. The water deficits also tended to cause the plants to be shorter, mature earlier, and produce smaller seed.
5
Carrera et al. (2009) found results similar to the Specht et al. (2001) study. Using a data set from 82 soybean multi-environment trials, they attempted to relate temperature and water availability with seed composition through a multiple regression approach. When water was not limiting, increasing temperature during seed fill was associated with increasing seed oil
concentration and a minimal decrease in protein seed concentration. When water was limiting, both oil and protein concentration increased with increasing temperature during seed fill, however oil concentration increased and protein concentration decreased with increasing water deficits within the limited water environment. These results are in agreement with Specht et al. (2001) but differ rather starkly with the results Dornbos and Mullen (1992) attained. Carrera et al. (2009) speculated that the difference in effects could be due to differences in timing of the stress itself. Timing could be an issue because protein deposition starts before oil deposition; therefore, an earlier stress may affect protein deposition more harshly (Carrera et al., 2009).
Bellaloui and Mengistu (2007) evaluated the effect of irrigation regimes within an early soybean production system in the mid-south (Mississippi). The effects evaluated were seed composition, nitrogen fixation, and yield. Two cultivars, a maturity group II and a maturity group V were grown at one location, over two years. These cultivars were subjected to full season irrigation, reproductive irrigation, and no irrigation regimes. The group II line had increasing protein and decreasing oil concentration as water supplementation increased, whereas the group V line showed an opposite effect. The authors speculated that this differential
response could be due to maturity, genotypic differences, and level of water stress, though they couldn’t rule out the effects of natural rainfall and temperature. A number of these reasons could help explain the discrepancy seen in studies that have examined seed composition and drought. The environmental conditions that can effect seed composition in this review have so far dealt with these factors at the macro level. Environmental factors can just as easily affect soybean at the field level in the form of spatial variability.
Spatial variability in the field can affect soybean seed composition. Vollman et al. (1996) evaluated protein concentration for a set of maturity group 000 – I breeding trials planted in a generalized lattice design. Significant field spatial variation for protein seed concentration was identified and ranged from -25 – 30 g/kg. Factors that contributed to this variation were not identified. Field topography and weather patterns were shown to influence protein concentration in a two year, five field study (Kravchenko and Bullock, 2002). They found higher protein
6
concentration at sites with higher elevation, higher slopes, or convex curvature during growing seasons with sufficient or excess precipitation. When the growing season was dry, these sites corresponded to the areas in the field that produced seed that had the lowest protein
concentration. Martin et al. (2007) evaluated the ability to predict oil and protein concentration based on site properties as well as vegetative indices. The soybean seed protein and oil
concentration responded inconsistently to site properties due to the interaction with seasonal rainfall.
Cultural practices have also been shown to influence soybean seed composition. The effect of planting date on final seed composition is largely influenced by the specific changes in growing conditions the plants will experience based on the planting date at the location
(Robinson et al., 2009; Dardanelli et al., 2006). Likewise, the choice of maturity group can influence the environmental conditions that developing soybean is exposed. For example, in the midsouthern United States, the early soybean production system (ESPS) was developed to avoid drought stress during the reproductive periods of maturity group V – VII cultivars. In this system, maturity group IV and V cultivars are planted and harvested earlier than the traditional cultivars of the midsouth. Kane et al. (1997) found that delayed planting of early maturing varieties in Kentucky increased protein concentration and decreased oil concentration. Increasing planting density also tended to increase protein concentration and decrease oil
concentration (Cober et al., 2005). Temperly and Borges (2006) found that protein concentration tended to decrease over consecutive years of soybean in a conventional tillage system. They found no such effect in the no-till system. An increase in oil concentration was detected in conventional and no-till systems as years of consecutive soybeans increased. Sugimoto et al. (1998) showed that oil concentration increased while protein concentration decreased when nitrogen is applied at flowering. In general, cultural practices play a relatively small role in terms of scope and impact on seed composition.
Breeding for Elevated Seed Protein Concentration
Breeding for altered seed composition has received significant attention and resources. Traditional breeding strategies to improve protein concentration have been met with mixed results. In most cases, the strategies have been a success when it comes to increasing protein
7
concentration, however they have often failed to keep yield and oil concentration at acceptable levels.
Successful breeding for a quantitative trait, such as elevated levels of seed protein, requires a number of parameters to be present. Precise phenotyping techniques, high
heritabilities, and available genetic variation are necessary variables that need to be considered when evaluating the potential effectiveness of selection for a quantitative trait. Selection for seed protein levels meets all three of these criteria. Protein composition can be measured
through a number of assays; however, the most widely used technique during the past forty years has been near-infrared spectroscopy (NIRS).
The development of NIRS gave breeders a quick, cheap, high-through put method to obtain accurate seed composition data. NIRS works by measuring the composite spectrum of near-infrared radiation produced (transmitted, reflected, and absorbed) by a compound and then relating this measurement to a reference analysis, in which values were obtained via standard laboratory method (Workman and Shenk, 2004). Hymowitz et al. (1974) found correlations between the Kjeldahl procedure (standard nitrogen determination method) and NIRS for soybean seed protein concentration to be 0.996.
Ample genetic variation for a trait is also a key requirement for genetic gain to be possible. The USDA Soybean Germplasm Collection is a repository of genetic variation. Examining accessions located within the collection can give a snapshot of the natural variation that exists for a particular trait. 19,765 accessions have a phenotypic value listed within the germplasm information research network (GRIN) soybean collection database for protein
concentration (USDA, 2009). The overall range spans from a low range of 28.5-32.0% to a high range of 56.7 – 60.2% (USDA, 2009). The majority of the accessions fall within a range of 39.1 – 49.6% (USDA, 2009). This snapshot indicates that significant natural variation for protein concentration exists, but to successfully breed for elevated protein levels, this variation needs to be heritable.
Heritability estimates for protein concentration have often been very high. Brummer et al. (1997) examined eight different populations for seed oil and protein concentration. Among these populations, heritabilites ranged from 0.56 – 0.92. Within the literature, calculated
heritabilities for protein in populations consistently fall within the 0.56 – 0.92 heritability range. Based on the genetic variation present, the heritable nature of the trait, and the precise and easy
8
phenotyping techniques available it would seem that breeding for increased seed protein would be relatively easy and successful. In and of itself, breeding for increased protein seed levels is not the problem. Lines can be developed with elevated levels of seed protein. The problem lies with the negative correlation of beneficial traits with seed protein.
Seed oil and yield are, in most instances, negatively correlated with seed protein. The presence of these two inverse relationships have been well documented (Burton, 1984). The negative correlations between seed oil and protein found within soybean breeding populations can vary. Though they can vary, the estimates are fairly consistent across populations that had a high protein line and a lower protein line as parents (Burton, 1984). Interestingly, studies that have also examined carbohydrates have shown that a negative correlation exists between percent protein and carbohydrates, specifically sucrose (Hartwig et al., 1997; Wilcox and Shibles, 2001), thus, increasing percent protein in the seed comes at the expense of percent oil and carbohydrates (Wilcox and Shibles, 2001).
Intuitively, the negative correlation between protein seed concentration and oil and carbohydrate seed concentrations is to be somewhat expected. On a dry weight basis, the
average soybean seed is 40% protein, 20% oil, 35% carbohydrate, and 5% ash (Lee et al., 2006). An increase in the percent protein would have to be followed by a decrease in one of the other constituents. Hanson et al. (1961) using a regression approach showed that varying units of energy are required to produce one unit of a particular constituent (0.786 units for protein,
1.1423 units for oil, and 0.400 units for residual seed constituent which is mainly carbohydrates). Estimates from breeding populations have shown that an increase of seed protein concentration of 1.5% is followed by a decrease of seed oil percentage of 1.0% and a decrease of seed residual percentage of 0.5% (Hansen et al. 1961; Leffel 1988). Based on the energy investment concept the loss of 1% oil and 0.5% residual fraction is not to be expected. Shimura and Hanson (1970) note that these results indicate a required energy commitment to the residual fraction, followed by the oil fraction, and lastly the protein fraction of the seed. Shimura and Hanson (1970) reasoned that either the required energy to produce these compounds was miscalculated or there exists a physiological barrier that couples the loss of oil and residual seed fraction when protein fraction is gained. The decreases of seed oil concentration and the seed residual fraction are thought to be at the root of the negative correlation between seed yield and seed protein concentration (Hanson 1991).
9
For a high protein line to have any success in the market place, it must have an
agronomic profile that is at least on par with the top yielding cultivars of the day. The negative correlation between seed yield and protein seed concentration increases the difficulty of that task. Even though a negative correlation between yield and protein seed concentration exists, breeding for high yielding, high protein lines is possible. Hanson (1991) speculated that producing high yielding soybean lines that have high seed protein concentration is theoretically possible based on seed energy input calculations; however the high protein genotype would require a minimum reduction in seed residual. Much of the traditional breeding work relating to increasing protein concentration has dealt with producing high yielding, high protein seed concentration soybean lines.
Breeding Strategies for Increasing Seed Protein Concentration
Traditional breeding strategies to improve protein concentration have been met with mixed results. In most cases, the strategies have been a success when it comes to increasing protein concentration, however they have often failed to keep seed yield at acceptable levels.
The basic breeding methodology for producing soybean lines follows the principles and procedures of inbred cultivar development. This method has not had a great deal of success in producing high yielding, high protein concentration soybean lines. The theory behind the method is to cross two soybean lines that may contrast for different traits that could complement each other in a superior selected inbred offspring. In this case, one parent would be an elite, high yielding cultivar with average protein whereas the other would be a lower yielding soybean line with above average seed protein concentration. Shannon et al. (1972) tested six F2-derived
populations for selection of high protein/high yielding lines. Crossing adapted high protein lines to each other produced the best lines in regard to high protein, protein/hectare, and the
combination of high protein and high yield, however, they did not produce the highest yielding lines among the set of crosses. Simpson and Wilcox (1983) evaluated progeny from two populations of crosses that consisted of a high protein, poorly adapted parent crossed to an average protein, adapted parent. These populations displayed large, highly variable genetic correlations between yield and protein seed concentration. They concluded that producing maturity group III and IV genotypes that combined high yield with high protein seed
10
eight different populations using three plant introductions and four adapted cultivars. Six of the populations were adapted by PI crosses while the other two were adapted by adapted crosses. Within these populations, using a selection intensity of 10% for increased protein concentration led to a negative yield response in seven of the eight populations. Increases in the selected lines for protein concentration were on the magnitude of 0% to 0.4%. Selecting on yield saw a negative response in seven of the eight populations for protein concentration. Wilcox and Shibles (2001) crossed two adapted, experimental lines with differing seed composition (high protein/low oil x low protein/high oil). An examination of the F4-derived line population showed
negative correlations between protein concentration and seed yield, oil concentration, and total carbohydrate.
Hartwig and Kilen (1991) evaluated a population that was created by crossing genotypes with differing seed composition. Unlike the Wilcox and Shibles (2001) study, the parents used for crossing in the Hartwig and Klein (1991) study had similar seed yield. Seed yield and protein had a weak negative correlation. On average, seed yield for the lines with high protein
concentration was 94% that of the low protein lines in the population. Hartwig and Klein (1991) showed that the high seed protein concentration trait can be transferred to progeny without a detrimental effect on yield when crossing genotypes with a dissimilar seed composition profile but a similar yield profile. For this to be applicable within a breeding program, lines need to exist that all ready combine high seed protein concentration with an elite seed yield.
Unfortunately, that is often not the case as has been highlighted. Other strategies within traditional cultivar development programs and outside of this framework have been tested for combining elite yield with high seed protein concentration.
Sebern and Lambert (1984) tested the effect of stratification for percent seed protein in early generations upon selection for yield, percent seed protein and oil in the F6 generation. A
moderate positive correlation was detected between the early and late generations for seed protein concentration. Negative correlations between percent seed protein and seed yield were present in both populations tested. They identified a number of lines that had acceptable combinations of seed yield, percent seed protein, and percent seed oil. Most of the identified lines originated from the intermediate protein stratum.
Openshaw and Hadley (1984) investigated the potential effectiveness of selection indices to modify protein seed concentration. Their report outlined the use of multiple indices that select
11
for protein concentration, oil concentration, and sugar concentration by weighting these three selection components in varying ways in an attempt to increase protein concentration while minimizing the decrease in seed oil and sugar concentration. Though the authors came to a couple of conclusions about the indices used, they are largely irrelevant to a soybean breeder. Evaluation of the indices used was done in the F4 generation based on selections made in the F3
generation. Selecting a subset within the F3 generation, selfing them to the F4 generation, and
subsequently evaluating them is not an adequate evaluation of the indices tested. Evaluating the effectiveness of indices to increase seed protein concentration, while controlling the
corresponding change in oil concentration, can be accomplished effectively across cycles of breeding and not through generations of selfing. Openshaw and Hadley (1984) do note that that one of the indices could be valuable for the selection of genotypes within a recurrent selection program.
Using intra-cultivar variation, Fasoula and Boerma (2005) were able to increase protein concentration in the cultivars Benning, Haskell, and Cook. Benning was a F4-derived line
whereas Haskell and Cook were both F5-derived lines. Single plants were selected within these
cultivars that had significantly higher seed protein concentration that the original cultivars. Significant protein concentration increases ranged from 4 g kg-1 to 10 g kg-1. Additionally, none of these selections had significantly lower yield than its original cultivar. Two high protein selections from the cultivar Haskell actually had significantly higher seed yields than the original cultivar.
Jamago (2007) tested the effectiveness of producing high yielding lines with concurrent high seed protein concentration by selecting for protein concentration in early generations and subsequently selecting for yield in the later generations. F2-derived families were selected based
on seed composition. F5-derived lines within families were then evaluated for yield. Selection
for protein in the F2 families was successful. Forty-one of the ninety F5-derived lines had protein
concentration that exceeded 480 g kg-1. Significant variation for seed yield was present within the high protein families to select for higher-yielding lines. Two lines were identified that did not significantly differ in yield from the high yield parent and did not significantly differ in protein concentration from the high protein parent.
Recurrent selection is a population development breeding scheme for improving a phenotypic trait through the accumulation of favorable alleles within the population. Recurrent
12
selection isn’t often used in soybean germplasm improvement or cultivar development. The method does not work well in terms of a practical sense when the crop in question is a self-pollinated plant that is not easily crossed and upon successful hybridization produces few seeds per cross. Brim and Burton (1979) increased protein concentration in four different populations after six cycles of recurrent selection. The gains ranged from 1.2% to 3.3% for the mean of the populations. Yield decreased significantly in two of the four populations, significantly increased in one of the populations, and did not change significantly in the last population. Percent seed oil decreased in each of the populations. Holbrook et al. (1989) built upon these findings by evaluating a recurrent selection cycle using a restricted index selection. The purpose of selection cycle was to increase yield while holding seed protein constant. After two cycles of selection, yield was increased while protein concentration was maintained at a high level. The index selection did not do as good of job at maintaining protein concentration as direct selection for protein would have, nor did it do as well selecting for yield as using total protein or yield per se as a selection criterion. Nonetheless, the authors concluded the index selection method is the superior methodology when maintaining a high protein content is a requirement (Holbrook et al., 1989). Twenty years after the Brim and Burton (1979) report, Wilcox (1998) reported on eight cycles of a recurrent selection program for increased protein concentration performed at Purdue University. Mean seed protein was increased 5.8 g/kg per cycle while seed oil was decreased 2.3 g/kg per cycle. Plants exceeding a protein seed concentration of 479 g/kg went from 0.1% of the plants in cycle 0 to 62.5% of the plants that made up cycle eight. Most of the alleles for protein concentration were thought to have been accumulated by cycle six. The inverse relationship between oil and protein seed concentration strengthened in the later cycles of selection. Yield data was not obtained due to the phenotypic evaluations having been performed on S0 plant evaluations as opposed to two or four row yield plots.
Backcrossing is a breeding procedure that is often performed when a simple, inherited trait of interest resides in an undesirable genetic background. The trait is bred out of this background by making repeated crosses to a genetic line that has a more preferable genetic background. The end goal is to completely recover the trait of interest in this better genetic background. Often, the undesirable genetic background alludes to poor agronomic traits for the intended growth environment. A number of studies have attempted to use backcrossing
13
yielding backgrounds to high yielding, adapted backgrounds with a lower protein seed concentration.
Wehrmann et al. (1987) reported backcrossing the high protein seed concentration trait from the plant introduction Pando into three adapted, high yielding lines that had low-to-moderate seed protein concentration. Two rounds of backcrossing were performed with selection for protein concentration performed each generation. A moderate percentage of lines (15%, 22%, 19%) were produced within each backcross population that had significantly higher protein concentration and yield that was not significantly different than the recurrent parent. It must be noted that of these lines, only two had a yield equal to or higher than its recurrent parent. Also, protein levels failed to recover full expression of the protein seed concentration trait from Pando (480 g/kg). Population means for the second backcross averaged 379 g/kg, 390 g/kg, and 437 g/kg. The results from this did indicate that protein concentration can be increased through the backcross method while also maintaining yields that weren’t significantly different from the recurrent parent.
Wilcox and Cavins (1995) also used Pando as the genetic source of high seed protein concentration in a backcrossing program. After three generations of backcrossing, a line was produced that significantly exceeded the recurrent parent in yield and protein seed concentration. Protein seed concentration for this line (472 g/kg), though significantly lower than Pando (498 g/kg) vastly exceeded that of the recurrent parent (408 g/kg). The yield level of the recurrent parent was recaptured in the selected BC2F4-derived line used for making the third backcross.
This study differed slightly from the Wehrmann et al. (1987) study. Similar to the Wehrmann et al. (1987) study, selections were made based on protein concentration between backcrosses, however selections in the Wilcox and Cavins study was performed on F4-derived lines as
opposed to the winnowing selection process performed in the F2 and F3 generations in the
Wehrmann et al. study. Selections were also not based solely on protein concentration in Wilcox and Cavins (1995). Seed protein concentration was considered first, followed by yield and agronomic similarity to the recurrent parent.
Cober and Voldeng (2000) evaluated the efficacy of single cross and rapid backcross breeding methods to produce high protein, high yielding lines. Parents used for this study were a high yielding, low seed protein cultivar and a lower yielding, high seed protein cultivar. Both methods produced lines with seed protein concentration that was significantly higher than the
14
high yield/low protein parent; however, neither method produced lines that exceeded the high parent in yield. The authors concluded that the single cross method is as effective as the backcross method when developing high protein/high yielding lines from adapted parental germplasm.
In summary, a number of different traditional breeding methods have shown the ability to produce soybean lines with an increased seed protein concentration. Unfortunately, due to the negative correlations between seed protein and seed yield, it has been difficult to develop cultivars with an increased seed protein concentration that are also competitive with current cultivars for yield. The most successful example of combining high yield and high seed protein concentration was reported by Wilcox and Cavins (1995). Using a backcrossing scheme, they were able to recover the majority of the high seed protein concentration phenotype found in the donor parent while significantly exceeding the yield value of the recurrent parent in a selected BC3F4 line. The punch line of this success story is the development took nearly twenty years.
By the time this line was ready for public release, the high yielding recurrent parent used for backcrossing was no longer high yielding. The use of molecular markers has the potential to accelerate this process.
The Use of Molecular Markers for Increasing Seed Protein Concentration
The use of molecular markers has become a valuable tool in breeding programs. Public and private soybean breeding programs have successfully implemented marker-assisted selection within conventional breeding programs. Within marker-assisted selection programs, markers are tools that allow breeders to predicatively ferry genomic regions associated with traits of interest through generations of breeding. When it comes to high protein soybeans this could potentially be accomplished through a genome wide marker-assisted selection program or a site specific marker-assisted selection program (Orf et al., 2004; Bernardo, 2008; Heffner et al., 2009; Jannink et al., 2010). Genome wide selection will become more important in the coming years due to the decreasing genotyping costs as compared to the costs of phenotyping, however
utilization of this technique is currently confined to private breeding programs largely because of the amount of resources required to run it. Since little information is available for genome wide selection (none directly relating to seed composition in soybean), the rest of this section will deal with site specific marker-assisted selection for increasing seed protein composition.
15
Site specific marker-assisted selection has been very successful within public and private soybean breeding programs. This type of selection requires previous knowledge of genomic regions associated with the trait of interest. Furthermore, the most successful traits used for marker-assisted selection are controlled by few genomic regions that contribute relatively large effects to the trait. Resistance to soybean aphid, soybean cyst nematode, and brown stem rot are just a few examples where marker-assisted selection has become popular (Cahill and Schmidt, 2004; Orf et al., 2004; Kim et al., 2010).
Most often, the marker-assisted selection is utilized in forward breeding applications. Plants will be selected via markers in early generations to eliminate genotypes not containing the trait of interest. Culling the plants in early generations allows the program to save money by not advancing unwanted material too far in to the breeding process. This selection also saves time and money in eliminating expensive phenotyping trials.
Marker-assisted selection for increased seed protein concentration has the potential to be very beneficial for breeders. The use of this technique would allow the quick and efficient introgression of high seed protein concentration into lines. Using greenhouse rooms or off-season nurseries, genomic regions linked to markers could be backcrossed up to three generations within a single year.
Marker-assisted selection would also help increase yields through eliminating the need to select for both traits within forward breeding populations. Genotypes that do not contain the necessary molecular markers would be eliminated in early generations, therefore all material examined in the plant row stage should contain high protein concentration. Not having to select for these segregating regions within the later generations allows the breeder to examine a greater number of yield genotypes. This process basically stacks the deck in favor of the breeder by raising the probability of locating the rare yield genotype because more material that already contains high seed protein concentration can be tested solely for yield.
The key to initiating this kind of selection program is the identification and
characterization of genomic regions associated with high seed protein concentration. Many QTL mapping studies have been performed to identify genomic regions associated with high seed protein concentration. These mapping studies have utilized a diverse number of high protein genotypes. From these studies, many QTL have been mapped to the soybean genome. QTL for high seed protein concentration can be found to span nineteen of the twenty chromosomes.
16
Some QTL have been identified in multiple sources. QTL have also been identified that are associated with other agronomic traits such as seed oil concentration, seed size, maturity, and yield. A detailed summary of QTL identified from mapping studies and subsequently reported in the literature can be found on the Soybase website at
http://www.soybase.org/search/index.php?qtl=Prot. After mapping QTL to genomic regions, confirmation of the QTL is required.
Confirmation is an important step in the QTL identification process. This step verifies the existence of a true QTL located in the identified genomic region within the genetic
background tested. False positives are often statistical anomalies detected because of few environments, small population sizes, or just random chance. The Soybean Genetics Committee outlined a set of rules governing the confirmation of mapped QTL. These rules can be found on the Soybase website at http://soybase.org/resources/QTL.php. In short, a previously identified QTL is confirmed by testing the same genomic region within a new population (separate set of meiotic events) and environment. Parentage of the new population needs to contain at the very least the genotype that the QTL originated from. Preferably the confirmation population would contain the same parentage as the mapping population. Of the QTL listed in Table 1, three have been confirmed.
High seed protein concentration QTL identified in mapping studies performed by Diers et al. (1992) and Lee et al. (1996) were tested in confirmation populations (Sebolt et al., 2000; Fasoula et al. 2004). Fasoula et al. (2004) confirmed two of four QTL identified by Lee et al. (1996) from the PI 97100 x Coker 237 mapping population. One QTL originated from each parent; however the large effect QTL came from the PI. Fasoula et al. (2004) failed to confirm any of the three QTL identified in the Young x PI 416937 population. Sebolt et al. (2000) confirmed one of two high protein QTL identified from the Diers et al. (1992) mapping population developed from the cross of A81-356022 x PI 468916.
Validating the effect of the QTL across different genetic backgrounds is another important step in characterizing the QTL’s potential usefulness within a marker-assisted selection program. A QTL that does not reliably produce the intended effect across various genetic backgrounds is not worth allocating resources because the efforts will only be successful a portion of the time. Reports validating high protein QTL within different genetic backgrounds are very limited in the literature. Identification of QTL from different high protein sources that
17
map to similar genomic regions could be viewed as a validation across genetic backgrounds. For this to be a true validation test, the QTL would need to be shown to be allelic to each other, and unfortunately, no reports of these kinds of test can be found in the literature.
Fine mapping confirmed QTL is another necessary component of a marker-assisted selection program. Narrowing the genetic interval that contains the QTL helps identify closer markers which will reduce the potential loss of the QTL within a breeding program due to a recombination between the trait and the marker. Locating markers closer to the QTL also eliminates the amount of genetic material that must be carried through generations of selection. This lowers the probability of inadvertently carrying along genes that have detrimental effects on other traits that are being selected for, such as seed yield.
Though many QTL have been identified through mapping studies, the dearth of follow up research located in the literature impedes the progress of marker-assisted selection for high seed protein concentration within breeding programs.
References
American Soybean Association. 2009. Soy Stats 2009. [Online]. Available:
http://www.soystats.com/2009/Default-frames.htm (verified December 10, 2009).
Baker, K.M. and H.M. Stein. 2009. Amino acid digestibility and concentration of digestible and metabolize energy in soybean meal produced from conventional, high protein, or
low-oligosaccharide varieties of soybeans and fed to growing pigs. Journal of Animal Science. 87:2282-2290.
Bellaloui, N. and A. Mengistu. 2008. Seed composition is influenced by irrigation regimes and cultivar differences in soybean. Irrigation Science. 26:261-268.
Bellaloui, N., J.R. Smith, J.D. Ray, and A.M. Gillen. 2009. Effect of maturity on seed composition in the early soybean production system as measured on near-isogenic soybean lines. Crop Science. 49:608-620.
Bernardo, R. 2008. Molecular markers and selection for complex traits in plants: Learning from the last 20 years. Crop Sci. 48:1649-1664.
Brim, C.A. and J.W. Burton. 1979. Recurrent selection in soybeans. II. selection for increased percent protein in seeds. Crop Sci. 19:494-498.
Brummer, E.C., G.L. Graef, J. Orf, J.R. Wilcox and R.C. Shoemaker. 1997. Mapping QTL for seed protein and oil content in eight soybean populations. Crop Sci. 37:370-378.
18
Burton, J.W. 1984. Breeding soybeans for improved protein quantity and quality. p. 361 – 367 In R. Shibles (ed.) Proc. of the World Soybean Res. Conf. III. Ames, IA. 12 – 17 Aug. 1984. Westview Press, Inc. Boulder, CO.
Cahill, D.J. and D.H. Schmidt. 2004. Use of marker assisted selection in a product development breeding program. In Fischer, T. (ed.) New directions for a diverse planet. Proceedings of the 4th International Crop Science Congress, Brisbane, Australia, 26 Sept – 1 Oct 2004. Available at
http://www.cropscience.org.au/icsc2004/symposia/3/4/133_schmidtdh.htm [verified March 26, 2010].
Carrera, C., M.J. Martinez, J. Dardanelli, and M. Balzarini. 2009. Water deficit effect on the relationship between temperature during the seed fill period and soybean seed oil and protein concentrations. Crop Science. 49: 990-998.
Chapman, A., V.R. Pantalone, A. Ustun, F.L. Allen, D. Landau-Ellis, R.N. Trigiano, and P.M. Gresshoff. 2003. Quantitative trait loci for agronomic and seed quality traits in an F2 and F4:6 soybean
population. Euphytica. 129:387-393.
Chung, J., H. L. Babka, G.L. Graef, P.E. Staswick, D.J. Lee, P.B. Cregan, R.C. Shoemaker, and J.E. Specht. 2003. The seed protein, oil, and yield QTL on soybean linkage group I. Crop Science. 43:1053-1067.
Cober, E. R., M.J. Morrison, Ma BaoLuo, and G. Butler. 2005. Genetic improvement rates of short-season soybean increase with plant population. Crop Science 45:1029-1034.
Cober, E. R. and H.D. Voldeng. 2000. Developing high-protein, high-yield soybean populations and lines. Crop Science. 40:39-42.
Csanadi, G., J. Vollman, G. Stift, and T. Lelley. 2001. Seed quality QTLs identified in a molecular map of early maturing soybean. Theoretical and Applied Genetics. 103: 912-919.
Cregen, P.B. and C.V. Quigley. 1997. Simple sequence repeat DNA marker analysis. p 173-185. In: Caetano-Anolles, G. and Gresshoff, P.M. (eds). DNA markers: Protocols, applications, and overviews, J. Wiley and Sons, New York.
Dardanelli, J. L., M. Balzarini, M.J. Martinez, M. Cuniberti, S. Resnik, S.F. Ramunda, R. Herrero, and H. Baigorri. 2006. Soybean maturity groups, environments, and their interaction define
mega-environments for seed composition in Argentina. Crop Science 46:1939-1947.
Diers, B.W., P. Keim, W. R. Fehr, and R. C. Shoemaker. 1992. RFLP analysis of soybean seed protein and oil content. Theor Appl Genet. 83:608-612.
Dornbos, D.L., Jr., and R.E. Mullen. 1992. Soybean seed protein and oil contents and fatty acid composition adjustments by drought and temperature. Ibid. 69: 228-231.
Fasoula, V.A. and H.R. Boerma. 2005. Divergent selection at ultra-low plant density for seed protein and oil content within soybean cultivars. Field Crops Res. 91:217-229.
19
Fasoula, V. A., D. K. Harris, and H.R. Boerma. 2004. Validation and designation of quantitative trait loci for seed protein, seed oil, and seed weight from two soybean populations. Crop Science. 44: 1218-1225.
Edwards III, H.M., M.W. Douglas, C.M. Parsons, and D.H. Baker. 2000. Protein and energy evaluation of soybean meals processed from genetically modified high-protein soybeans. Poultry Science. 79:525-527.
Gibson, L.R., and R.E. Mullen. 1996. Influence of day and night temperature on soybean seed yield. Crop Science 36: 98-104.
Hanson, W. D. 1991. Seed protein content and delivery of assimilates to soybean seed embryos. Crop Science. 31:1600-1604.
Hanson, W. D., R.C. Leffel, and R.W. Howell. 1961. Genetic analysis of energy production in the soybean. Crop Science 1:121-126.
Hartwig, E.E. and T.C. Kilen. 1991. Yield and composition of soybean seed from parents with different protein, similar yield. Crop Sci. 31:290-292.
Hartwig, E.E., T.M. Kuo and M.M. Kenty. 1997. Seed protein and its relationship to soluble sugars in soybean. Crop Sci. 37:770-773.
Heffner, E.L., M.E. Sorrells and J. Jannink. 2009. Genomic selection for crop improvement. Crop Sci. 49:1-12.
Helms, T. C. and J.H. Orf. 1998. Protein, oil, and yield of soybean lines selected for increased protein. Crop Science. 38:707-711.
Holbrook, C. C., J.W. Burton, and T.E. Carter Jr. 1989. Evaluation of recurrent restricted index selection for increasing yield while holding seed protein constant in soybean. Crop Science. 29:324-329. Hymowitz, T., J.W. Dudley, F. I. Collins, and C.M. Brown. 1974. Estimations of protein and oil
concentration in corn [maize], soybean, and oat seed by near-infrared light reflectance. Crop Science. 14:713-715.
Hyten, D.L., V.R. Pantalone, C.E. Sams, A.M. Saxton, D. Landau-Ellis, T.R. Stefaniak, and M.E. Schmidt. 2004. Seed quality QTL in a prominent soybean population. Theoretical and Applied Genetics. 109: 552-561.
Jamago, J.M. 2007. Breeding for high yield and high protein in soybean and the potential use of new flower color genes. Ph.D. Thesis. University of Illinois at Urbana-Champaign. United States.
Jannink, J., A.J. Lorenz and H. Iwata. 2010. Genomic selection in plant breeding: From theory to practice. Briefings in Functional Genomics 9:166-177.
Kane, M.V., C.C. Steele, L.J. Grabau, C.T. MacKown and D.F. Hildebrand. 1997. Early-maturing soybean cropping system: III. protein and oil contents and oil composition. Agron. J. 89:464-469.
20
Kim, K.S., S. Bellendir, K.A. Hudson, C.B. Hill, G.L. Hartman, D.L. Hyten, M.E. Hudson, and B.W. Diers. 2010. Fine mapping the soybean aphid resistance gene Rag1 in soybean. Theor Appl Genet 120: 1063-1071
Kravchenko, A. N and D.G. Bullock. 2002. Spatial variability of soybean quality data as a function of field topography: I. spatial data analysis. Crop Science. 42:804-815.
Kravchenko, A. N and D.G. Bullock. 2002. Spatial variability of soybean quality data as a function of field topography: II. A proposed technique for calculating the size of the area for differential soybean harvest. Crop Science. 42: 816-821.
Lee, S.H., M. A. Bailey, M. A. R. Mian, T. E. Carter Jr, E. R. Shipe, D. A. Ashley, W. A. Parrott, R. S. Hussey and H. R. Boerma. 1996. RFLP loci associated with soybean seed protein and oil content across populations and locations. Theor Appl Genet. 93: 649-657.
Lee, J.L., X. Wu, J.G. Shannon, D.A. Sleper, and H.T. Nguyen. 2006. Soybean. P. 1 – 54 In C. Kole (ed.) Genome mapping and molecular breeding in plants: Oilseeds. Springer, Heidelberg, pp 1–54. Leffel, R.C. 1988. High protein lines and chemical constituent pricing in soybeans. J Prod Agric.
1:111-115.
Lusas, E.W. 2004. Soybean processing and utilization. P. 949-1046. In Boerma, H.R. and Specht, J.E. (ed.) Soybeans: Improvement, production, and uses. 3rd ed. Agron. Monogr. 16. ASA, CSSA, and SSSA, Madison, WI.
Maestri, D.M., D.O. Labuckas, J.M. Meriles, A. Lamarque, J.A. Zygadlo, and C.A. Guzmán. 1998. Seed composition of soybean cultivars evaluated in different environmental regions. J. Sci. Food Agric. 77:494–498.
Maughan, P.J., M.A. Saghai Maroof, and G.R. Buss. 1996. Molecular-marker analysis of seed-weight: genomic locations, gene action and evidence for orthologous evolution among three legume species. Theoretical and Applied Genetics 93: 574-579.
Maughan, P.J., M.A. Saghai Maroof, and G.R. Buss. 2000. Identification of quantitative trait loci controlling sucrose content in soybean (Glycine max). Molecular Breeding 6: 105-111.
Martin, N.F., A.G. Bollero, and D.G. Bullock. 2007. Relationship between secondary variables and soybean oil and protein concentration. ASABE. 50:1271-1278.
McNiven, M.A., P.H. Robinson, and J.A. MacLeod. 1994. Evaluation of a new high protein variety of soybean as a source of protein and energy for dairy cows. Journal of Dairy Science. 77: 2605-2613. Naeve, S.L. and S.C. Huerd. 2008. Year, region, and temperature effects on the quality of Minnesota’s
soybean crop. Agronomy Journal. 100: 690-695.
Openshaw, S. J. and H.H. Hadley. 1984. Selection indexes to modify protein concentration of soybean seeds. Crop Science. 24:1-4.
21
Orf, J.H., B.W. Diers, and H.R. Boerma. 2004. Genetic Improvement: Conventional and Molecular-Based Strategies. p. 417-450. In Boerma, H.R., and Specht, J.E. (ed.) Soybeans: Improvement, production, and uses. 3rd ed. Agron. Monogr. 16. ASA, CSSA, and SSSA, Madison, WI.
Panthee, D. R., V.R. Pantalone, D.R. West, A.M. Saxton, and C.E. Sams. 2005. Quantitative trait loci for seed protein and oil concentration, and seed size in soybean. Crop Science. 45: 2015-2022.
Pfeiffer, T. W., L.J. Grabau, and J.H. Orf. 1995. Early maturity soybean production system: Genotype * environment interaction between regions of adaptation. Crop Science. 35:108-112.
Piper, E.L. and K.J. Boote. 1999. Temperature and cultivar effects on soybean seed oil and protein concentrations. JAOCS. 76:1233-1241.
Qiu, B.X., P.R. Arelli, and D.A. Sleper. 1999. RFLP markers associated with soybean cyst nematode resistance and seed composition in a ‘Peking’ x ‘Essex’ population. Theoretical and Applied Genetics. 98: 356-364.
Ren, C. K.D. Bilyeu, and P.R. Beuselinck. 2009. Composition, vigor, and proteome of mature soybean seeds developed under high temperature. Crop Science. 49: 1010-1022.
Robinson, A.P., S.P. Conley, J.J. Volenec and J.B. Santini. 2009. Analysis of high yielding, early-planted soybean in Indiana. Agron. J. 101:131-139.
Rotundo, J.L. and M.E. Westgate. 2009. Meta-analysis of environmental effects on soybean seed composition. Field Crops Research. 110: 147-156.
Sato, K. and T. Ikeda. 1979. The growth responses of soybean to photoperiod and temperature. IV. The effect of temperature during the ripening period on the yield and characters of seeds. Jpn J Crop Sci. 48: 283-290.
Scott, R.A. and K.D. Kephart. 1997. Selection for yield, protein, and oil in soybean crosses between adapted and introduced parents. Field Crops Res. 49:177-185.
Sebern, N. A. and J.W. Lambert. 1984. Effect of stratification for percent protein in two soybean populations. Crop Science. 24:225-228.
Sebolt, A. M., R.C. Shoemaker, and B.W. Diers. 2000. Analysis of a quantitative trait locus allele from wild soybean that increases seed protein concentration in soybean. Crop Science. 40:1438-1444. Shannon, J.G., J.R. Wilcox and A.H. Probst. 1972. Estimated gains from selection for protein and yield in
the F4 generation of six soybean populations. Crop Sci. 12:824-826.
Shimura, E. and W.D. Hanson. 1970. Covariance analysis involving energy production and distribution among seed fractions by soybean genotypes, Glycine max (L.) merrill. Crop Sci. 10:242-246.
Simpson, A. M.,Jr. and J.R. Wilcox. 1983. Genetic and phenotypic associations of agronomic characteristics in four high protein soybean populations. Crop Science. 23:1077-1081.
22
Smith, K. (2001) Advances in feeding soybean meal [Online]. Keith Smith & Assoc., Farmington, MA. Available at http://www.soymeal.org/ksmith1.html [verified March 23, 2010].
Specht, J.E., K. Chase, M. Macrander, G.L. Graef, J. Chung, J.P. Markwell, M. Germann, J.H. Orf and K.G. Lark. 2001. Soybean response to water: A QTL analysis of drought tolerance. Crop Sci. 41:493-509.
Sugimoto, T., R. Masuda, M. Kito, N. Shiraishi and Y. Oji. 2001. Nitrogen fixation and soil N level during maturation affect the contents of storage compounds of soybean seeds. Soil Sci. Plant Nutr. 47:273-279.
Tajuddin, T., S. Watanabe, N. Yamanaka, and K. Harada. 2003. Analysis of quantitative trait loci for protein and lipid contents in soybean seeds using recombinant inbred lines. Breeding Science. 53: 133-140.
Temperly, R.J. and R. Borges. 2006. Tillage and crop rotation impact on soybean grain yield and composition. Agron. J. 98:999-1004.
USDA, ARS, National Genetic Resources Program. Germplasm Resources Information Network - (GRIN). [Online Database] National Germplasm Resources Laboratory, Beltsville, Maryland. Available: http://www.ars-grin.gov/cgi-bin/npgs/html/obvalue.pl?51016 (August 26, 2009)
Vollmann, J., T. ElHadad, R. Gretzmacher and P. Ruckenbauer. 1996. Seed protein content of soybean as affected by spatial variation in field experiments. Plant Breeding 115:501-507.
Wehrmann, V. K., W.R. Fehr, S.R. Cianzio, and J.F. Cavins. 1987. Transfer of high seed protein to high-yielding soybean cultivars. Crop Science. 25:927-931.
Wilcox, J. R. 1998. Increasing seed protein in soybean with eight cycles of recurrent selection. Crop Science. 38:1536-1540.
Wilcox, J. R., and J.F. Cavins. 1995. Backcrossing high seed protein to a soybean cultivar. Crop Science. 35:1036-1041.
Wilcox, J. R. and R.M. Shibles. 2001. Interrelationships among seed quality attributes in soybean. Crop Science. 41:11-14.
Wilson, R.F. 2004. Seed Composition. p. 621-677. In Boerma, H.R., and Specht, J.E. (ed.) Soybeans: Improvement, production, and uses. 3rd ed. Agron. Monogr. 16. ASA, CSSA, and SSSA, Madison, WI.
Wolf, R.B., J.F. Cavins, R. Kleiman, and L.T. Black. 1982. Effect of temperature on soybean seed constituents: Oil, protein, moisture, fatty acids, amino acids, and sugars. J Am Oil Chem Soc. 59:230-232.
Workman, J. Jr. and J. Schenk. 2004. Understanding and using the near-infrared spectrum as an analytical method. p. 3 – 10. In Workman, J. Jr. and J.B. Reeves III (ed.) Near infrared spectroscopy in
23
CHAPTER 2: BREEDING WITH TWO QTL THAT CONDITION HIGH
PROTEIN CONCENTRATION AND THEIR EFFECT ON OTHER
AGRONOMIC TRAITS
Introduction
Many QTL controlling protein concentration have been mapped with molecular markers. Hyten et al. (2004) compiled a comprehensive list of QTL controlling protein concentration that had been mapped and posted in the soybase website. Since that publication, a few new seed protein concentration QTL have been identified and published (Chapman et al., 2003; Tajuddin et al., 2003; Panthee et al., 2005). However, few published studies have taken this QTL
information the next step in the breeding process.
Fasoula et al. (2004) stressed that confirmation work is essential for the practical use of this QTL information in a plant improvement program. Of the seed protein QTL that have been mapped, only a few have been confirmed in published reports (Fasoula et al., 2004; Sebolt et al., 2000). Fasoula et al. (2004) confirmed two of four and zero of three previously identified QTL from two populations. Sebolt et al. (2000) confirmed one of two previously identified QTL. The success-rate in these two studies highlights the importance of confirmation work.
The confirmed QTL located on chromosome 20 (linkage group I) is one of the most commonly identified protein QTL (Diers et al., 1992; Brummer et al., 1997; Chung et al., 2003; Tajuddin et al., 2003). Diers et al. (1992) initially identified the QTL in a population of F2
-derived lines from the cross of an Iowa State University experimental line and the Glycine soja
accession, PI 468916. The QTL allele from Glycine soja was positively associated with greater seed protein and lower seed oil concentration than the allele from the soybean parent. Other studies with this Glycine soja allele have shown it to also be associated with lower yield, smaller seeds, and earlier maturity (Sebolt et al., 2000; Nichols et al., 2006).
The stability of the allele across genetic backgrounds was shown to be fairly robust. The
G. soja QTL allele was significantly associated with higher protein concentration in two of three F3-derived line populations tested by Sebolt et al. (2000). The three populations all shared as a
parent a high protein, G. soja QTL donor line but differed in the second parent. The second parent of the third population was a high protein improved plant selection that was reasoned to
24
contain a QTL allele that was allelic and had the same effect on protein as the G. soja high protein allele (Sebolt et al. 2000).
A QTL associated with high protein concentration that resides on chromosome 2 (linkage group D1b) has not been studied nearly as extensively as the chromosome 20 QTL. Stephens and Nickell (1992) reported on the discovery and inheritance of a pink flowered soybean mutant and this mutant allele was given the designation wp. The wp allele was associated with larger seeds, elevated seed protein concentration, and lesser seed oil concentration (Stephens et al. 1993). Hegstad et al. (2000a) positioned the wp locus to linkage group D1b. Using revertant flower color lines, Hegstad et al. (2000b) confirmed that the wp allele was significantly
associated with greater seed protein concentration, lower seed oil concentration, later maturity, and taller plants. The association between pink flowers and reduced yield was additionally found in a second population. Zabala and Vodkin (2005) determined that the aberrant flower color caused by the pink flower mutation was produced due to the insertion of a transposable element in the flavanone 3-hydroxylase gene 1. To date, the wp locus has not been tested in a background other than the one it was first discovered.
Testing the effect of confirmed QTL in different genetic backgrounds and in combination with other confirmed QTL is the next step in characterizing the potential usefulness of confirmed QTL in a plant improvement program.
The objectives of this research are to: i) test the stability of the high protein phenotype associated with the wp locus when it has been moved into different genetic backgrounds; ii) test the effect of stacking these two QTL on protein concentration and other agronomic traits in four genetic backgrounds.
Materials and Methods Plant Material and Population Development
Four populations were developed through four backcrosses (BC4). Four central Illinois
adapted genotypes were used as recurrent parents. They included the two maturity group II cultivars Dwight (Nickell et al., 1998) and Loda (Nickell et al., 2001) and the two maturity group IV experimental lines LS93-0375 (Schmidt and Klein, 1993) and C1981 (Nowling, 2001). The donor parent for the chromosome 20 high protein QTL originated from a BC3F4 population
25
chosen based on molecular marker data and the presence of beneficial agronomic characteristics. The simple sequence repeat (SSR) markers Satt239 and Satt496 were used to verify the presence of homozygosity for the high protein allele from PI 468916 in the QTL region. The donor parent for the wp locus is a F4-derived line from the cross of LN89-5320 x LN89-5322 (Stephens et al.,
1993; Stephens and Nickell, 1992).
The two QTL alleles were simultaneously backcrossed into each of the four genetic backgrounds. Presence of the chromosome 20 QTL allele was verified in BCnF1 plants using
genotypic data obtained from marker analysis with Satt239 and Satt496. Selected BCnF1 plants
were crossed to the recurrent parents. Presence of wp allele was verified by performing progeny tests with the BCnF2 seed. This occurred after the next backcross (BCn+1) had taken place. The
BCn+1F1 seed to be genotyped with molecular markers was based on the progeny test from the
previous generation. BC4F1 plants heterozygous for both QTL within each background were
selfed to produce BC4F4 seed. BC4F4 plants homozygous in both QTL regions were selected and
selfed to form BC4F4-derived line populations. Molecular markers for chromosome 20 and
progeny tests for the wp locus were used to assess the genetic state of the respective QTL regions.
Progeny Tests for Flower Color
Screening seedlings for presence or absence of anthocyanin pigment in the hypocotyl was used to infer the flower color genotype of the parental plant. Fifteen seeds for each line were planted in sand-filled six inch pots. Plants were rated shortly after germination for hypocotyl color. Progenies segregating for hypocotyl color inferred the parent was heterozygous at the wp
locus , progenies fixed for either green hypocotyl color or purple hypocotyl color inferred with a probability of over 99.9% and 98.7% that the parent was fixed for pink or purple flower color.
Field Trials
All populations were evaluated for two years within the three year time period of 2006-2008. Locations used for growing tests included: the Crop Sciences Research and Education Center in Urbana, IL; the Northern Illinois Agronomy Research Center in Dekalb, IL; and Mead, NE. Each population was evaluated in a randomized complete block design with two