95
© Global Society of Scientific Research and Researchers http://asrjetsjournal.org/
Analysis and Detection of DDoS Attacks Using Machine
Learning Techniques
Saman Sarraf*
The Institute of Electrical and Electronics Engineers, Senior Member IEEE Email: [email protected]
Abstract
Over the past years, distributed denial-of-service (DDoS) attacks on Internet services and websites have dramatically increased. Several research teams designed defensive methodologies to handle the DDoS attacks. Using machine learning-based solutions have enabled researchers to detect DDoS attacks with complex and dynamic patterns. In this work, a subset of the CICIDS2017 dataset, including 200K samples and 84 features, was used to analyze the features and build models. A correlation analysis, as well as a tree-based feature importance exploration, were performed in the feature engineering step. Next, decision tree and support vector machine models were trained and tested to classify DDoS and Benign attacks. The results revealed that “Flow ID,” “SYN Flag Cnt,” and “Dst IP” had the most impact on attack detection. Also, the machine learning models classified the DDoS attacks, where the accuracy rates of close to 100% were achieved. The decision tree models showed slightly better performance than linear support vector machines. The results in this work highly matched the outcome of the original paper, which was to replicate.
Keywords: Attack Prediction; DDoS; Machine Learning.
1.Introduction
Cyber-security attacks are offensive acts that hackers use to target websites, computer networks, and devices. Among cyber-attacks, denial-of-service (DoS) or distributed denial-of-service (DDoS) attacks refer to actions that attempt to disrupt access to websites or networks [1].
--- * Corresponding author
96
Hackers often build a software application installed on a computer to plan DDoS attacks, and they call the computer/machine a botnet [2]. The botnets controlled by hackers are also considered to be malware or an infected network (machine) from which DDoS attacks are launched [3]. A DDoS attack usually occurs in three steps. First, the execution message is initiated by an attacker and sent to the program controlling the system, referred to as a “control master program.” When the control master program receives the execution command, a new message is generated and delivered to another software program called an “attack daemon”; this is the second step. Finally, once the attack message is received, the daemon begins to attack the targeted service or network, which is usually called the “victim” [4]. Researchers have shown that DDoS attacks have increased over the past years, and this type of attack will potentially become a top security issue and the main reason for business and website interruption. Also, high-tech governmental resources in various countries have mentioned that DDoS attacks are among the most popular methods that crackers have used to disrupt official websites [5]. DDoS attack detection has been of interest to researchers over time. Since the number of Internet of Things (IoT) services has increased, DDoS attacks have grown massively. Therefore, computer scientists and network practitioners have sought various approaches to detect DDoS attacks and attempt to predict a given attack [6]. Rule-based algorithms have been developed to detect such attacks but have not been successful due to the complicated nature of DDoS, where many variables play important roles [7]. Prasad and his colleagues develop a machine-learning algorithm using the CICIDS2017 dataset, where an XGBOOST algorithm was trained and produced an accuracy rate close 100%. They used the entire dataset, which included over 1.2 million samples where a binary classifier detected DDoS vs. Benign group [8].
2.Data and Methods
The original balanced CICIDS2017 dataset is often used for product-level machine learning development, which included over one million samples. In this work, a significant fraction of data was utilized for data analysis and machine learning model development. The samples associated with each class (DDoS vs. Benign) were separated and randomly shuffled. Next, 100K samples per class were selected so that a total number of 200K sampled formed the new dataset in this project; all the features from the original dataset were considered.
2.1.Data Preparation
The dataset contained both numerical and categorical features where 77 features were categorial, and the remaining features were numerical. The machine learning algorithms often require numerical data; therefore, the categorical data must be converted to numerical features.
2.2.One-Hot Encoding
Various approaches have been developed to convert categorical data to numeric values. One-Hot encoding having different implementation is a popular method used in data science projects to convert categorical data. In this approach, the number of unique values is counted per feature, and then, a unique index is assigned to each category. This approach, which is very simple and fast, is similar to indexing keys in a dictionary.
97
Timestamps are often considered as specific numeric data, which are essential in particular machine learning model development. In the dataset, after dropping all NaN values, the timestamps converted to absolute total-second values for feature engineering and ML section.
2.4.Data Normalization
This step refers to a process where each column representing a given feature is normalized to [-1, +1] or [0, +1] depending on machine learning models that are used. The concept of data normalization is to map data into an interval where cost functions of machine learning models work. Also, the data normalization, which is also called standardization, speeds up the training process and allows the models to be converged faster. To normalize data, different algorithms exist, such as normalization using minimum and maximum (Min-Max Scalar) of data or standard deviation and average of data. In this project, the Min-Max method (Equation 1) was applied to each feature column, which means the data were standardized for each feature separately.
(1)
2.5.Feature Engineering
This step refers to a process features in a dataset that were analyzed, and the importance of each feature and contribution to target variables are discovered using different methods. For instance, the canonical correlation scores between each feature and target variable among all samples demonstrate how a given feature is associated with the output. Another method is to decision tree feature importance capability. In this approach, a decision tree model is trained using the data where the importance of each feature is evaluated by a metric referred to as node impurity. Such a metric is weighted by the probability of a node in the tree [9].
2.6.Machine Learning Models
Prasad and his colleagues employed the XGBOOST model to predict DDoS attacks, which was a binary classification task to categorize DDoS and Benign samples [8]. In this work, two other machine learning techniques are used which are decision tree and support vector machine with a linear kernel, respectively. These two models have different behaviors so that a comparison between their results as well as Prasad’s XGBOOST allows them to understand better how much a machine learning-based defensive mechanism against DDoS might be accurate and reliable.
2.7.Decision Tree
One of the supervised machine learning algorithms that can be used for both classification and regression tasks is called a decision tree. In binary classification, this algorithm can be considered as a binary tree structure that splitting data into two subsets is performed based on specific criteria so-called decision rules. The tree is growing top-down, and each node an attribute which is classifying training local samples are selected. The process of splitting continues until the best classification occurs or all attributes are employed. Selecting attributes is the most challenging part of training a decision tree algorithm. Various methods exist to select the
98
best attribute when splitting data into smaller subset which are 1) information gain and 2) Gini index. The entropy changes when a new splitting occurs. Information gain is a measure which is affected by changes in entropy. On the other hand, the Gini metric is measuring how many times an attribute is incorrectly selected so a lower Gini score offers better performance [10].
2.8.Support Vector Machine – Linear Kernel
The essential idea behind the support vector machine is to map data from data space to another space using a function so-called kernel or kernel function. Separating data using any liner classifier is almost impossible in this scenario so that a given kernel maps the data into another space where a massive number of hyperplanes is created. The hyperplanes are linearly separable, but many classifiers can separate data. The optimization method in SVM is to find a hyperplane having the maximum distance from support vectors (classifiers). SVM is a sophisticated algorithm that became popular because of producing high-quality results to recognize handwriting. Several kernels exist in the SVM algorithm, including linear, polynomial, and radial basis function (RBF). SVM Linear is one of the base models often used in a binary classification task to demonstrate the quality of classification [11].
3.Results and Discussions
The data processing steps were completed, including data preparation/cleaning, One-Hot encoding, and normalization, as mentioned in the previous section. It is worth mentioning that tree-based algorithms such as decision tree work with non-normalized data as decision rules are not sensitive to the data range. However, the normalization was required for SVM Lin model development. The results of data processing steps are stored in a data-frame shown in Figure 1.
Figure 1: Sample of preprocessed data. The entire data-frame contains 200K rows and 84 features
3.1.Feature Engineering
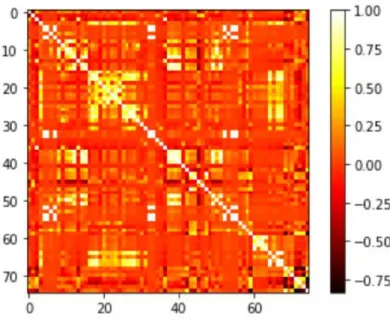
Calculating the correlation matrix across features defines the relationship between elements as well as their contribution to target variables. In simple words, a higher correlation score between a given feature and target variables suggest that the feature contributes more in the output so that it plays a more prominent role in model development. During correlation analysis, NaN scores were produced for nine features that were removed from the study. Figure 2 illustrates the correlation scores of 74 features and the target variable. As seen, the scores
99
with lighter colors offer higher scores, whereas darker areas indicate lower correlation scores. The list of features is found in Table 1 of the Appendix.
Figure 1: Correlation matrix of features against each other and target variable
In the next step, the correlation scores of the target variable (DDoS/Benign) vs. all features, which are the last column in the above figure, were extracted. Then, the correlation scores of the target variable were sorted in the descending order, and the first ten features having higher correlation scores were selected. The results which are shown in Figure 3 demonstrate that “Flow ID,” “SYN Flag Cnt,” and “Dst IP” are highly correlated with the target variable. The results from correction analysis revealed that Flow ID is the top feature. Prasad and his colleagues also mentioned that Flow ID is the prime feature in their investigation. Flow ID is number derived from Source and Destination IP according to the dataset description. The high correlation score between Flow ID and the target value suggests that an attack detection system can be designed using only Flow ID as the main feature.
100
Figure 2: The correlation scores of the top 10 features where Flow ID has a score of 77.45%, which shows this feature has the highest impact on the output.
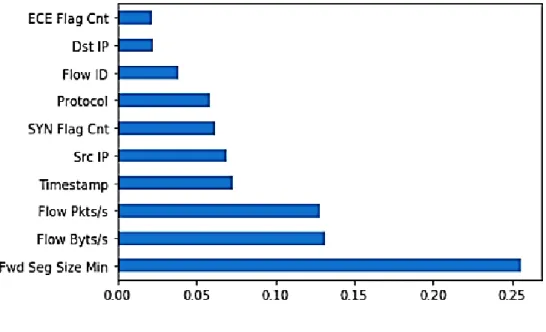
Discovering feature importance through a decision tree model was another method in feature engineering that was performed. As described briefly above, the contribution of features to training a decision tree model can be extracted using a bottom-up approach from the deepest layer to the top layer. Through this journey, the values of each decision rule (i.e., Gini index) are extracted, and their probability against the final class probability is calculated, demonstrating how much a given feature had an impact on the final results. The features shown in Figure 4 are in ascending order where “Fwd Seg Size Min,” “Flow Byte/s,” and “Flow Pkt/s” are the top 3 features. The results also revealed that “Flow ID” is also in the top 10 features, which agreed with the finding using the correlation method. A dimensionality reduction is sought through feature engineering In a complex problem where many features are provided. In such a situation, the intersection of results for the feature engineering methods used is extracted, and the set of features is introduced as the essential features having a high impact on a classification task. Using the same concept, discovering the intersection of correlation and feature importance methods showed that “Flow ID,” “SYN Flag Cnt,” and “Dst IP” are the most practical features to classify DDoS and Benign attack in the dataset.
Figure 3: Feature importance analysis using a decision tree trained model
3.2.Machine Learning
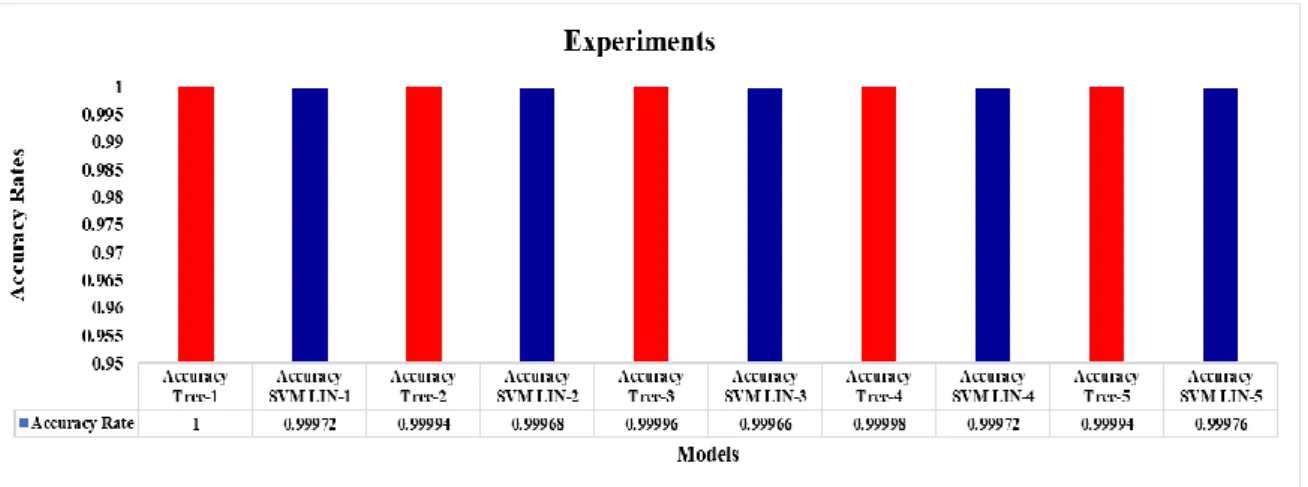
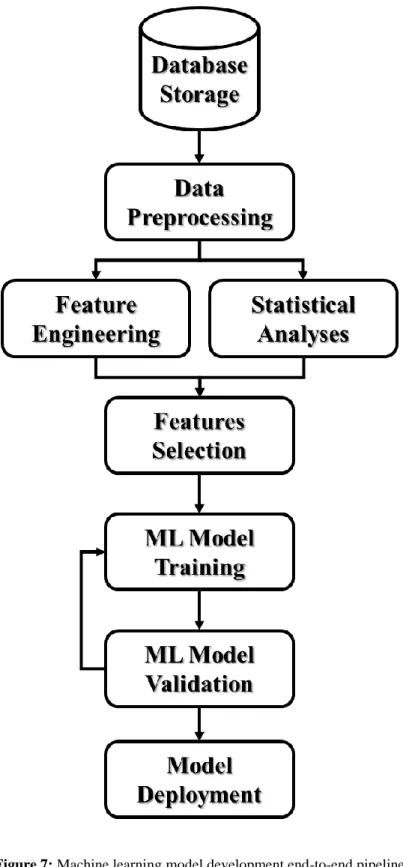
To demonstrate the robustness and reproducibility of the machine learning model development using all the features, randomly five training and testing datasets (75% vs. 25%) were generated and decision tree, and SVM Linear models were trained using identical datasets in each run. The results showed that the decision tree models were the best model as they performed slightly better than SVM Lin. The results of testing datasets shown in Figure 5 revealed that Prasad’s approach and its findings were replicated in this experiment. Figure 7 illustrates
101
the end-to-end machine learning pipeline (inspired by [12]) to predict DDoS attacks.
Figure 4: Training and testing datasets were randomly generated five times to train Decision Tree and SVM Lin models. The results on testing datasets show DS performs slightly better.
A classification report was generated based on the results from one of the above experiments to explore other evaluation metrics in this binary classification. The outcome of the analysis showed that the model performance of different parameters was very high similar to accuracy rates. Precision, recall, and F1-score were calculated, and macro and micro average were measured for each metric. The samples of each class for testing the model is shown in Support column Figure 6. Precision refers to positive predict value; recall represents the sensitivity of the model, and the F1 score is a similar metric to accuracy while considering both precision and recall. In the case of data imbalanced, F1 scores are more accurate, but in data balanced, both accuracy rate and F1 scores are similar.
Figure 5: Classification report for one of the experiments show the models performed well
4.Conclusion
DDoS attacks analysis and detection were performed using machine learning methods. In this work, a subset of the CICIDS2017 dataset was utilized, which included 200K samples of DDoS and Benign classes. The data contained 84 categorical and numerical features in total, where one feature was dropped, so that feature engineering and machine learning model development were completed with 83 features. A correlation analysis and feature importance exploration using a decision tree were employed in feature engineering. The results showed that “Flow ID,” “SYN Flag Cnt,” and “Dst IP” were the most practical features. Also, the results of
102
machine learning models, which included decision tree and linear support vector machine models, demonstrated that DDoS and Benign attacks were classified where the accuracy rates of around 100% were achieved. The replication of the original paper was completed, and other machine learning models can be considered for future work.
References
[1] Komar, M., et al. Deep Neural Network for Detection of Cyber Attacks. in 2018 IEEE First International Conference on System Analysis & Intelligent Computing (SAIC). 2018. IEEE.
[2] Sarraf, S., 5G Emerging Technology and Affected Industries: Quick Survey. American Scientific Research Journal for Engineering, Technology, and Sciences (ASRJETS), 2019. 55(1): p. 75-82.
[3] Stone-Gross, B., et al. Your botnet is my botnet: analysis of a botnet takeover. in Proceedings of the 16th ACM conference on Computer and communications security. 2009. ACM.
[4] Lau, F., et al. Distributed denial of service attacks. in Smc 2000 conference proceedings. 2000 ieee international conference on systems, man and cybernetics.'cybernetics evolving to systems, humans, organizations, and their complex interactions'(cat. no. 0. 2000. IEEE.
[5] Nazario, J., Politically motivated denial of service attacks. The Virtual Battlefield: Perspectives on Cyber Warfare, 2009(s 165).
[6] Weiss, J., DDoS Detection Using Deep Neural Networks on Packet Flows. 2019.
[7] Holl, P., Exploring DDoS defense mechanisms. Network, 2015. 25.
[8] M Devendra Prasad, P.B.V., C Amarnath, Machine Learning DDoS Detection Using Stochastic Gradient Boosting. International Journal of Computer Sciences and Engineering, 2019. 7(4): p. 157-16.
[9] Sugumaran, V., V. Muralidharan, and K. Ramachandran, Feature selection using decision tree and classification through proximal support vector machine for fault diagnostics of roller bearing. Mechanical systems and signal processing, 2007. 21(2): p. 930-942.
[10] Rokach, L. and O.Z. Maimon, Data mining with decision trees: theory and applications. Vol. 69. 2008: World scientific.
[11] Suykens, J.A. and J. Vandewalle, Least squares support vector machine classifiers. Neural processing letters, 1999. 9(3): p. 293-300.
[12] Sarraf, S., et al., MCADNNet: Recognizing Stages of Cognitive Impairment Through Efficient Convolutional fMRI and MRI Neural Network Topology Models. IEEE Access, 2019. 7: p. 155584-155600.
103
AppendixTable 1: Correlation scores of Nan values were removed, and 75 features remained