BUDGET AND LEGISLATIVE ANALYST
1390 Market Street, Suite 1150, San Francisco, CA 94102(415) 552-9292 FAX (415) 252-0461
Budget and Legislative Analyst
1
Policy Analysis Report To: Supervisor Farrell
From: Budget and Legislative Analyst’s Office Re: Analysis of Supportive Housing Programs Date: December 15, 2014
Summary of Requested Action
Your office requested that the Budget and Legislative Analyst conduct an analysis of supportive housing in San Francisco. In particular, you requested an examination of the cost and subsidy variations in supportive housing programs and buildings citywide, with a specific focus on the difference between master leased and non-profit owned units; and a review of DPH and HSA contracts with supportive housing providers to identify and compare procedures for client in-take, assessment, compliance, and outcomes.
Executive Summary
The San Francisco Plan to Abolish Chronic Homelessness (Ten Year Plan) developed the City’s “Housing First” policy, finding that “permanent supportive housing has been proven to be the most effective and efficient way to take chronically homeless off the streets”. Supportive housing combines housing with on-site support services, such as case management and mental health interventions.
The Human Services Agency (HSA) and the Department of Public Health (DPH) oversee the City’s major supportive housing programs, including:
Master Lease Program, in which HSA contracts with non-profit organizations to enter into master leases with private owners of Single Room Occupancy (SRO) hotels, and to provide property management and supportive services.
Local Operating Subsidy Program (LOSP), in which the Mayor’s Office of Housing (MOH), on behalf of DPH and HSA, enters into 15-year agreements with nonprofit affordable housing providers to subsidize operating costs at supportive housing sites.
Direct Access to Housing (DAH), in which DPH provides permanent supportive housing through master leases and non-profit providers, targeting homeless adults with special needs or disabilities. Direct Access to Housing includes sites funded by LOSP.
FY 2013-14 Budget for Supportive Housing
In FY 2013-14 the City supportive housing programs mentioned above accounted for $57,225,474 in spending on property management, leasing costs, and resident
Budget and Legislative Analyst
2
support services, consisting of 4620 housing units at 70 distinct housing sites, with 26 different vendors providing services. These City programs have three basic types, or models, of supportive housing:
o Master Lease SROs, in which the City contracts with nonprofit providers that lease and manage residential SRO hotels that are mostly privately owned;
o Non-Profit Supportive Housing, which consists of 100% supportive housing for the formerly homeless; and
o Other Affordable Housing, which include supportive housing set-asides within larger affordable housing developments.
Budget per Unit of Supportive Housing
DPH’s average annual expenditure per unit was $14,170 in FY 2013-14 compared to HSA’s average expenditure of $11,418, as shown in the table below, reflecting the diagnosed medical and behavioral health needs of the DPH population and associated higher housing and service costs.
FY 2013-14 Budget for Supportive Housing by Department
Department FY 2013-14 Budget Units Budget per Unit
Human Services $34,185,765 2994 $11,418
Public Health 23,039,709 1626 $14,170
Total $57,225,474 4620 $12,386
The average FY 2013-14 budget per non-profit owned supportive housing unit is $12,925, as shown in the table below, which is only 2 percent more than the average FY 2013-14 budget per Master Lease unit of $12,678.
FY 2013-14 Budget for Supportive Housing by Type of Housing
Type of Housing FY 2013-14 Budget Units Budget per Unit
Master Lease SRO $37,691,800 2973 $12,678
Non-profit SH 13,415,810 1038 $12,925
Affordable Housing 6,117,864 609 $10,046
Total $57,225,474 4620 $12,386
However, while annual budgeted expenditures for Master Lease units reflect all costs to the City for the supportive housing unit, annual budgeted expenditures for non-profit owned supportive housing units do not reflect financing costs to develop the units. The Budget and Legislative Analyst estimates average annual development costs of $11,0001, based on case studies of two non-profit owned
supportive housing developments. These estimated development costs increase the average annual cost for non-profit owned supportive housing unit from $12,925 to $23,925.
1 Financing costs include City financing such as affordable housing loans, other public financing such as low-income housing tax credits, and private financing.
Budget and Legislative Analyst
3
Expenditures by Type of Resident
Expenditures at sites for single adults accounted for 82 percent of all spending for supportive housing in FY 2013-14, compared to 11 percent for senior-only sites, 6 percent at mixed sites that include units for adults, families, and youth, and 2 percent at family-only sites.
Expenditures to Nonprofit Providers
Six nonprofit providers accounted for 73 percent of all DPH and HSA budgeted expenditures for supportive housing in FY 2013-14, and provided 81 percent of supportive housing units. DPH and HSA’s average per unit expenditure in FY 2013-14 for these six providers was $11,181 per unit, which is more than 10 percent less than program-wide average expenditures of $12,386. Factors that drive differences in costs among providers include different program models within each provider’s portfolio, variations in staffing levels, and differing resident service needs.
Both Master Lease and non-profit owned supportive housing are necessary components of the City’s supportive housing program because the existing need for supportive housing exceeds the availability
Although the City has created more than 3,000 supportive housing units since adoption of the Ten Year Plan in 2004, the number of homeless individuals has remained largely unchanged, increasing slightly from 6,248 in January 2005 to 6,436 in January 2013.
Master Lease housing, which makes up 64% of the City’s supportive housing portfolio, is both less expensive and more available than non-profit owned supportive housing. Although Master Lease supportive housing is considered less desirable because the buildings are often older with few amenities, they represent a considerable supply of lower-income housing that might not otherwise be available. In contrast, non-profit supportive housing and other affordable housing sites were developed more recently at significant cost, with substantial support from City, state, or federal sources.
Supportive housing is generally acknowledged as cost-effective, but escalating land and property costs in San Francisco will significantly increase supportive housing costs
Past analyses by the City and other sources have generally provided evidence for the cost-effectiveness of supportive housing. The City is also undertaking several evaluations and reorganizations of its supportive housing program. These include a November 2014 Controller’s Office analysis of HSA’s client outcomes and service utilization in supportive housing, and a DPH evaluation of health care services utilization rates.
While the cost effectiveness of supportive housing will likely continue, the actual costs of operating supportive housing in San Francisco will escalate. The rent per housing unit per month of $1,190 in the most recent Master Lease approved by
Budget and Legislative Analyst
4
the Board of Supervisors for 250 Kearny Street is more than 50 percent higher than the rent per housing unit per month of $791 in the next highest cost Master Lease between DPH and the landlord for Le Nain Hotel at 730 Eddy Street. The costs to develop non-profit owned supportive housing is also high, at $300,000 to $350,000 per unit, and is expected to increase.
The City’s existing performance measures and outcome metrics limit the City’s ability to evaluate the effectiveness of supportive housing programs
There are numerous practical limitations with currently available data and program procedures. In the case of HSA's Master Lease units, for example, key data on high-level categories of spending is simply unavailable.
Contract performance and outcome measures are not sufficiently detailed to track the actual outcomes of supportive housing residents and whether supportive housing programs are effective. For example, an outcome measure might track the percentage of residents who leave supportive housing and obtain other housing but not track the type of housing that they obtain, such as publicly-funded housing, housing with family or friends, or relocation to another city or state. Having a better understanding of these outcomes is important, as they all indicate differing levels of service needs and therefore have differing implications in terms of the emphasis of City policy.
In general, both HSA and DPH are heavily oriented towards internal contractual compliance rather than comprehensive contractual comparison, such as assessing which programs, buildings, and vendors are leading to outcomes desired by the City. Moving towards more comprehensive contract evaluation should be an explicit component of City policy.
The City Needs to Develop a New Ten Year Plan
The Ten Year Plan considers supportive housing to be permanent, and does not discuss whether residents can become more self-sufficient and transition out of intensive housing into other living environments that provide less or no support. The City does not currently assess whether residents of supportive housing can move from housing with a high level of support services into other types of housing. The City needs to consider whether intensive supportive housing should always be permanent housing or whether residents can transition from more intensive to less intensive housing.
The Board of Supervisors should consider convening a working group consisting of representatives from HSA, DPH, Mayor’s Office of Housing, other City agencies, and community organizations2, to update the City’s policies on supportive
housing.
2 In June 2014, Mayor Lee and Supervisor Farrell announced the creation of the San Francisco Inter-Agency Council on Homeless, consisting of City department heads and elected officials to coordinate the City’s response to homelessness, which could be the working group to develop the new Ten Year Plan.
Budget and Legislative Analyst
5
The City’s Supportive Housing Programs
The City offers several housing options and services in its supportive housing portfolio. For the purposes of this report we looked at the City’s largest permanent supportive housing programs:
Master Lease Program: The Human Services Agency (HSA) enters into master leases in which non-profit providers under contract with HSA lease Single Room Occupancy (SRO) hotels from private landlords. Master Lease SRO units are part of the City’s “Housing First” strategy, and include the Care Not Cash program, where homeless adults who qualify for the County Adult Assistance Program (CAAP) are offered housing and support services as part of their benefit package.
Local Operating Subsidy Program (LOSP): The Mayor’s Office of Housing (MOH) enters into 15-year agreements with nonprofit affordable housing providers on behalf of the Department of Public Health (DPH) and HSA, to subsidize operating costs at supportive housing sites. DPH and HSA request General Fund monies in their annual budgets for these subsidies, which are paid through the Mayor’s Office of Housing (MOH) and cover only the operating and maintenance costs of the supportive housing units. Direct funding is provided by HSA and DPH for supportive services.
Direct Access to Housing: Direct Access to Housing (DAH) is permanent supportive housing administered by DPH targeting homeless adults with special needs, including mental health, alcohol and substance abuse problems and/or complex medical conditions. The DAH program includes Master Lease SRO units, LOSP sites, and other non-profit supportive housing.
The Budget and Legislative Analyst focused on these programs because they cast the widest nets in terms of their eligible service populations, and because approximately 98% of their funding support comes from the City. Our primary analysis (“DPH and HSA Expenditures for Supportive Housing”, see below) did not review programs that provide services to more specific populations, such as the federally-funded Shelter Plus Care program, which is limited to persons with disabilities, or Housing Opportunities for People with AIDS (HOPWA), which is limited to persons living with disabling HIV.
In FY 2013-14 these programs accounted for $57,225,474 in spending, supporting 4620 housing units, as specified in Table 1 below. Please note that DPH’s LOSP sites and services fall under the umbrella of the Direct Access to Housing program and budget.
Budget and Legislative Analyst
6
Table 1: FY 2013-14 Expenditures and Units by Supportive Housing Program
Program Budget Total Units
DPH
Direct Access to Housing1 $23,039,709 1626
HSA $34,185,765 2994
Master Lease Program LOSP & LOSP Services
27,022,537 $7,163,228
2523 471
Total $57,225,474 4620
1 The DAH budget includes LOSP funds. Excludes Broderick Street Residential Care facility.
Source: Budget and Legislative Analyst, based on data provided by HSA and DPH
These programs incorporate 70 distinct permanent supportive housing sites between HSA and DPH. Of the 70 sites, 37 are HSA, and 33 are DPH3. There are
26 different vendors across the 70 sites providing property management or supportive services to the City’s homeless.
The City may fund three different categories of spending at a supportive housing site:
Property Management: includes utilities, security, and other building management costs, such as tenant rental agreements, communications, rent collection and record keeping, janitorial work, maintenance, compliance, trash pickup, and front desk staffing;
Leasing: City funds paid to building owners by housing providers or directly by the department for use of housing units; and
Support services: may include but not limited to: outreach, intake and assessment, case management, benefits advocacy and assistance, and behavioral health interventions. These support services are voluntary. DPH also provides money management and third party rent payment services for residents.
Below is a map of HSA and DPH sites in the Master Lease Program, Local Operating Subsidy Program, and Direct Access to Housing. As can be seen, sites are heavily clustered in supervisorial District 6.
Budget and Legislative Analyst
7
Chart 1: Location of Master Lease, Local Operating Subsidy Program, and Direct Access to Housing Sites
Source: Budget and Legislative Analyst, based on data provided by HSA and DPH
The programs that form the basis of this analysis fund three types, or models, of supportive housing:
Master Lease SROs, in which the City provides permanent housing with supportive services to homeless adults by contracting with nonprofit providers that lease and manage residential SRO hotels that are mostly privately owned;
Non-profit Supportive Housing, which are owned and operated by nonprofit providers, providing 100% supportive housing for formerly homeless residents; and
Other Affordable Housing, which include supportive housing set-asides within larger affordable housing developments.
Chart 2 below details the number of supportive housing sites funded by each program, broken out by the type of housing. As can be seen, DPH’s Direct Access to Housing program has a more diverse housing portfolio and funds all three types
Budget and Legislative Analyst
8
of housing. The Local Operating Subsidy Program exclusively funds non-profit and other affordable housing.
Chart 2: Number of Housing Sites by Type that Receive Funding from City Supportive Housing Programs
Ho us in g Type Master Lease SRO Non-Profit Supportive Housing Other Affordable Housing Housing Program Master Lease
Program (HSA) buildings 28
LOSP & LOSP Services1
(HSA +DPH) 12 buildings 10 buildings
Direct Access to
Housing (DPH) 6 buildings 2 buildings 12 buildings
1 Includes DPH’s Direct Access to Housing LOSP sites. Of the 12 non-profit supportive housing sites, 7 are HSA buildings and 5 are DPH; of the 10 other affordable housing sites, 2 are HSA and 8 are DPH.
History of the City’s Supportive Housing Buildings
San Francisco’s SROs were built primarily in the early 20th century to provide
temporary accommodations to the City’s transient workforce. Although a limited number of SROs have seen major recent renovations, and the SROs in DPH’s portfolio offer a high level of services, the majority of these buildings have not been significantly improved over the years and their overall quality is generally regarded as low. They do, however, represent a considerable supply of lower-income housing that might not otherwise be available.
In contrast, many of the non-profit supportive housing and other affordable housing sites were developed more recently as part of various initiatives associated with the City’s Ten Year Plan to Abolish Chronic Homelessness, established in 2004. Generally speaking these sites were developed at significant cost to complex, multi-firm development teams, with substantial support from City, State, or Federal sources. The quality of these facilities and their associated services are generally regarded as high, although their supply is more limited.
Current Evaluations and Initiatives in the City’s Supportive Housing
Programs
HSA is currently evaluating and restructuring its supportive housing programs, including a Controller’s Office evaluation of existing programs and a new Notice of Funding Availability (NOFA) for supportive housing providers. DPH is also
Budget and Legislative Analyst
9
undertaking an evaluation of the impact of supportive housing on health care utilization at one DAH site.
Controller’s Office Analysis
For a variety of reasons including how reporting requirements are structured in contracts, incompatible databases, and measurement limitations, HSA has limited information on client service utilization (how often clients seek and receive voluntary supportive services), client trajectories in supportive housing (whether and how client needs change over time), and tenant outcomes (how many exit supportive housing to other stable housing versus returning to homelessness). The Controller’s Office undertook a year-long study of HSA’s supportive housing program, evaluating service utilization, client trajectories, and tenant outcomes; the report was released in November 20144. The purpose of this study was to
“ensure clients have access to the appropriate amount and types of services, and to better understand whether the permanent supportive housing model is effective at helping clients address the barriers and needs that led to previous episodes of homelessness.”
HSA’s Move to a New Tiered Contract System
HSA recently issued a NOFA to all its supportive housing providers announcing a new “tiered” structure for supportive housing sites. HSA's purpose is to organize supportive housing sites based on the characteristics of the units and service needs of the residents (the higher the tier, the greater the service needs). These tiers will have specific funding, service and outcome targets5, and eligibility and
referral processes. The new system will contain the following five tiers:
Tier 1: Step-Up Master Lease and Non-Placement Units provide housing units to adults referred from other HSA-funded buildings. HSA will provide funding for leasing, housing operations/property management and supportive services. Eligible tenants must be existing HSA tenants with a successful housing history in other master lease buildings. The Tier 1 sites offer minimal supportive services and have fewer site staff.
Tier 2: Master Lease – Moderate Support Services provides housing units to adults. HSA manages the referral and placement process with the provider to fill vacancies, and provides funding for leasing, housing operations/property management, and supportive services. The supportive service staff ratio is approximately 1:50.
Tier 3: Master Lease – Stronger Support Services provides housing to adults. HSA manages the referral and placement process with the provider to fill vacancies, and provides funding for leasing, housing
4 http://sfcontroller.org/Modules/ShowDocument.aspx?documentid=6014
5 These targets have not yet been determined; they will be established once sufficient baseline data has been gathered.
Budget and Legislative Analyst
10
operations/property management, and supportive services. The supportive service staff ratio is approximately 1:35.
Tier 4: Local Operating Subsidy Program and U.S. Housing and Urban (HUD) Supportive Housing – Moderate Need Adult and / or Families serves families and single adults. Eligibility criteria do not require that all referrals be chronically homeless or have a disability, and not all units at the site fit the criteria of this tier. HSA manages the referral and placement process with the provider to fill vacancies, and provides funding for leasing, housing operations/property management, and supportive services.
Tier 5: Local Operating Subsidy Program, and HUD Supportive Housing and Shelter Plus Care Programs – High Need Adult and / or Families serves families and single adults. Eligibility criteria require that all referrals be chronically homeless or have a disability, and all units at the site must fit the criteria of this tier. HSA manages the referral and placement process with the provider to fill vacancies, and provides funding for leasing, housing operations/property management, and supportive services. Supportive services staff have a higher level of education and experience versus other tiers.
Providers will have three years to transition to the new requirements. The new contracts will run from July 1, 2014 to June 30, 2018.
Limited Move to Coordinated Assessment
All federally-funded permanent supportive housing units administered by DPH and HSA are participating in a two-year pilot program for coordinated assessment. The purpose is to target individuals with the longest histories of homelessness by leveraging several data sources that are not currently shared. Goals of the coordinated assessment pilot program include:
Reducing the length of homelessness;
Improving assessment so clients receive the best possible placement; Using existing data instead of redundant or intrusive interviews;
Ensuring equitable treatment among clients, instead of favoring case management connections;
Providing client choice; and
Improving data about level of need, length of homelessness, and housing preferences.
DPH and HSA plan to implement coordinated assessment system-wide for all federally supported populations by 2017. Both agencies are evaluating the feasibility of moving to coordinated assessment for all homeless populations, not just federally-supported ones.
Budget and Legislative Analyst
11
Improved Contract Monitoring
Although performance data at the individual contract level is reviewed regularly by contract monitors, HSA does not currently have any way to easily summarize and compare performance by supportive housing vendors across contracts. HSA is currently in the process of building a new contract monitoring database that will allow easier comparison of contract performance measures. This functionality is expected to be available sometime in FY 2014-15.
The Budget and Legislative Analyst will summarize and evaluate the efficacy of existing contract performance measures in the below section, “In-Take, Assessment, Compliance, and Outcomes”.
DPH Evaluation of Health Care Services Utilization Rates
DPH, in partnership with the Tenderloin Neighborhood Development Corporation, is participating in an evaluation supported by the Corporation for Supportive Housing and the Corporation for National and Community Services. A two-year evaluation has started at Kelly Cullen Community, one of four sites nation-wide to receive the grant. According to Margot Antonetty, Interim Director of Housing and Urban Health, the evaluation is investigating tenant utilization of health care services both before and after housing, and in comparison to a control group. The data will be assessed across the four sites to determine how permanent supportive housing impacts health care services utilization rates.
Past Analyses of the Cost-Effectiveness of Supportive Housing
In 2011 the Controller’s Office performed a literature review on the costs and benefits of supportive housing. The review found wide support for the benefits of supportive housing, including:
• Significant public cost savings by reducing chronically homeless participants’ incarceration rates and use of emergency services
• Net public costs savings when comparing the cost of supportive housing programs with the public cost savings they generate, although these savings are generally not transferable between public service systems More recent investigations, such as an April 2014 report produced by the Canadian government, found that for every $1 spent on housing for mentally ill homeless adults, there is a $2.50 reduction in other government spending. The project was the largest trial of permanent supportive housing ever performed. There have also been several San Francisco-specific studies led by Dr. Joshua Bamberger, which showed roughly similar results. Dr. Bamberger was the Medical Director at SF DPH, Housing and Urban Health, at the time and is now the Medical Consultant for the DAH program.
Budget and Legislative Analyst
12
Methodology
To take a closer look at average costs and enable general comparisons between Master Lease and non-profit owned supportive housing, the Budget and Legislative Analyst developed a matrix of supportive housing sites administered by HSA and DPH, classifying sites according to the following criteria: housing type (master lease, non-profit owned, other affordable), operating and funding agency, funding program, target population, target subpopulation, number of units, number of tenants, building owner, vendor(s), overall budget, cost details (property management, leasing, and support), and building location.
There are, however, several factors that must be considered when assessing the findings presented in this report on expenditure variations (“DPH and HSA Expenditures for Supportive Housing”).
Limitations in Identifying HSA Master Lease Budget Allocations
There were limitations in determining some cost details, specifically for buildings within HSA's Master Lease program. The master lease contracts do not distinguish between cost categories such as operating and leasing versus supportive services expenditures, therefore looking at the contract budgets alone did not allow us to determine exactly how current year budgets are allocated. The last time HSA determined these costs details was in FY 2011-12 through a special information request to contractors by the Single Adult Supportive Housing (SASH) working group.
In order to provide general comparisons of itemized spending on operating, leasing, and supportive services costs, the Budget and Legislative Analyst used previously determined FY 2011-12 cost breakdowns for the 28 sites in HSA's Master Lease portfolio. Any use of SASH data in this report has been noted as appropriate. All other figures are based upon FY 2013-14 data.
Accounting for Development Costs: Non-Profit Supportive and Other
Affordable Housing
As previously noted, many non-profit supportive and other affordable housing sites were recently developed or renovated, often at significant cost. Although development costs incurred by the City are tracked through the Mayor’s Office of Housing and Community Development, these expenses are not captured when assessing annual spending by the City’s supportive housing programs.
Although it is possible to develop an accurate picture of how ongoing spending is allocated and thereby compare between programs, this will not provide insight into the role played by past and future investment in creating the housing itself. The Budget and Legislative Analyst therefore performed a case-study analysis of two non-profit affordable housing sites, to illustrate how development expenses may be considered when assessing cost-effectiveness of different supportive housing models. See the section below (“Case Study Analysis”) for further details.
Budget and Legislative Analyst
13
Rental Revenues and Subsidy Variations
All residents of the City’s permanent supportive housing programs must pay rent for their units. The required rent payment varies by program, as described in Chart 3 below. Rental payments are collected by the housing provider and are generally directed to help cover property operating costs. In addition, at Other Affordable Housing sites there are non-homeless residents whose rental payments also contribute to site operating costs. These revenues are not, however, directly reflected in the program and site budgets analyzed by the Budget and Legislative Analyst’s Office. Because revenues and expenses vary by building, our analysis of average annual expenditures reflects only budgeted City expenditures, and not total actual spending per housing site.
Chart 3: Required Rent Payments and Subsidy Variations
The Section below (“Case Study Analysis”) briefly addresses how rental revenues can be incorporated into an analysis of site costs.
Other Financial Support
As noted earlier, this analysis is focused on DPH and HSA budgeted expenditures within the City’s most comprehensive supportive housing programs. There are, however, other sources of funding that may be supporting particular buildings. The most significant source of non-City funds to support the homeless are federal monies through Housing and Urban Development’s (HUD) McKinney-Vento programs, which provide for a range of homeless services, including operating subsidies and supportive services.
Master Lease Program (HSA)
Rent is subsidized by contracts with hotel owners; Care Not Cash clients receive an additional subsidy. Most residents pay a $503 flat rate for their unit while Care Not Cash clients will pay either $278 or $318 per month depending on their precise benefit package. A small number of SRO buildings have their own specific requirements, generally 30% of income or a sliding scale.
Local Operating Subsidy Program (HSA)
Residents of HSA’s LOSP sites pay 30% of their monthly income in rent. LOSP projects develop annual operating budgets that describe the project’s income and shortfall for nine years. HSA provides the Mayor’s Office of Housing with funding to cover the shortfall via operating subsidies, which keeps units affordable to very low-income residents.
Direct Access to Housing (DPH)
DAH residents must pay 30% to 50% of their monthly income in rent, including DAH LOSP sites. According to DPH, the average rent received from residents is approximately $350 a month. DAH covers the balance to provide housing and support services for the resident.
Budget and Legislative Analyst
14
In the case of DPH, a limited amount of HUD funds are included in DAH operating budgets.
In the case of HSA, however, federal funds and their associated housing units and services are administered separately from the SRO Master Lease Program and the Local Operating Subsidy Program. Some of these federally funded units and services are co-located at HSA and DPH-funded housing sites.
For example, of the seventy total supportive housing sites analyzed in this report, seven, or 10%, also receive federal funding through HUD McKinney’s Shelter Plus Care program, which is administered by HSA and provides operating subsidies for homeless persons with disabilities. These sites, and the impact of including federal funding in average expenditure calculations, are noted below in the Section, “DPH and HSA Expenditures for Supportive Housing”. Additionally, the Section below (“Case Study Analysis”) assesses the impact of including federal funding in calculating total costs at one supportive housing site.
In addition to Federal funds not included in DPH or HSA budgets, affordable housing sites in particular may receive additional funding to support overall (as opposed to homeless-specific) building expenses, such as Section 8 vouchers. Other sites and providers may receive additional grants from other federal, state, or non-profit sources in order to provide enhanced services to their residents.
DPH and HSA Expenditures for Supportive Housing
In FY 2013-14, DPH and HSA's primary supportive housing programs funded 4620 units, totaling $57.2 million in budgeted expenditures for annual operations, leasing, and supportive services.
DPH and HSA contracts for Master Lease SROs made up 64 percent of total supportive housing units, or 2973, and 66 percent of budgeted expenditures in FY 2013-14, or about $37.7 million, as shown in Table 2 below. Non-Master Lease units (Non-Profit and Other Affordable) totaled 1176, or 36 percent of total housing units, and 35 percent of budgeted expenditures, or about $19.5 million.
Budget and Legislative Analyst
15
Table 2: FY 2013-14 Expenditures and Units by Type of Supportive Housing
Human Services Public Health Total
Type of Housing Expenditure Percent Expenditure Percent Expenditure Percent
Master Lease SRO $27,022,537 79% $10,669,263 46% $37,691,800 66%
Non-Profit Owned 5,975,038 18% 7,440,772 32% 13,415,810 24%
Other Affordable 1,188,190 4% 4,929,674 21% 6,117,864 11%
Total $34,185,765 100% $23,039,709 100% $57,225,474 100%
Units Percent Units Percent Units Percent
Master Lease SRO 2523 84% 450 28% 2973 64%
Non-Profit Owned 407 14% 631 39% 1038 23%
Other Affordable 64 2% 545 34% 609 13%
Total 2994 100% 1626 100% 4620 100%
Source: Budget and Legislative Analyst, based on data provided by HSA and DPH
As shown in Chart 4 below, DPH’s $23 million budget comprises 40 percent of overall supportive housing expenditures, compared to 60 percent for HSA's $34.2 million budget. DPH’s share of overall supportive housing units is 35 percent at 1626 units, compared to HSA's share of 65 percent at 2994 units.
Chart 4: HSA and DPH Share of Expenditures
Source: Budget and Legislative Analyst, based on data provided by HSA and DPH
DPH and HSA’s average annual budgeted expenditure per supportive housing unit for all housing types was $12,386 in FY 2013-14, as shown in Chart 5 below, or $1,032 per month. DPH’s average annual expenditure per unit was $14,170 in FY 2013-14 compared to HSA’s average expenditure of $11,418, reflecting the diagnosed medical and behavioral health needs of the DPH population and associated higher housing and service costs.
0% 10% 20% 30% 40% 50% 60% 70% DPH HSA Expenditures Units
Budget and Legislative Analyst
16
Chart 5: Average Annual Expenditure per Supportive Housing Unit
Source: Budget and Legislative Analyst, based on data provided by HSA and DPH
Variations in Supportive Housing Expenditures
DPH and HSA’s average FY 2013-14 budget per supportive housing unit varied by department and type of housing, as shown in Chart 6 below. The average FY 2013-14 budget for:
• All Master Lease housing was $12,678 per unit: DPH’s average FY 2013-14 budget was $23,709 per unit, and HSA’s average FY 2013-14 budget was $10,710 per unit.
• All non-profit owned supportive housing was $12,925 per unit: DPH’s average FY 2013-14 budget was $11,792 per unit, and HSA’s average FY 2013-14 budget was $14,681 per unit. 6
• All other affordable housing that incorporated supportive housing units within the affordable housing development was $10,046: DPH’s average FY 2013-14 budget was $9,045 per unit7, and HSA’s average FY 2013-14
budget was $18,565.
6 As previously noted, our analysis excluded federally-funded supportive housing programs. Of the seven HSA-funded Non Profit Owned sites, four (Arendt House, Arnett Watson, Bayview Hill, Bishop Swing) received federal Shelter Plus Care funding for a limited number disabled residents. If these operating funds had been included, overall average expenditure per unit would have increased to $16,513. Including these funds would not have impacted the relative ranking of HSA’s Non-Profit Owned sites as compared to other housing types.
7 As previously noted, our analysis excluded federally-funded supportive housing programs. However, of the 20 DPH-funded Other Affordable sites, three (Folsom/Dore, Mary Helen Rogers, and Parkview Terraces) received Shelter Plus Care funding for a limited number of disabled residents. If these operating funds had been included, overall average expenditure per unit would have increased to $10,403. Including these funds would not have impacted the relative ranking of DPH’s Other Affordable sites as compared to other housing types.
$2,000 $4,000 $6,000 $8,000 $10,000 $12,000 $14,000 $16,000 HSA DPH Overall
Budget and Legislative Analyst
17
Chart 6: FY 2013-14 Average DPH and HSA Budget per Housing Unit
Source: Budget and Legislative Analyst, based on data provided by HSA and DPH
There is additional variation in the composition of expenditures, that is, in how monies are allocated amongst the three main categories of spending supported by City funds (leasing, property management, and supportive services).
For example, DPH’s average expenditures for leasing and operations at Master Lease units total $17,477 per year compared to $11,284 per year in HSA’s Master Lease units8. According to Ms. Antonetty, the FY 2013-14 budgeted leasing and
operating expenditures for DPH Master Lease buildings are high compared to other types of supportive housing due to the amount of maintenance and upgrades required at these older buildings. Additionally, DPH has absorbed rent losses and other costs as building owners and property managers have replaced elevators at four of the six DAH Master Lease sites; the property managers also update units as they turnover to address “bed-bug vulnerable” features.
In addition, DPH’s average expenditures per eligible tenant for supportive services are much higher at the Master Lease units at $6,232 per year, compared to $1,8599 for HSA Master Lease units. As noted earlier, this reflects the diagnosed
medical and behavioral health needs of the DPH population, which requires that DPH licensed social workers, registered nurses, and case managers staff the six DAH Master Lease sites. In contrast, HSA’s Master Lease units provide the lowest level of supportive services and the fewest amenities of any supportive housing type.
By contrast, for non-Master Lease units (Non-Profit Owned and Other Affordable) DPH has lower average annual expenditures: $6,739 per unit for property
8 This figure is based on HSA’s 2011-12 SASH analysis. 9 This figure is based on HSA’s 2011-12 SASH analysis.
$0 $5,000 $10,000 $15,000 $20,000 $25,000
Master Lease Non-profit Owned Other Affordable
HSA DPH Overall
Budget and Legislative Analyst
18
management and $4,855 per eligible tenant for supportive services. The low average annual expenditures for property management at DPH’s Other Affordable sites is partly due to the fact that there are other, non-homeless residents in the buildings whose rental payments are also contributing to on-site property management.
At HSA's non-Master Lease units the figure is $8,975 per unit per year for property management and $3,812 per eligible tenant for supportive services. The higher spending on property management at HSA’s Non-Master Lease sites is partly due to the fact that many of these buildings are targeted to Families and Seniors, who have higher costs on average compared to Adults (see below for further details, “Resident Profile and Access to Supportive Services).
As noted earlier, there are also several other factors to be considered when assessing the average budgeted expenditures for non-Master Lease units, which will be discussed below in the Section, “Case Study Analysis”.
Table 3 below contains additional detail on how overall funding is allocated between different expenditure categories for the primary housing types. As can be seen, Non-Master lease units spend relatively larger portions of their budgets on Supportive Services, while Master Lease units pay a larger portion in leasing costs and property management. DPH’s Master Lease Units allocate a greater percentage of spending on supportive services compared to HSA’s Master Lease units.
Table 3: Expenditure Allocations by Housing Type Master Lease
Expenditure Category DPH HSA1
Leasing 36% 35%
Property management 37% 51%
Supportive services 26% 14%
1 based on HSA 2011-12 SASH analysis
Non-Profit Owned & Other Affordable
Expenditure Category DPH HSA
Property management 62% 59%
Supportive services 38% 41%
Resident Profile and Access to Supportive Services
While no resident is required to utilize services in order to qualify for supportive housing, most contracts between HSA or DPH and the service provider generally require the provider to take affirmative steps to reach out to residents. All residents of supportive housing have access to services, including family members who are part of a household.
Budget and Legislative Analyst
19
Neither DPH nor HSA collects detailed information on the nature of client service utilization or the number of residents participating. See the below section, “In-take, Assessment, Compliance and Outcomes”, for additional details on contract performance requirements.
Services to Individuals and Families
Expenditures at sites for single adults accounted for 82 percent of all spending for supportive housing and 84 percent of all units in FY 2013-14, as shown in Table 4 below.
Table 4: Expenditures and Units by Population
Expenditures Percent Units Percent
Single Adults $46,783,653 82% 3890 84%
Senior-only Sites 6,057,034 11% 448 10%
Mixed Sites: Adults,
Families, & Youth 3,196,597 6% 218 5%
Family-only Sites 1,188,190 2% 64 1%
Total $57,225,474 100% 4620 100%
Source: Budget and Legislative Analyst, based on data provided by HSA and DPH
DPH and HSA’s average budgeted expenditure per supportive housing unit for a single adult in FY 2013-14 was $12,027. Housing units at family-only and mixed sites including families and youth have the highest average costs, as shown in Chart 7 below. These sites have higher average costs because they must accommodate a larger number of tenants per unit.
Chart 7: Average Expenditures per Housing Unit by Population1
1These figures are budgeted expenditures and do not include other potential funding sources Source: Budget and Legislative Analyst, based on data provided by HSA and DPH
$2,000 $4,000 $6,000 $8,000 $10,000 $12,000 $14,000 $16,000 $18,000 $20,000
Budget and Legislative Analyst
20
As noted previously, Single Adults in HSA’s Master Lease units have the lowest average budgeted expenditure for supportive services per eligible resident, at $1,859 per year. Senior-only sites, due to their greater need for care and support, had the highest average annual budgeted expenditure of $5,381 per eligible resident, as shown in Chart 8 below. Family-only sites also have relatively lower average supportive service expenditures because there are a larger number of eligible tenants per family unit.
Chart 8: Average Supportive Services Expenditures per Eligible Resident1
1 These figures are budgeted expenditures and do not include other potential funding sources. Averages were calculated based on available building tenant counts. HSA Master Lease data based on HSA 2011-12 SASH Analysis.
Source: Budget and Legislative Analyst, based on data provided by HSA and DPH
Variation in Housing and Service Costs among Providers
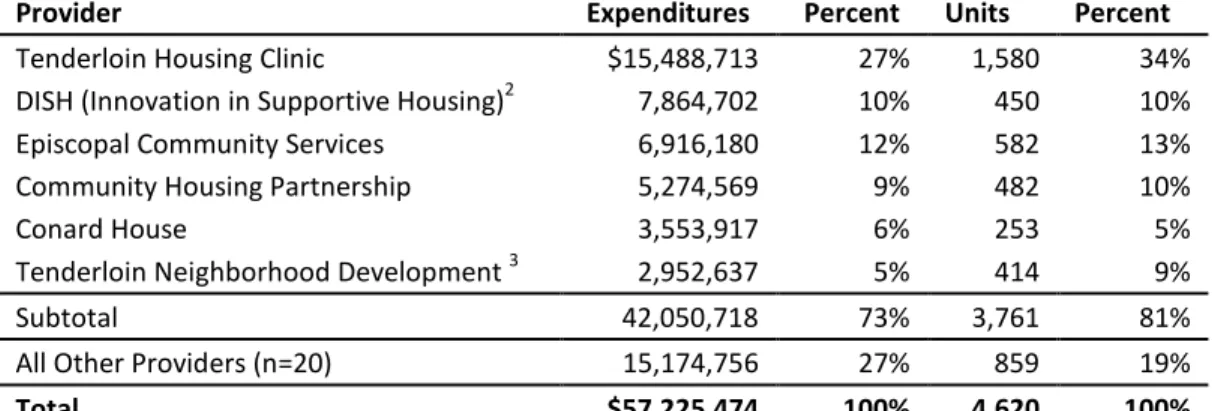
Six nonprofit providers accounted for 73 percent of all DPH and HSA budgeted expenditures for supportive housing in FY 2013-14, and provided 81 percent of supportive housing units, as shown in Table 5 below.
$1,000 $2,000 $3,000 $4,000 $5,000 $6,000 Single Adults (HSA Master Lease) Family-only
sites Mixed sites Single Adults(DPH Master Lease)
Senior-only sites
Budget and Legislative Analyst
21
Table 5: Budgeted Expenditures by Provider1
Provider Expenditures Percent Units Percent
Tenderloin Housing Clinic $15,488,713 27% 1,580 34%
DISH (Innovation in Supportive Housing)2 7,864,702 10% 450 10%
Episcopal Community Services 6,916,180 12% 582 13%
Community Housing Partnership 5,274,569 9% 482 10%
Conard House 3,553,917 6% 253 5%
Tenderloin Neighborhood Development 3 2,952,637 5% 414 9%
Subtotal 42,050,718 73% 3,761 81%
All Other Providers (n=20) 15,174,756 27% 859 19%
Total $57,225,474 100% 4,620 100%
1 An individual provider may receive funding from one or several City programs and may support a range of housing types, expenditure categories, and residents.
2 These are property management and leasing expenses only; supportive services at these sites are funded separately and provided by DPH-HUH.
3 This figure excludes $479,387 for the DPH-managed Housing and Urban Health Clinic at Kelly Cullen Community
Source: Budget and Legislative Analyst, based on data provided by HSA and DPH
Of these six providers, the Tenderloin Housing Clinic receives the most funding, accounting for 27 percent of all expenditures and 34 percent of all units. These units are located entirely within HSA’s Master Lease SRO portfolio.
DPH and HSA’s average per unit expenditure in FY 2013-14 for these six providers was $11,181 per unit. As shown in Chart 9 below, these expenditures range by provider from $7,132 per unit at the Tenderloin Neighborhood Development Corp to $17,477 per unit for Delivering Innovation in Supportive Housing (DISH). DISH is the sole property management provider for the Master Lease units in DPH’s portfolio.
Budget and Legislative Analyst
22
Chart 9: Average per Unit Expenditures for Six Largest Providers
*This figure excludes a supportive service-only contract at the DPH-managed Plaza Apartments
Source: Budget and Legislative Analyst, based on data provided by HSA and DPH
Additional factors that can drive differences in costs among providers include the different program models within each provider’s portfolio, variations in staffing levels, and variations in the service needs of different resident populations. Although data might indicate that larger providers are able to provide more housing at lower average cost, in fact the variance is due to the fact that several smaller vendors are more likely to receive funding for supportive services only – and there is therefore no funding associated with the operation of a supportive housing unit.
Case Study Analysis
Our analysis above suggests that variations in supportive service, property management, and leasing expenditures per unit are due largely to differing building characteristics, unit characteristics, population served, and level of services available.
However, as noted in the above Section (“Methodology”) certain costs, expenses, and sources of financial support are not fully captured when looking exclusively at supportive housing budgets. This is especially true for Non-Profit Owned and Other Affordable Housing sites. While for the most part expenditures for Master Lease units can be interpreted “as is” once rental revenues are accounted for, non-Master Lease units incur development costs that are not captured in supportive housing budgets. Also, as noted above, supportive housing units may receive sources of funding (tenant rents, federal grants) that are not included in the supportive housing budgets.
$0 $2,000 $4,000 $6,000 $8,000 $10,000 $12,000 $14,000 $16,000 $18,000 $20,000 Tenderloin Neighborhood Development Corp Tenderloin
Housing Clinic CommunityHousing Partnership
Conard
House* CommunityEpiscopal Services
Budget and Legislative Analyst
23
Impact of Development Costs and Other Funding
In this section we evaluated total supportive housing costs for two Non-Master Lease sites (one HSA and one DPH) that include the impact of development costs, Federal funding, and rental revenues, and compared these two sites to similar Master Lease supportive housing sites.
Arendt House
Table 6 below provides project details on Arendt House, a 47-unit Non-Profit Supportive Housing site in HSA's portfolio which opened in 2010. The site had a total FY 2013-14 HSA budget of $836,532 and a per-unit annual expenditure of $17,799. This figure is higher than the overall HSA Non-Profit Supportive Housing average of $14,681.
Arendt House is also one of seven supportive housing sites in our analysis (10% of total sites reviewed) that received Federal Shelter + Care funding in the amount of $219,648. Including these funds in the total homeless services budget in turn raises the per unit annual expenditure to $22,472.
Table 6: Arendt House Project Details Housing Type
Funding Agency Target Population Total Units
Total Homeless Units
Non-profit Supportive Housing HSA Seniors 47 46 FY ’13-14 Total Homeless Services
Budget (including Federal S+C funds) Per Unit Annual Expenditure
Total Project Development Cost Per Unit Development Cost
$1,056,180 $22,472 $16,457,421 $350,158 Source: HSA
As noted in the above table, total development costs for Arendt House were $16,457,42110, yielding a per unit development cost of $350,158. Amortized over
30 years, this yields an annual development cost of $11,672 per unit.11
Public financing equals $11,313,632 of total development costs of $16,457,421 (excludes private bank loans and investor equity), yielding annual per unit
10 Sources of funds for Arendt House’s development costs were City loans and grants, bank loans, Low Income Housing Tax Credits, investor equity and deferred developer fees.
11 The federal Low Income Housing Tax Credit Program requires that the private developer maintain the development as affordable housing for 30 years. California requires that the housing development remain affordable for 55 years if state tax credits are used in conjunction with federal tax credits. Amortizing development costs over 55 years results in an annual development cost of $6,367 and estimated annual per-unit expenditures of $28,839.
Budget and Legislative Analyst
24
publicly-financed development cost of $8,024. When combined with budgeted expenditures, estimated annual public expenditures are $30,496 per unit.
990 Polk Senior Housing
Table 7 below provides project details on 990 Polk Senior Housing, a 110-unit affordable housing development with 50 units dedicated for homeless seniors. The site, which opened in 2008, had a total FY 2013-14 DPH budget of $971,075 and a per-unit annual expenditure of $19,422, which was significantly higher than the DPH average for comparable affordable housing developments of $9,045, likely due to the increased costs to serve frail seniors with medical and behavioral health issues.
In FY 2013-14, the site’s DPH budget for operating costs was $632,206. However, according to a 2010 report by the Tenderloin Neighborhood Development Corporation, 72 percent of property operating costs are funded by residents’ rent payments, with the remainder coming via City funds. The site’s actual operating budget was therefore likely closer to $2.3 million. As previously noted, the amount of rental revenue available to cover property operating costs will vary by program and building, however at Affordable Housing sites there are residents in non-homeless units who pay larger portions of their income in rent.
Table 7: 990 Polk Senior Housing Project Details Housing Type
Funding Agency Target Population Total Units
Total Homeless Units
FY ’13-14 Homeless Services Budget Per Unit Annual Expenditure Total Project Development Cost Per Unit Development Cost
Affordable Housing DPH Seniors 110 50 $971,075 $19,422 $36,600,000 $309,112 Source: DPH
As noted in the above Table, this project required financing of approximately $36,600,000, yielding a per unit development cost of $309,112.12 Amortized over
30 years, this yields an annual development cost of $11,303 per unit. When combined with budgeted expenditures, estimated annual public expenditures are $30,725.
Non-Profit Housing versus Master Lease Units
Based on the two case studies noted here, expenditures per unit of non-profit housing exceed per unit expenditures for Master Lease housing when
12 This development project is wholly publicly-financed, including City loans, Low Income Housing Tax Credits, and federal loans and grants.
Budget and Legislative Analyst
25
development costs for non-profit housing are included13. The average DPH and
HSA FY 2013-14 budget for Master Lease housing was $12,678 per unit, while the average DPH and HSA FY 2013-14 budget for non-profit owned supportive housing was $12,925 per unit. However, when development costs of approximately $11,000 per unit per year are included, non-profit owned supporting housing has an average cost of $23,925 per unit per year, which is $11,247 more than the average Master Lease housing of $12,678 per unit per year.
In-take, Assessment, Compliance and Outcomes
Eligibility, In-take, & Assessment
The City’s supportive housing programs are available to homeless adults and families. HSA’s Master Lease program serves formerly homeless single adults and some seniors, while the non-profit owned housing at HSA's LOSP sites serves formerly homeless single adults and families. DPH’s Direct Access to Housing, which includes both Master Lease SROs and non-profit owned housing, serves formerly homeless adults with behavioral health and/or serious medical conditions. Table 8 below details each program’s primary eligibility, referral, and assessment protocols. DPH’s DAH program, which includes DPH’s LOSP sites, has the most stringent requirements, followed by the family units in HSA's portfolio. For all programs there may be significant variety at the site- and unit-level.
13 Development costs include City-financed costs such as affordable housing loans, other public financing such as low-income housing tax credits, and private financing.
Budget and Legislative Analyst
26
Table 8: Eligibility, Referral, and Assessment by Program
Human Services Agency Department of Public Health
Master Lease Program LOSP Direct Access to Housing
(includes LOSP sites) Eligibility Homeless Adults
Proof of income sufficient to support subsidized rent rates
Additional site- and unit-specific requirements, which vary
Homeless Adults & Families
Additional site- and unit-specific requirements, which vary
Homeless, “extremely low income” adults with serious medical condition and/or behavioral health diagnosis Willing to pay up to 50% of monthly income in rent via approved third part rent payment provider
Additional site- and unit-specific requirements, which vary depending on the funding source
Referral Housing First buildings: Referral Access Point Agencies submit applications on behalf of eligible adults
Care Not Cash buildings: referrals come through CAAP workers, CAAP clients in shelter, or the SF Homeless Outreach Team
No waiting lists
Referral Access Point Agencies submit applications on behalf of eligible families and adults No waiting lists
Potential tenants are referred by service providers, including institutional, acute, and transitional treatment settings HUH works with referring agencies to create a pool of applicants prioritized for housing based on level of acuity, need, and match with site amenities
Assessment No formal agency evaluation Adults: No formal agency evaluation
Families: Formal evaluation, must be classified as “moderate-to-high” need
Formal clinical evaluation performed by Nurse Practitioner at the DAH Access and Referral Team (DART)
Source: Budget and Legislative Analyst, based on data provided by HSA and DPH
Compliance
In general, the rules for staying in City-funded supportive housing concern two broad areas: 1.) maintaining good behavior and not breaking the law, and 2.) paying rent and maintaining the appropriate level of income.
For example, below are some of the subsidy rules that can cause a resident to be out of compliance for DPH’s Direct Access to Housing program:
• Failing to notify property management of income increases • Failing to maximize income
Budget and Legislative Analyst
27
• Vacating the unit for extended periods (more than 30 days) without requesting authorization in advance
Beyond compliance criteria at the program level, there are also “house rules” at supportive housing sites. These property management house rules are related to the maintenance of units, use of common areas, quiet hours, visitor and pet policies, and criminal or unreasonable behavior in the unit, community space, or property area.
It is unclear, however, to what extent these rules are enforced, the resources leveraged by building staff to enforce standards, or whether violations are accurately recorded and tracked.
Contract Outcomes and Performance Measures
Historically there has been some variation in individual contracts between HSA or DPH and the non-profit housing provider in terms of outcome, process, and service objectives, even for providers delivering similar services. DPH and HSA have recently implemented changes to standardize contracts: DPH standardized objectives for supportive housing providers in the fall of 2013, and HSA is moving to standardized objectives with the aforementioned NOFA.
DPH
DPH categorizes its outcome and process objectives by the type of services offered or facilitated by the vendor, for example “Supportive Housing”, “Supportive Services”, “Third Party Rent Payment”, or “Rental Subsidy / Operating Subsidy”. A particular contract may contain all of these service modalities or just one. DPH contracts will typically specify a performance target based on the type of service, although actual numbers will vary on a contract-by-contract basis depending on the program size.
Table 9 below lists some of DPH’s primary outcome and process objectives. The list is not comprehensive, but is instead meant to highlight central features. The list does not, for example, include performance targets regarding unit inspections, property management, or rental payment processes.
Budget and Legislative Analyst
28
Table 9: DPH Contract Outcome and Process Objectives
Supportive
Housing Supportive Services
Rental / Operating Subsidy Third Party Rent Payment Outcome Objectives Housing Retention X X X
Participants Meet Service Goals X X X
Service Retention Target X
Appropriate Housing Secured on Exit X X X
Income and Benefit Maximization X X
Process Objectives
Staff Outreach to Clients X X
Individualized Service Plans X X X
Annual Updates to Client Financial Plans X
Move-In Targets for Referred Clients X
Client Assessment: Benefits, Medical
Care, Mental Health & Substance Abuse X X
Mediation Services X X
Discharge Plans for Residents with
Planned Exits X X
Source: Budget and Legislative Analyst, based on data provided by DPH
DPH reports that the DAH program has produced the following high-level outcomes since the program’s inception in 1999:
• Approximately 2/3 of residents have remained housed in DAH • Of the 1/3 who exited, half moved to other permanent housing • 4 percent were evicted
• 4 percent died
DPH also reports evidence of significant decreases in emergency room visits as well as inpatient and skilled nursing days following placement in the DAH program. One study of the Plaza Apartment showed health care costs dropped from approximately $3 million a year prior to entry into supportive housing to $1 million a year post-placement. DPH does not, however, measure changes in health care utilization costs as part of the performance metrics and outcome measures tracked at the contractual level.
HSA
As noted above, HSA's new Tiered system will standardize service and outcome objectives depending on the type of housing and client need. The higher Tiers will have more stringent objectives. Actual performance targets have not been determined yet but will be established after baseline data has been collected in the first year (FY 2014-15).
Table 10 below lists HSA's outcome and service objectives according to the recently developed Tier system.
Budget and Legislative Analyst
29
Table 10: HSA Contract Outcome and Service Objectives by Tier
Tier 1 Tier 2 Tier 3 Tier 4 Tier 5
Outcome Objectives
Housing Stability X X X X X
Program Exits & Placements X X X X X
Service Objectives
Client Participation in Activities X X X X
Staff Outreach to Clients X X X X
Client Participation in Services X X X
Service & Goal Targets X X X
Health and Well-being Targets X X
Source: Budget and Legislative Analyst, based on data provided by HSA and DPH
Separate from the new objectives provided above, Table 11 below details the three high-level performance measures that HSA tracks and reviews on an annual basis. The table provides actual measures from FY 2012-13 and projections for FY 2013-14.
Table 11: HSA Housing and Homeless Performance Measures – FY 2013-14 Six Month Report Metric FY 2012-13 Actuals FY 2013-14 Six Month Actuals FY 2013-14
Projected FY 2013-14 Target Notes
Percent of formerly homeless single adults still in supportive housing or other appropriate placements after one year
94% 94% 94% 90%
This measure is only computed annually at the close of each fiscal year. Therefore, it does not change for July to December. The stability measure for single adults across all HSA housing programs (Master Lease, LOSP and Shelter Plus Care) for FY12-13 is 94.0%.
Percent of families exiting shelter who have stayed for 30 days or more not permanent housing, transitional housing, or a residential treatment program
61% 78% 70% 65%
Number of CAAP clients leaving homelessness due to obtaining housing through Care Not Cash
280 122 244 275
There is no funding for additional Care Not Cash housing, so housing placements can only be made when there is turnover within the existing portfolio of permanent supportive housing. Turnover is extremely low, and thus the number of placements has declined.
Budget and Legislative Analyst
30
Findings
Both Master Lease and non-profit owned supportive housing are
necessary components of the City’s supportive housing program because
the existing need for supportive housing exceeds the availability
As noted above in our Case Study analysis, Master Lease housing is both less expensive and more available than non-profit supportive housing. 2973 or 64% of 4620 supportive housing units are Master Lease units, as shown in Table 2 above. However, Master Lease supportive housing is considered less desirable because the buildings are often older and the rooms are smaller, generally without a private bathroom and never with a private kitchen. Master Lease supportive housing is primarily for single adults while non-profit supportive housing also serves families, youth and seniors.
The Master Lease supportive housing model developed largely because SRO hotels were an available housing supply for low-income San Franciscans. The City has subsidized SRO hotels since at least 1993, when the City entered into a Memoranda of Understanding with 25 SRO hotels. The Master Lease model was implemented by DPH in 1998 and by HSA in 1999. Currently, more than one half of the Master Lease hotels and Master Lease units are funded by Care Not Cash funds14.
Non-profit supportive housing units are less available because of the cost and length of time necessary to develop this housing. While the City assists in financing supportive housing developments through the Affordable Housing Fee, assessed on large residential developments, and the Housing Trust Fund, these funds comprise a small portion of the total costs of housing development.
Although the City has created more than 3000 supportive housing units since adoption of the Ten Year Plan in 2004, the number of homeless individuals has remained largely unchanged, increasing slightly from 6248 in January 2005 to 6436 in January 2013. Overall, those who are entering supportive housing are remaining housed instead of returning to homelessness, but the number of chronically homeless adults has not decreased and the need for additional supportive housing remains high.
Supportive housing is generally acknowledged as cost-effective, but
escalating land and property costs in San Francisco will significantly
increase supportive housing costs
Several studies have shown that the costs of housing and support services were outweighed by the cost savings from reduced emergency room visits, incarceration, and other costs. While the cost effectiveness of supportive housing
14 Care Not Cash, which was adopted by San Francisco voters in November 2002, cut cash aid to adults in general assistance (County Adult Assistance Program or CAAP) in exchange for services and shelter.