High-Throughput Screening Data Interpretation in the
Context of
In Vivo
Transcriptomic Responses to Oral
Cr(VI) Exposure
Julia E. Rager,* Caroline L. Ring,* Rebecca C. Fry,
†,‡Mina Suh,
§Deborah M.
Proctor,
§Laurie C. Haws,* Mark A. Harris,
¶and Chad M. Thompson
¶,1*ToxStrategies Inc, Austin, Texas 78759;
†Department of Environmental Sciences and Engineering, Gillings
School of Global Public Health and
‡Curriculum in Toxicology, University of North Carolina at Chapel Hill,
Chapel Hill, North Carolina 27516;
§ToxStrategies Inc, Mission Viejo, California 92692; and
¶ToxStrategies Inc,
Houston, Texas 77494
1To whom correspondence should be addressed at ToxStrategies, Inc., 23123 Cinco Ranch Blvd., Suite 220, Katy, TX 77494. Fax: (832) 218-2756. E-mail: [email protected].
ABSTRACT
The toxicity of hexavalent chromium [Cr(VI)] in drinking water has been studied extensively, and availablein vivoandin vitrostudies provide a robust dataset for application of advanced toxicological tools to inform the mode of action (MOA). This study aimed to contribute to the understanding of Cr(VI) MOA by evaluating high-throughput screening (HTS) data and otherin vitrodata relevant to Cr(VI), and comparing these findings to robustin vivodata, including transcriptomic profiles in target tissues. Evaluation of Tox21 HTS data for Cr(VI) identified 11 active assay endpoints relevant to the Ten Key
Characteristics of Carcinogens (TKCCs) that have been proposed by other investigators. Four of these endpoints were related to TP53 (tumor protein 53) activation mapping to genotoxicity (KCC#2), and four were related to cell death/
proliferation (KCC#10). HTS results were consistent with otherin vitrodata from the Comparative Toxicogenomics Database. In vitroresponses were compared toin vivotranscriptomic responses in the most sensitive target tissue, the duodenum, of mice exposed to180 ppm Cr(VI) for 7 and 90 days. Pathways that were altered bothin vitroandin vivoincluded those relevant to cell death/proliferation. In contrast, pathways relevant to p53/DNA damage were identifiedin vitrobut not in vivo. Benchmark dose modeling and phenotypic anchoring ofin vivotranscriptomic responses strengthened the finding that Cr(VI) causes cell stress/injury followed by proliferation in the mouse duodenum at high doses. These findings contribute to the body of evidence supporting a non-mutagenic MOA for Cr(VI)-induced intestinal cancer.
Key words:dose–response modeling; hexavalent chromium; high-throughput screening; mode of action; transcriptomics; risk assessment.
There is increasing impetus towards transforming toxicity test-ing and the assessment of potential human health risks through incorporation of new technologies, including high-throughput screening (HTS), toxicogenomics, bioinformatics, systems biology, and computational toxicology (NRC, 2007; Richard et al., 2016). The continued expansion of HTS data
through the ToxCast/Tox21 consortium has resulted in a large publicly available repository of in vitrotoxicity data currently spanning>1800 chemicals, generated with the goal of support-ing the development of improved toxicity prediction (Richard
et al., 2016). Toxicogenomic analyses have also become increas-ingly prevalent as a result of decreasing costs and increasing
VCThe Author 2017. Published by Oxford University Press on behalf of the Society of Toxicology.
This is an Open Access article distributed under the terms of the Creative Commons Attribution-NonCommercial-NoDerivs licence (http://creativecom-mons.org/licenses/by-nc-nd/4.0/), which permits non-commercial reproduction and distribution of the work, in any medium, provided the original work is not altered or transformed in any way, and that the work properly cited. For commercial re-use, please contact [email protected]
199 doi: 10.1093/toxsci/kfx085
feasibility of genome-wide screening technologies (Fry, 2015). Strategies to incorporate these methods and corresponding datasets into assessments of potential human health risks and regulatory decisions are current topics of growing interest (Bourdon-Lacombeet al., 2015;Moffatet al., 2015;Richardet al., 2016); however, more studies are still needed to evaluate the re-quired steps and utility of such efforts.
In 2008, findings were released from a 2-year cancer bioassay in mice and rats exposed to hexavalent chromium [Cr(VI)] in drinking water (NTP, 2008). These studies indicated that Cr(VI) induced tumors in the small intestines of mice and in the oral mucosa of rats. A comprehensive research program was subse-quently initiated to investigate the mode of action (MOA) under-lying the tumorigenic responses observed in these target tissues. This MOA research program has resulted in the genera-tion of an extensive body of histopathologic, pharmacokinetic, genotoxic, and biochemical data from the carcinogenic target tissues in rats and mice (Cullenet al., 2016;O’Brienet al., 2013; Thompsonet al., 2012,2015a,b,c). Transcriptomic data were also collected in target tissues after both short-term (7 days) and long-term (90 days) exposures (Kopecet al., 2012a,b). This rich dataset affords the opportunity to comparein vivotoxicity re-sponses to Cr(VI) toin vitrohigh throughput and high content data.
Cr(VI) is a known human carcinogen by inhalation and has long been recognized as genotoxic, based primarily onin vitrodata (IARC, 1990), and, primarily for these reasons, it has been assumed that Cr(VI) acts by a directly genotoxic MOA in causing tumors at all sites (OEHHA, 2011;U.S. EPA, 2010). However, more recent re-search has shown that Cr(VI) does not increase mutant frequency in the oral cavity of rats (Thompsonet al., 2015c), and that Cr(VI) causes intestinal tumors by chronic cytotoxicity in intestinal villi leading to chronic regenerative hyperplasia that increases the risk of crypt stem cell transformation and tumorigenesis (Thompson
et al., 2013). Some regulatory agencies have used these data to sup-port the development of threshold toxicity criteria for the intestinal tumors (Health Canada, 2015;TCEQ, 2016).
The Tox21 consortium recently releasedin vitrobioactivity data for Cr(VI) that has yet to be incorporated into the under-standing of Cr(VI) MOA for tumorigenic responses. The current study set out to do the following: (1) to analyze these recently generated HTS data and compare results against a large reposi-tory of public literature [ie, the Comparative Toxicogenomic Database (CTD)] to evaluate consistency between in vitro re-sponses to Cr(VI); (2) to update the data processing, statistical analysis, and dose–response modeling of transcriptomics data originally published byKopecet al.(2012a); and (3) to evaluate the utility of the HTSin vitrodata for purposes of informing the Cr(VI) MOA by comparing thein vitroresponses to thein vivo re-sponses at the pathway-level across all doses evaluated. Study findings contribute to the growing understanding of Cr(VI) MOA while demonstrating potential strengths and limitations ofin vi-troHTS data in the context of risk assessment.
MATERIALS AND METHODS
Tox21 data collection and organization. In vitroHTS data for Cr(VI), in the form of sodium dichromate dihydrate (SDD), are available through the Tox21 consortium, a federal collaboration between the National Toxicology Program at the National Institute of Environmental Health Sciences and the National Center for Advancing Translational Sciences, the Food and Drug Administration, and the United States Environmental Protection Agency (U.S. EPA). For the current investigation,
processed Tox21 data for SDD were extracted from the U.S. EPA’s Summary Files (invitrodb_v2, released Oct 2015) (U.S. EPA, 2015), including assay summary activity (hit) call, AC50 (concen-tration at which the activity reaches 50% of its maximal values for an assay-chemical pair),Z-score (indicator of the distance from cytotoxicity distribution), and cytotoxicity data. It should be noted that there are several additional ways to access the Tox21 database [eg, through the National Institutes of Health (NIH) website]. However, the resource provided through the U.S. EPA was used because, at the time of the analysis, it represented the most accessible route to the data and provided other summary-level assay statistics such as the hit calls, AC50values, andZ-scores, described in further detail below. No data were available for SDD in the ToxCast assay suite.
Chemical-assay activity was characterized by hit calls, repre-sented by values of 1, 0, or1. A value of 1 indicated an “active” chemical, a value of 0 indicated an “inactive” chemical, and a value of1 indicated that the activity could not be determined. Hit calls were based on criteria previously defined by the U.S. EPA (Judsonet al., 2015,2016). Z-scores were also used to evalu-ate the relationship between chemical-assay activity and assay cytotoxicity distributions. A higherZ-score (eg,Z-score>2) indi-cated assay activity that occurred at a concentration far below the “cytotoxic signal burst” region, and a lower Z-score (eg, Z-score2) indicated assay activity that occurred at a concen-tration at or above the “cytotoxic signal burst” region (Judson
et al., 2016). As was implemented in a recent evaluation of ToxCast data (Auerbachet al., 2016), chemical-assay pairs with Z-scores2 were excluded to account for this potential cytotox-icity interference. It is notable that a Z-score cutoff of 3 has recently been proposed (Judsonet al., 2016); however, aZ-score of 2 was selected for the purposes of the current investigation to increase inclusivity in potential assay activity results. Tox21 data were also evaluated in the context of the Ten Key Characteristics of Carcinogens (TKCC) recently proposed by Smithet al.(2016), using assay-characteristic mappings previ-ously implemented by the International Agency for Research on Cancer (IARC) in Monograph Volume 112 (IARC, 2015).
Identifying in vitro responses to Cr(VI) with comparative toxicogenom-ics database.In order to compare Tox21 HTS results to other pre-viousin vitrofindings, the CTD was queried for chemical-gene/ protein interactions relevant to Cr(VI). The CTD is a publicly available database containing manually curated information on chemical-gene-disease relationships from previously published scientific literature (Daviset al., 2015). At the time of the analy-sis, CTD contained42 000 genes (spanning 565 organisms) and 12 000 chemicals, resulting in1.4 million curated chemical-gene/protein interactions. The following Cr(VI)-relevant com-pounds were analyzed through CTD’s batch query (with chemical names listed according to CTD inventory): chromium hexavalent ion (CAS 18540-29-9), potassium chromate(VI) (CAS 7789-00-6), and sodium bichromate/sodium dichromate (CAS 10588-01-9) (CTD, 2016). Note that studies using SDD (CAS 7789-12-0) were annotated to sodium dichromate/sodium bichromate in CTD. In order to identify which chemical-gene/protein inter-actions were fromin vitro study designs, all study titles and abstracts were manually reviewed through PubMed (NCBI, 2016). All chemical-gene/protein interactions were used, includ-ing alterations in gene expression, protein expression, and pro-tein activation.
(see below) data using the IngenuityVR
Pathway Analysis (IPA) Knowledgebase (v27821452, IngenuityVR
Systems, Redwood City, CA) with the aim of identifying canonical pathways associated with responses to Cr(VI) exposure. The Ingenuity database pro-vides a collection of biological interactions and functional anno-tations created from millions of individually modeled relationships between proteins, genes, complexes, cells, tissues, drugs, and disease curated from full-text review of articles from scientific journals. The knowledgebase includes650 canonical pathways, which are well-characterized metabolic and cell sig-naling pathways curated and drawn from expert review of jour-nal articles, review articles, text books, and the Encyclopedia of Human Genes and Metabolism (HumanCyc). Consistent with IPA recommended best practices, statistical significance of each canonical pathway was calculated using a right-tailed Fisher’s exact test using a competitive null hypothesis. Pathways with p<.05 were considered significant and included for further analysis. Multiple test corrected p-values of pathway enrich-ment (using the Benjamini and Hochberg multiple test correc-tion) were also calculated.
Molecular upstream regulators were also computationally predicted using the Ingenuity Knowledgebase, using previously published methods (Kramer et al., 2014). Activation Z-scores were generated to predict the activation states of predicted upstream regulators that could explain the observed gene/pro-tein expression changes.p-Values were also produced using the Fisher’s Exact Test to measure whether there was a statistically significant overlap between the Cr(VI)-responsive molecules and the molecules that are regulated by an upstream regulator. In order to be predicted as a regulator of the observed molecular changes, upstream regulators were required to haveZ-score> 62 andp<.05.
In vivo study design. To compare in vitroresponses to in vivo responses in a primary site of Cr(VI)-induced tumorigenesis, a toxicogenomic analysis was carried out in duodenal tissue of mice exposed to Cr(VI) via drinking water for 13 weeks. These data have been previously described and analyzed (Kopecet al., 2012a,b), but were re-processed and analyzed here using updated methods, tools, and databases for interpretation (see below). Tissues used for toxicogenomic assessment were from animals exposed to varying concentrations of Cr(VI) in the form of SDD for 7 or 90 days, as previously described (Thompson
et al., 2011,2012).
As described byThompsonet al.(2011,2012), dose formula-tions were prepared at concentraformula-tions of 0.3, 4, 14, 60, 170, and 520 mg/l SDD (CAS 7789-12-0) in tap water, which is equivalent to0.1, 1.4, 5, 20.9, 59.3, and 180 ppm Cr(VI). On the first, third, fifth, and seventh (final) batch preparations, samples of formu-lations for each dose group, including the control, were col-lected and analyzed for Cr(VI) content at Brooks Rand Laboratories (Seattle, WA) in accordance with EPA Method SW-7196A. Batch preparations found to differ from the target con-centration by610% were not used.
Details regarding animals, vendors, and animal husbandry were described previously (Thompsonet al., 2011,2012). In brief, female B6C3F1 mice (Charles River, Raleigh, NC) were received at 4–5 weeks of age and allowed to acclimate for2 weeks. Mice were 13.3–22.9 g of weight at the start of exposure. All animals were allowed ad libitum access to irradiated NTP-2000 chow (Zeigler Bros., Gardners, PA) and drinking water (including test article) until study termination at days 8 or 91 of exposure. The in-life portion of these studies were conducted at Southern
Research Institute (Birmingham, AL), the same research facility that conducted the NTP Cr(VI) bioassays (NTP, 2007,2008).
Preparation of mouse duodenum samples was carried out by collecting and flushing intestinal sections with ice-cold phos-phate buffered saline. Duodenal sections were cut longitudi-nally, and the epithelium was scraped using sterile plastic spatulas (VWR International) into vials containing TRIzol (Invitrogen, Carlsbad, CA), snap-frozen in liquid nitrogen, and stored at80C. These frozen tissue samples were homogen-ized using a Mixer Mill 300 tissue homogenizer (Retsch, Germany). Total RNA was isolated according to the manufactur-er’s TRIzol extraction protocol with an additional acid phenol:-chloroform extraction. Isolated RNA was resuspended in RNA storage solution (Ambion Inc., Austin, TX), quantified, and qual-ity assessed by evaluation of A260/A280 ratios and by visual inspection of 1mg total RNA on a denaturing gel. Only high qual-ity RNA samples (A260/280>1.9) were further examined.
Transcriptomic analyses.Gene expression changes resulting from Cr(VI) exposure in duodenal tissues were examined using mouse 444 K Agilent whole-genome oligonucleotide microar-rays (version 1, Agilent Technologies, Inc., Santa Clara, CA). The tissue samples and microarrays were processed shortly after collection (ie,ca. 2012), and data were previously analyzed using posterior probabilities based on an empirical Bayes method using model-based t-values and genes filtered using fold change 61.5 and P1(t) value>0.999 (Kopecet al., 2012a;Kopecet al., 2012b). In the current study, microarray data were re-analyzed using methods consistent with microarray assessment guide-lines for use in risk assessment (Bourdon-Lacombeet al., 2015). Microarrays incorporated independent labeling of each sample with two different dyes that were scanned using a GenePix 4000B scanner at 532 nm for Cy3 labeling (green dye), and 635 nm for Cy5 labeling (red dye). The mRNA microarray data were analyzed by pulling data for the median Cy3 dye signal, because the Cy5 dye signal has been shown to be susceptible to laboratory-introduced biases/errors (eg, ozone) (Fareet al., 2003). Microarray data quality was assessed by reviewing probe signal intensity distributions and through principal component analy-sis (R v3.2.4) (Thompsonet al., 2016). Microarray data are pub-licly available at www.Cr6study.info and NCBI’s Gene Expression Omnibus, accessible through GEO Series accession number GSE87262 (Edgaret al., 2002).
quantitative real-time polymerase chain reaction (qRT-PCR) results in the previously published analyses (Kopecet al., 2012a).
Dose–response modeling of in vivo transcriptomic changes. Dose– response modeling of the DEGs associated with Cr(VI) exposure in the mouse duodenum was conducted with BMDExpress v1.4 using methods previously detailed (Moffat et al., 2015; Yang
et al., 2007). Briefly, analyses were carried out on the lists of DEGs (represented by their respective microarray probesets) against Cr(VI) dose (mg SDD/L)1using four models: Hill, power, linear, and 2polynomial. The models were run assuming con-stant variance, and a benchmark response (BMR) factor of 1.349 was used, representing the number of standard deviations required to shift the mean transcriptional response 10% over the assumed background rate of response, defining the bench-mark dose (BMD). Models with the best fit were selected as those that (1) described the data with the least complexity, (2) had a nested likelihood ratio testp<.05, and (3) had the low-est Akaike information criterion (AIC). The Hill model was con-sidered only when the k parameter (representing the slope) was more than one third of the lowest dose tested, in order to avoid artificial minimization of BMDs. Other parameters used in the analysis included setting the maximum iterations to 250 and the confidence level to 0.95. Probesets were removed if they showed either BMD/BMDL (BMD lower confidence limit) ratios >20, BMD values less than 10-fold below the lowest SDD con-centration tested, and/or BMD values greater than the highest concentration tested in order to avoid model extrapolation. In order for the models to adequately describe potential dose– response trends in gene expression, curves were required to have goodness-of-fitp>.1 (likelihood ratio test) (Moffatet al., 2015;Yanget al., 2007). Genes showing adequate dose–response curve fits were identified as showing dose–response relation-ships with Cr(VI) exposure.
Pathway and upstream regulator analysis of in vivo transcriptomic changes. Pathway enrichment analyses of the DEGs showing dose–response relationships with Cr(VI) exposure were carried out using IPA, as described above. Pathways with enrichment p<.05 were included for further analysis, paralleling the statis-tical filters used in toxicogenomics-based analyses used for chemical risk assessment purposes (Farmahin et al., 2016; Jackson et al., 2014; Moffatet al., 2015). To provide a specific example, a recent publication reviewed multiple approaches for calculating points of departure using transcriptomic data, wherein all approaches used BMDs calculated from IPA path-ways with enrichmentp<.05 (Farmahinet al., 2016). Multiple test correctedp-values of enrichment were also calculated and reported in the current analysis.
The resulting pathways and their related molecules were extracted, BMD values for each pathway-relevant molecule were pulled, and overall pathway-level median BMD values were calculated using R (v3.2.4). In the case that multiple probes showed adequate dose–response relationships to Cr(VI) for the same gene, probes with the highest goodness-of-fit p-value were used in calculating median BMD values. For data interpre-tation purposes, enriched canonical pathways were also organ-ized into larger categories in an objective manner, using annotations provided by the Ingenuity’s Signaling Pathway
Categories. Pathway-level findings were linked to previously published histopathological findings in order to phenotypically anchor the observed transcriptomic responses to potential key events involved in Cr(VI) MOA. Potential key events involved in Cr(VI) MOA were identified by reviewing MOAs suggested through recent peer-reviewed publications (McCarroll et al., 2010; Thompson et al., 2011). Among the available signaling pathway categories, four were involved in potential key events: (1) cell stress and injury (including genotoxic responses), (2) apoptosis, (3) cell growth, proliferation and development, and (4) cancer (as the eventual adverse outcome). Molecular upstream regulators of the DEGs were computationally pre-dicted using methods described in the above text.
RESULTS
Tox21 Results Showed Cr(VI)-Induced Changes in TP53 Activation and Cell Proliferation
Cr(VI) (as SDD) data were available across 113 Tox21 assay end-points, 40 of which were identified as active in response to SDD exposure (Table 1). An important aspect to consider when inter-preting HTS data is the concentration at which cytotoxicity occurs, as activity that occurs near or above concentrations inducing cytotoxicity may reflect non-specific assay activation or activity associated with general disruption of cellular machi-nery that can lead to cell stress/death (ie, “cytotoxic signal burst”), rather than disruption of specific biomolecular targets or pathways (Judsonet al., 2016). SDD caused cytotoxicity in the active assays at a median AC50of 30.3mM. Rather than directly comparing the chemical-assay versus cytotoxicity AC50, a statis-tical approach was implemented through a Z-score filter, as implemented in recent publications (Auerbach et al., 2016; Judsonet al., 2016). Of the 40 active assay endpoints, 20 showed Z-scores>2 (Tables 1and2), representing assay endpoints that likely indicate specific disruption of biomolecular targets or pathways rather than cytotoxicity interference.
Interpreting HTS findings in the context of the TKCC, two key characteristics showed the highest number (n¼4) of active assay endpoints with Z-scores>2: genotoxic (KCC#2) and cell proliferation, cell death, or nutrient supply (KCC#10). All of the active assays mapping to KCC#2 were indicative of human tumor protein 53 (TP53) DNA binding activation (Table 2). These assay data were generated with an inducible reporter (detected with fluorescence intensity signals by GAL4 beta lactamase reporter gene technology) using a human intestinal cell line (HCT116) treated with SDD at varying concentrations (0–100mM) for 24 h. It is important to note that although p53 activation can be triggered by DNA damage (Levine et al., 2006), these TP53 assay endpoints did not directly measure genotoxicity. All of the active assays mapping to KCC#10 represented cell viability assay endpoints that were categorized with the biological proc-ess target of cell proliferation (Table 2). In addition to the assays showing activity, it is also important to note that inactive assay endpoints mapped to other KCCs, including chronic inflamma-tion (KCC#6) and modulainflamma-tion of receptor-mediated effects (KCC#8), showing the following number of active/total assays: 0/1 and 1/20 (Table 1).
In VitroResponses to Cr(VI) Identified Through CTD
To determine whether Tox21 HTS results are consistent with other published in vitro findings, the CTD was queried for chemical-gene/protein interactions relevant to Cr(VI) exposure and filtered for interactions identified in vitro. Querying 1 PBPK models for Cr(VI) are available; however, the dose
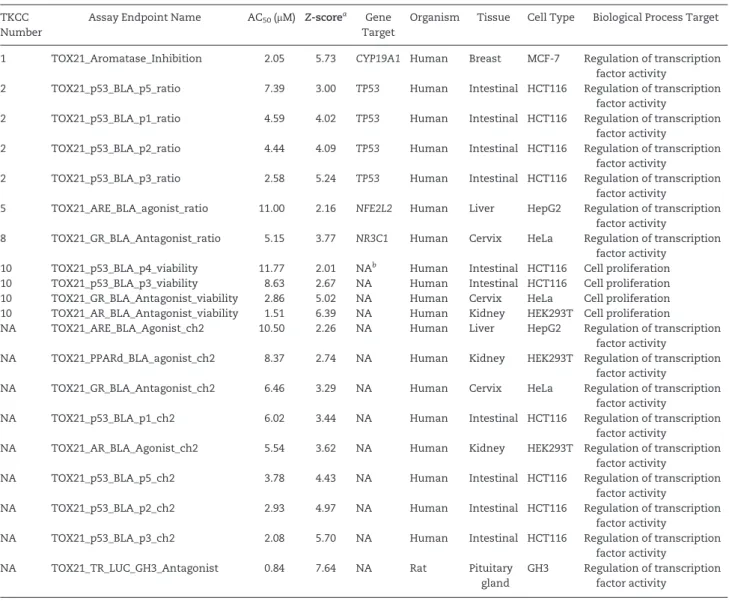
Table 1.Summary of the Number of HTS Assay Endpoints Used to Evaluated Cr(VI) Bioactivity Through the Tox21 Database, as Organized According to the TKCC
TKCC Number TKCC Name Number of Assay Endpoints Tested
Number of Active Assay Endpoints
Number of Active Assays Endpoints withZ-score>2
1 Act as an electrophile either directly or after metabolic activation 1 1 1 2 Is genotoxic 5 5 4 3 Alter DNA repair or cause genomic instability 0 NAa NA
4 Induce epigenetic changes 0 NA NA 5 Induce oxidative stress 3 1 1 6 Induce chronic inflammation 1 0 0 7 Be immunosuppressive 0 NA NA 8 Modulate receptor-mediated effects 20 7 1 9 Cause immortalization 0 NA NA 10 Alter cell proliferation, cell death, or nutrient supply 22 13 4 NA Not mapped to TKCC 61 13 9 Sum 113 40 20
TKCC¼Ten Key Characteristics of Carcinogens as described inSmith et al. (2016)and mapped according to IARC monograph volume 112 (IARC, 2015).
aNA, not applicable.
Table 2.Tox21 Active Assay Endpoints Associated With SDD TreatmentIn Vitro, Organized According to the TKCC
TKCC Number
Assay Endpoint Name AC50(mM) Z-scorea Gene
Target
Organism Tissue Cell Type Biological Process Target
1 TOX21_Aromatase_Inhibition 2.05 5.73 CYP19A1 Human Breast MCF-7 Regulation of transcription factor activity
2 TOX21_p53_BLA_p5_ratio 7.39 3.00 TP53 Human Intestinal HCT116 Regulation of transcription factor activity
2 TOX21_p53_BLA_p1_ratio 4.59 4.02 TP53 Human Intestinal HCT116 Regulation of transcription factor activity
2 TOX21_p53_BLA_p2_ratio 4.44 4.09 TP53 Human Intestinal HCT116 Regulation of transcription factor activity
2 TOX21_p53_BLA_p3_ratio 2.58 5.24 TP53 Human Intestinal HCT116 Regulation of transcription factor activity
5 TOX21_ARE_BLA_agonist_ratio 11.00 2.16 NFE2L2 Human Liver HepG2 Regulation of transcription factor activity
8 TOX21_GR_BLA_Antagonist_ratio 5.15 3.77 NR3C1 Human Cervix HeLa Regulation of transcription factor activity
10 TOX21_p53_BLA_p4_viability 11.77 2.01 NAb Human Intestinal HCT116 Cell proliferation
10 TOX21_p53_BLA_p3_viability 8.63 2.67 NA Human Intestinal HCT116 Cell proliferation 10 TOX21_GR_BLA_Antagonist_viability 2.86 5.02 NA Human Cervix HeLa Cell proliferation 10 TOX21_AR_BLA_Antagonist_viability 1.51 6.39 NA Human Kidney HEK293T Cell proliferation
NA TOX21_ARE_BLA_Agonist_ch2 10.50 2.26 NA Human Liver HepG2 Regulation of transcription factor activity
NA TOX21_PPARd_BLA_agonist_ch2 8.37 2.74 NA Human Kidney HEK293T Regulation of transcription factor activity
NA TOX21_GR_BLA_Antagonist_ch2 6.46 3.29 NA Human Cervix HeLa Regulation of transcription factor activity
NA TOX21_p53_BLA_p1_ch2 6.02 3.44 NA Human Intestinal HCT116 Regulation of transcription factor activity
NA TOX21_AR_BLA_Agonist_ch2 5.54 3.62 NA Human Kidney HEK293T Regulation of transcription factor activity
NA TOX21_p53_BLA_p5_ch2 3.78 4.43 NA Human Intestinal HCT116 Regulation of transcription factor activity
NA TOX21_p53_BLA_p2_ch2 2.93 4.97 NA Human Intestinal HCT116 Regulation of transcription factor activity
NA TOX21_p53_BLA_p3_ch2 2.08 5.70 NA Human Intestinal HCT116 Regulation of transcription factor activity
NA TOX21_TR_LUC_GH3_Antagonist 0.84 7.64 NA Rat Pituitary gland
GH3 Regulation of transcription factor activity
TKCC¼Ten Key Characteristics of Carcinogens as described inSmith et al. (2016)and mapped according to IARC monograph volume 112 (IARC, 2015).
aZ-scores are based on comparing chemical-assay AC
50against chemical cytotoxicity distribution, with SDD showing a median cytotoxicity AC50of 30.3mM.
chromium hexavalent ion, potassium chromate(VI), and sodium bichromate/sodium dichromate resulted in the identifi-cation of 525, 5168, and 641in vitrochemical-gene/protein inter-actions from 70, 13, and 19 references, respectively (Supplementary Table 1). The majority of these chemical-gene/ protein interactions (5757 out of 6334 interactions) represented changes in gene expression. Together, a total of 3502 unique molecules were identified as altered by in vitro exposure to Cr(VI) through CTD. Of these molecules, 2028 were identified by two or more references and 435 were identified by three or more references. Notably, TP53 alterations associated with in vitro Cr(VI) exposure were identified in 10 studies.
In VitroResponses to Cr(VI) Are Enriched for Apoptosis, p53, and DNA Damage Response Signaling
Pathway enrichment analysis was carried out using the IngenuityVR
Pathway Analysis knowledgebase with the aim of identifying canonical pathways associated with responses to Cr(VI) exposurein vitro. Analyses were completed for the genes/ proteins with alterations identified through the CTD repository, using three separate lists: (1) molecules identified by1 study (n¼3502), (2) molecules identified by2 studies (n¼2028), and (3) molecules identified by3 studies (n¼435). Due to the large number of molecules shown to be altered by Cr(VI) exposure, many canonical pathways were identified as enriched (Supplementary Table 2). Amongst the most significantly enriched pathways across all three lists were apoptosis signal-ing (p¼3.981013,p¼5.011011, andp¼6.311017for molecules identified by1 study,2 studies, and3 studies, respectively), ATM (ataxia telangiectasia mutated) signaling (p¼1.001012, 1.581015, and 1.581015), and p53 signal-ing (p¼1.581013
, 3.981015
, and 7.941015
). Notably, these pathways also showed significance after correction for multiple testing (Supplementary Table 2). These findings dem-onstrate consistency betweenin vitro Tox21 HTS results (p53 activity and cell proliferation/cell death alterations) andin vitro CTD results (alterations in p53, DNA damage, and apoptosis).
Transcriptomic Changes Associated WithIn VivoExposure to Cr(VI)
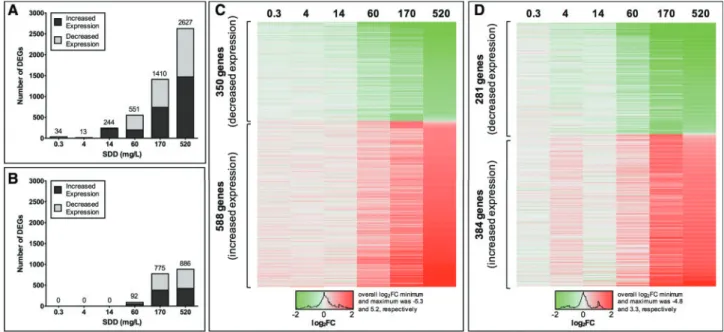
Transcriptomic analyses were carried out using mouse duode-num tissue, the target tissue shown to undergo tumorigenesis with the highest incidence in mice chronically exposed to high doses of Cr(VI) via drinking water (NTP, 2008). Transcriptomic analyses, along with qRT-PCR verification, were published pre-viously using an empirical Bayes method (Kopecet al., 2012a,b). The present updated analysis includes advancements in genomics-based tools and methods specifically relevant to risk assessment. Notably, the new analyses were consistent with previous qRT-PCR results (Supplementary Figure 1). Transcriptomic analysis identified a total of 3029 genes (repre-sented by 4041 probe sets) with differential expression resulting from 7 days of exposure in at least one dose group (Supplementary Table 3), and a total of 1099 genes (represented by 1449 probe sets) with differential expression resulting from 90 days of exposure (Supplementary Table 4). In general, the number of DEGs with altered expression increased with increas-ing Cr(VI) exposure concentrations (Figure 1). Notably, signifi-cant gene expression alterations did not occur until 60 mg/l SDD (20 ppm Cr(VI)) in mice exposed for 90 days (Figure 1B).
Dose–Response Analysis of Transcriptomic Changes
DEGs associated with Cr(VI) treatment in the mouse duodenum were analyzed for dose-dependent changes using BMDExpress, with the goals of identifying genes that show dose-dependent
changes in expression and comparing estimated doses at which changes in pathways relevant to Cr(VI) key events occur. Out of the 3029 DEGs resulting from 7 days of exposure in at least one dose group, 938 showed dose-dependent changes (Figure 1C, Supplementary Table 5). The median BMD estimate was 42 mg SDD/l, and the median BMDL estimate was 26 mg SDD/l (Table 3). Out of the 1099 DEGs resulting from 90 days of exposure in at least one dose group, 665 showed dose-dependent changes (Figure 1D, Supplementary Table 5). The median BMD estimate was 38 mg SDD/l, and the median BMDL estimate was 28 mg SDD/l (Table 3). Example dose– response curve plots are provided in supplementary material (Supplementary Figure 2).
Pathway Enrichment Analysis ofIn VivoDose-Dependent Genes
The DEGs showing good dose–response curve fits were analyzed in the context of canonical pathways. A total of 55 pathways were identified as associated with genes showing dose-dependent changes after 7 days of exposure, and 62 pathways with genes showing dose-dependent changes after 90 days of exposure (Supplementary Table 2). Median BMD values across all molecules in each pathway were calculated, as used in previous transcriptomic BMD assessments (Thomas
et al., 2012b), and resulted in the generation of pathway-level median BMD estimates (Supplementary Table 6). These pathway-level median BMD estimates ranged from 8 to 108 mg SDD/l for the day 8 results, and 18–132 mg SDD/l for the day 91 results (Table 3).
The individual canonical pathways associated with Cr(VI) exposure were organized in an objective and reproducible man-ner into larger signaling pathway categories, as provided by the Ingenuity knowledgebase (Supplementary Table 6). Among the available signaling pathway categories, four are involved in potential Cr(VI) MOA key events, with key events extracted from previous Cr(VI) MOA reviews (McCarrollet al., 2010;Thompson
et al., 2011): (1) cell stress and injury, (2) apoptosis, (3) cell growth, proliferation and development, and (4) cancer (as the eventual adverse outcome). Notably, the cell stress and injury pathway includes genotoxicity, which was a major early key event proposed byMcCarroll et al. (2010). All enriched pathways that relate to these categories are shown in Table 4 with pathway-level median BMD and BMDL estimates. In general, pathways related to cell stress and injury included genes with majority increased expression associated with Cr(VI) exposure. Pathways related to the larger category of apoptosis (which included the canonical apoptosis pathway, among others) were not enriched at day 8; yet showed enrichment at day 91. These pathways included genes with majority decreased expression associated with Cr(VI), suggesting that decreased apoptosis-related signaling occurred. Consistent with this finding, almost all pathways related to cell growth, proliferation and develop-ment included genes with majority increased expression at day 8 and 91. Evaluation of the pathway-level median BMD esti-mates showed that at day 8, pathway alterations related to key events occurred between 19 and 82 mg SDD/l. The median pathway-level BMD estimates at day 91 were higher than day 8, ranging from 29 to 132 mg SDD/l for pathways related to key events (Table 3).
Phenotypic Anchoring ofIn VivoTranscriptomic Findings
intestinal villus atrophy and blunting that have been observed in mice exposed to60 mg SDD/l for 90 days (Cullenet al., 2016). Decreased signaling related to apoptosis and increased signal-ing related to cell growth, proliferation, and development is also supported at the histopathology level through observed increases in intestinal crypt length in exposed mice (Thompson
et al., 2015a,b).In vivoduodenal micronucleus (MN) assays indi-cate a lack of genotoxicity in the crypt compartment (O’Brien
et al., 2013;Thompson et al., 2015b), which is also consistent with transcriptomic responses showing a lack of p53/DNA dam-age response signaling alterations. Moreover, these findings are also consistent with X-ray fluorescence mapping of chromium in the unstained duodenal sections from mice exposed to 180 ppm Cr(VI) for 7 and 90 days (Thompsonet al., 2015a,b), which indicates that chromium localizes to intestinal villi, but not the crypt regions where cell proliferation occurs.
Alterations in cancer signaling can potentially be anchored to the adverse outcome of tumor formation in the mouse duo-denum tissue observed in 2-year Cr(VI) bioassays (NTP, 2008);
however, pre-neoplastic lesions have not been observed in mice or rats exposed to 180 ppm Cr(VI) for 90 days (NTP, 2007; Thompsonet al., 2011,2012), and tumors were not observed in mice until well after one year of exposure (NTP, 2008). Therefore, caution is needed when anchoring the “cancer” path-way changes because the time- and dose-matched tissues were not diagnosed as neoplastic or pre-neoplastic. For example, the increases in cancer-related signaling observed at day 8 (Figure 2A) largely resulted from increased expression of matrix metalloproteases, including Mmp2,Mmp7,Mmp9, Mmp10, and Mmp13. Notably, Mmp10 and Mmp13 also showed dose-dependent increases in expression at day 91. These genes are known to be involved in tissue remodeling, cell migration, immune cell recruitment, and angiogenesis (Klein and Bischoff, 2011), representing functions that can overlap with carcinogen-esis. Matrix metalloproteases also show increased expression in the intestine linked to tissue remodeling in gluten enteropathy (ie, celiac disease) (Ciccocioppoet al., 2005;Salmelaet al., 2001), representing an intestinal disease state that shares some
Figure 1.Genes with differential expression associated with exposure to Cr(VI) in the mouse duodenum. The number of DEGs identified by comparing exposed versus unexposed samples (FC2,q<0.05) after (A) 7 days and (B) 90 days of exposure to varying concentrations of Cr(VI) (as SDD in drinking water). DEGs that showed both differential expression in exposed versus unexposed samples (FC2,q<0.05) and dose-dependent changes in expression identified through BMD modeling (curve fit
p>.10) after (C) 7 days and (D) 90 days of exposure to Cr(VI). Heat maps display fold change (FC) in expression (exposed/unexposed) for each DEG, with the concentra-tions of SDD (in mg/l) listed on the top.
Table 3.BMD and BMDL Estimates forIn VivoTranscriptomic Responses to Cr(VI) in the Mouse Duodenum
Day 8 BMD Estimates Mean, Median
(Min–Max)
Day 8 BMDL Estimates Mean, Median
(Min–Max)
Day 91 BMD Estimates Mean, Median
(Min–Max)
Day 91 BMDL Estimates Mean, Median
(Min–Max)
DEGs that show dose-dependent changes
63, 42 (0.045–505) 40, 26 (0.004–337) 51, 38 (0.397–513) 35, 28 (0.052–293) Median pathway-level BMD values across all enriched canonical pathways
51, 52 (8–108) 33, 30 (2–71) 48, 45 (18–132) 33, 31 (13–97) Median pathway-level BMD values across categories relevant to key events
Cell stress and injury 38, 44 (19–60) 25, 28 (9–43) 41, 39 (34–47) 30, 30 (23–34) Apoptosis None None 54, 44 (29–132) 39, 31 (20–97) Cell growth, proliferation and development 35, 26 (19–71) 21, 14 (9–47) 43, 45 (29–61) 33, 34 (21–51) Cancer 80, 80 (79–82) 59, 59 (52–67) 42, 42 (39–44) 31, 31 (30–31)
common histopathological phenotypes with Cr(VI) (eg, villus atrophy and crypt hyperplasia). It is notable that other enriched pathways that were not annotated to the larger “cancer” signal-ing pathway (through IPA) could be argued to play a role in car-cinogenesis. However, only pathways annotated to “cancer” through the IPA knowledgebase were included in this category to maintain objectivity and reproducibility (although all results are detailed in Supplemental Table 6).
Comparison ofIn VitroversusIn VivoPathways and Upstream
Regulators Associated With Cr(VI)
Comparing thein vitroversusin vivopathway-level responses to Cr(VI) indicates that both experimental models exhibited signal-ing related to cell death and cell proliferation (Supplementary Table 2). However, despite the use of ap<0.05 pathway enrich-ment filter (representing a less stringent filter than a multiple test corrected p-value), pathway changes related to p53/DNA damage were evidentin vitrobut notin vivo. This was specifi-cally evidenced by the canonical apoptosis pathway including changes relevant to p53/DNA damagein vitro, but not in vivo
(Figure 2A and 2B). Furthermore, the canonical p53 signaling pathway showed enrichmentin vitrobut notin vivo(Figure 2C and 2D). It is worth emphasizing that this lack of p53 signaling was observed across a wide range of in vivo exposure levels (non-responsive, non-carcinogenic, and carcinogenic concen-tration) and durations (7 and 90 days of exposure).
Other canonical pathways relevant to DNA damage that were associated with onlyin vitroresponses included ATM sig-naling, cell cycle: G2/M DNA damage checkpoint regulation, DNA damage-induced 14-3-3sigma signaling, DNA strand break repair by homologous recombination, DNA double-strand break repair by non-homologous end joining, mismatch repair in eukaryotes, and role of BRCA1 in DNA damage response (Supplementary Table 2). A canonical pathway enriched at day 8 was relevant to DNA damage in vivo, the nucleotide excision repair pathway (Table 4, Supplementary Table 2). This pathway consisted of eight genes showing increased expression associated with Cr(VI), all of which are also involved in general DNA transcription and cell cycle signal-ing: cyclin H (Ccnh), general transcription factor genes (Gtf2h1
Table 5.Phenotypic Evidence for Intestinal Transcriptomic Responses Found in Mice Exposed to SDD (520 mg SDD/l) Through Drinking Water
In VivoTranscriptomic Findings In VivoPhenotypic Evidence References
7 days of exposure
Increased signaling related to cell growth, proliferation and development
Cell proliferation observed through crypt epithelial hyperplasia in transverse duodenal H&Ebstained
sections
(Thompsonet al., 2011)
Cell proliferation observed through increased numbers of crypt enterocytes in Feulgen stained Swiss roll duo-denal sections
(Thompsonet al., 2015b)
Increased signaling related to cell stress and injury (including one pathway relevant to genotoxicity, nucleotide excision repair pathwaya)
Lack of genotoxicity observed through lack of crypt micronucleus induction in Feulgen stained transverse duodenal sections
(O’Brienet al., 2013)
Lack of genotoxicity observed through lack of crypt micronucleus induction in Feulgen stained Swiss roll duodenal sections
(Thompsonet al., 2015b)
Tissue dosimetry observed through XRFcmapping,
indi-cating chromium localized to the intestinal villi, and little (if any) in the crypt
(Thompsonet al., 2015b)
90 days of exposure
Increased signaling related to cell growth, prolifera-tion and development
Cell proliferation observed through crypt epithelial hyperplasia in transverse duodenal H&E stained sections
(Cullenet al., 2016;
Thompsonet al., 2011)
Cell proliferation observed through increased numbers of crypt enterocytes in Feulgen stained transverse duodenal sections
(O’Brienet al., 2013)
Cell proliferation observed through increased crypt length (mm) in Feulgen stained transverse duodenal sections
(Thompsonet al., 2015a)
No enrichment for DNA damage response pathways Lack of genotoxicity observed through lack of crypt micronucleus induction in Feulgen stained transverse duodenal sections
(O’Brienet al., 2013)
Tissue dosimetry observed through XRF mapping, indi-cating chromium localized to the intestinal villi, and little (if any) in the crypt
(Thompsonet al., 2015a)
Significant, robust changes in transcriptomic profiles are consistent with tissue dosimetry
Tissue dosimetry observed through mass spectrometry, indicating increased total chromium in the
duodenum
(Thompsonet al., 2011)
aThenucleotide excision repair pathway consisted of eight genes showing increased expression associated with Cr(VI), all of which are also involved in general DNA
transcription and cell cycle signaling: cyclin H (Ccnh), general transcription factor genes (Gtf2h1andGtf2h3), RNA polymerase II genes (Polr2e,Polr2f,Polr2h,Polr2l), and replication protein A3 (Rpa3).
and Gtf2h3), RNA polymerase II genes (Polr2e, Polr2f, Polr2h, Polr2l), and replication protein A3 (Rpa3). The increased expres-sion levels of these genes at day 8 is therefore consistent with the finding that proliferative responses and tissue remodeling is likely occurring in these tissues.
As TP53 alterations often occur post-translationally (Levine
et al., 2006), it was important to also consider the potential for TP53 changes resulting from Cr(VI) exposure at the protein level through transcription factor enrichment analysis. This upstream regulator prediction analysis provided further
evidence supporting TP53 as a likely transcriptional regulator of in vitroresponses (activationZ-score¼4.51,p¼3.921078for molecules identified by at least one study in CTD). However, TP53 was not within the list of 250 molecules predicted to potentially regulatein vivoresponses to Cr(VI) (Supplementary Table 7). These findings further support the lack of involvement of TP53 in intestinal cancer resulting from Cr(VI) oral exposure in mice.
DISCUSSION
This study informs the MOA underlying intestinal tumors induced by Cr(VI) in mice through the evaluation of HTS data, a large database of publishedin vitroresponses to Cr(VI) (ie, CTD), and toxicogenomics data from the intestine of mice exposed to Cr(VI). HTS data from the Tox21 consortium were determined to be generally consistent within vitroCr(VI) data in the open liter-ature, accumulated through CTD, exemplifying the utility of publicly available HTS data in identifyingin vitroresponses to chemicals. Analysis of these data showed that in vitro Cr(VI) exposure was associated with alterations in p53 signaling and cell death/proliferation signaling.In vivotranscriptomic data for Cr(VI), in contrast, were associated with changes in cell death/ proliferation, but not p53 signaling, in the small intestine. Consistent with earlier analyses of transcriptomic responses in the duodenum (Kopecet al.,2012a,b), this updated analysis sup-ports a non-mutagenic MOA for Cr(VI)-induced intestinal can-cer. Thesein vivo transcriptomic analyses are consistent with phenotypic anchoring: histopathological evidence of regenera-tive hyperplasia, lack ofin vivogenotoxicity, and relatively late onset of tumor formation.
Analyses from the present study found that transcriptomic responses in the mouse intestine showed enrichment for path-ways related to increased cell stress and injury, paralleling phe-notypic observations of intestinal villus atrophy and blunting in exposed mice (Cullenet al., 2016). Gene expression profiles were generally decreased for pathways involved in apoptosis and increased for pathways related to cell growth, proliferation, and development. These findings are supported by histopathology indicating increased crypt length in exposed mice (Thompson
et al., 2015a,b). Cancer signaling was also associated with the in vivo transcriptomic responses at day 8 and 91; however, exposed mice did not exhibit tumors until after at least one year of exposure to 30 ppm Cr(V) in drinking water (NTP, 2008). Increased cancer-related signaling at day 8 largely reflected increased expression of matrix metalloproteases, which are involved in functions that can overlap with carcinogenesis, including tissue remodeling, cell migration, immune cell recruitment, and angiogenesis (Klein and Bischoff, 2011). Specifically in the intestine, matrix metalloproteases have shown increased expression related to tissue remodeling in cases of gluten enteropathy (ie, celiac disease) (Ciccocioppo
et al., 2005;Salmelaet al., 2001), an intestinal disease with histo-pathological changes in common with Cr(VI) (eg, villus atrophy and crypt hyperplasia). These pathway changes are relevant to key events involved in Cr(VI) MOA and were estimated to start at median benchmark concentrations of 19 mg/l SDD [equiva-lent to 7 ppm Cr(VI)] after 7 days of exposure and 29 mg/l [equiv-alent to 11 ppm Cr(VI)] SDD after 90 days of exposure. To provide context for the BMD estimates, the average concentra-tion of Cr(VI) in U.S. drinking water is0.001 ppm, and the 95th upper percentile is 0.0034 ppm (U.S. EPA, 2014).
Recent examples of HTS applications in chemical assess-ments have involved the use ofin vitroHTS data to prioritize
chemical(s) for further toxicological evaluation (Auerbachet al., 2016;Rotroffet al., 2014). Some prioritization efforts have also considered the potential for human exposure, and thus show further applicability to the field of risk assessment (Rageret al., 2016;Wambaugh et al. 2014;Wetmoreet al., 2015). Fewer exam-ples are currently available showing HTS data interpretation in the context of regulatory decision making. Recent cancer mono-graphs published by the International Agency for Research on Cancer (IARC) represent examples of how HTS data could poten-tially contribute to the understanding of chemical mechanisms involved in human carcinogenicity, with specific emphasis on the TKCCs (IARC, 2015). Previousin vivocancer prediction mod-els using ToxCast HTS data have, however, shown limited pre-dictability (Anthonyet al., 2016;Thomaset al., 2012a), and it is therefore important to consider potential ranges of applicability and limitations ofin vitroHTS data interpretation.
The current study expanded on the application of HTS strat-egies by first organizing Tox21 data according to the TKCCs, and identifying KCCs that may be involved in mechanistic events linking Cr(VI) exposure to cancer. This method resulted in the identification of two KCCs, genotoxic (KCC#2) and alter cell pro-liferation, cell death and nutrient supply (KCC#10), that might have been prioritized for further evaluation in the context of Cr(VI) MOA. These two categories of molecular responses also represent key events under consideration in earlier MOA discus-sions for Cr(VI) (McCarroll et al., 2010;Thompsonet al., 2011). The research described herein revealed evidence primarily for KCC#10, consistent with a more recently proposed MOA for Cr(VI) (Thompsonet al., 2013), as well as risk assessments based on these data (Haney, 2015;Health Canada, 2015;TCEQ, 2016). This retrospective case study therefore demonstrates the poten-tial utility of HTS data in prioritizing key events for further eval-uation in chemical MOA, which in turn, after additional research, may impact chemical safety criteria and regulatory decision making.
A potential limitation in using HTS data to inform Cr(VI) MOA was evident after finding thatin vitroresponses were not entirely consistent within vivo responses in the mouse small intestine, a target tissue of Cr(VI) carcinogenesis. Specifically, analysis of Tox21 data identified four active assay endpoints for Cr(VI) in human intestinal cells relevant to p53 transcriptional activation, which were mapped to genotoxic (KCC#2). Other in vitrostudies identified through CTD corroborate the finding that p53 pathway alterations occur in response toin vitro expo-sure to Cr(VI), as evidenced through pathway-level and upstream regulator prediction analyses. However, analysis of in vivo transcriptomic responses in the mouse duodenum showed a clear lack of p53 pathway alterations and potential TP53 upstream regulator activity.
value. In support of these comparisons, specifically regarding TP53, both cancer and non-cancer cells have been shown to undergoin vitro Cr(VI)-associated DNA damage and eventual apoptosis dependent upon p53 activation and its upregulation of downstream targets (Russoet al., 2005). Therefore, the finding that Cr(VI) altered p53/DNA damage response signalingin vitro (with Tox21 data from cancer cells and CTD data from cancer and non-cancer cells) but notin vivo(with non-cancer cells) is informative towards HTS data interpretation in the context of in vivoMOA.
Other explanations for the differences betweenin vitro ver-susin vivoresponses include Cr(VI) kinetics, cell cycle, exposure durations (acute versus chronic), components within the media/surrounding fluid, and intracellular reductants. Regarding cell cycle,in vitroexposure systems typically evaluate effects in proliferating cells. In the mouse model, Cr(VI) was absorbed by mature, non-dividing cells in the intestinal villus (Thompson et al., 2015a,b). Regarding reduction kinetics, the intracellular ascorbate levels available to reduce Cr(VI) to Cr(III) may differin vitroversusin vivo.In vitroresponses to Cr(VI) differ depending on whether low cellular ascorbate levels are “restored” toin vivolevels (Luczaket al., 2016). Unrestored cells treated with Cr(VI) exhibit significant ATM activation possibly through glutathione (GSH)-mediated Cr(VI) reduction, whereas restored cells rely more on ascorbate-mediated reduction of Cr(VI) which does not appear to activate ATM (Luczak et al., 2016). Considering that rodents synthesize ascorbate, and that GSH levels and GSH synthesis pathways have been shown to be upregulated in the duodenum of mice treated with Cr(VI) for 90 days (Kopecet al., 2012a;Thompsonet al., 2011), both reduction pathways are likely active in the mouse. Importantly, p53 activ-ity is upregulatedin vitroin both Asc-restored and non-restored cells after Cr(VI) exposure (Luczaket al., 2016), which does not appear to occurin vivoin the duodenum based on the analyses herein. Moreover, the ATM signaling pathway was identified as altered through thein vitroanalysis but not within thein vivo transcriptomic responses. These aforementioned differences not only potentially explain the differential outcomes between in vitroandin vivodata, but are highly relevant for risk assess-ment, as thein vivomodel more closely recapitulates human dos-imetry and intestinal tissue structure and can thus inform MOA to a greater extent than HTS-based toxicity predictions alone.
In conclusion, this study provides an analysis of HTS and genomics-based data on a compound that is of high interest from the regulatory perspective. Emerging methods were used to evaluate the HTS data, including mapping of assays to TKCCs, incorporation of potential cytotoxicity interference, and comparison to other publicly availablein vitrodata to support findings. Comparingin vitroresponses toin vivotranscriptomic responses, similarities were identified between cell death/pro-liferation alterations occurring in response to Cr(VI). Differences in p53/DNA damage signaling pathway alterations were appa-rent, with p53 pathway changes occurringin vitrobut notin vivo. This example therefore demonstrates both the potential strengths and limitations of HTS data. Here, we retrospectively demonstrated that HTS data could be used to identify potential key events in chemical MOA that may be prioritized for further evaluation. Still, findings show that target tissuein vivo data remain a critical component for establishing the MOA for spe-cific chemical-induced tumor outcomes. Future studies compar-ingin vitroversusin vivoresponses induced by other chemicals with differing physicochemical properties and target tissues will further inform potential ranges of applicability for the util-ity of HTS in predictive toxicology.
SUPPLEMENTARY DATA
Supplementary data are available atToxicological Sciencesonline.
FUNDING
The Hexavalent Chromium Panel of the American Chemistry Council.
ACKNOWLEDGMENTS
The authors acknowledge Drs. Anna Kopec and Timothy Zacharewski for their original contributions to this study, including tissue processing, microarray hybridization and scanning. The authors also acknowledge Paige Bommarito for her contributions to the transcriptomics data analyses.
REFERENCES
Anthony, TCL., Popken, D. A., Kaplan, A. M., Plunkett, L. M., and Becker, R. A. (2016). How well can in vitro data predict in vivo effects of chemicals? Rodent carcinogenicity as a case study. Regul. Toxicol. Pharmacol.77, 54–64.
Auerbach, S., Filer, D., Reif, D., Walker, V., Holloway, A. C., Schlezinger, J., Srinivasan, S., Svoboda, D., Judson, R., Bucher, J. R., et al. (2016). Prioritizing environmental chemicals for obesity and diabetes outcomes research: A screening ap-proach using ToxCast high throughput data.Environ. Health Perspect.124, 1141–1154.
Bartman, C. M., Egelston, J., Kattula, S., Zeidner, L. C., D’Ippolito, A., Doble, B. W., and Phiel, C. J. (2014). Gene expression profil-ing in mouse embryonic stem cells reveals glycogen syn-thase kinase-dependent targets of phosphatidylinositol 3-kinase and Wnt/beta-catenin signaling pathways. Front. Endocrinol. (Lausanne)5, 133.
Bourdon-Lacombe, J. A., Moffat, I. D., Deveau, M., Husain, M., Auerbach, S., Krewski, D., Thomas, R. S., Bushel, P. R., Williams, A., and Yauk, C. L. (2015). Technical guide for appli-cations of gene expression profiling in human health risk as-sessment of environmental chemicals. Regul. Toxicol. Pharmacol.72, 292–309.
Ciccocioppo, R., Di Sabatino, A., Bauer, M., Della Riccia, D. N., Bizzini, F., Biagi, F., Cifone, M. G., Corazza, G. R., and Schuppan, D. (2005). Matrix metalloproteinase pattern in ce-liac duodenal mucosa.Lab. Invest.85, 397–407.
Comparative Toxicogenomics Database (CTD). (2016). MDI Biological Laboratory and NC State University. Available at: http://ctdbase.org/. Accessed July 21, 2016.
Cullen, J. M., Ward, J. M., and Thompson, C. M. (2016). Reevaluation and classification of duodenal lesions in B6C3F1 mice and F344 rats from 4 studies of hexavalent chro-mium in drinking water.Toxicol. Pathol.44, 279–289.
Davis, A. P., Grondin, C. J., Lennon-Hopkins, K., Saraceni-Richards, C., Sciaky, D., King, B. L., Wiegers, T. C., and Mattingly, C. J. (2015). The Comparative Toxicogenomics Database’s 10th year anniversary: Update 2015.Nucleic Acids Res.43, D914–D920.
Edgar, R., Domrachev, M., and Lash, A. E. (2002). Gene Expression Omnibus: NCBI gene expression and hybridization array data repository.Nucleic Acids Res.30, 207–210.
Farmahin, R., Williams, A., Kuo, B., Chepelev, N. L., Thomas, R. S., Barton-Maclaren, T. S., Curran, I. H., Nong, A., Wade, M. G., and Yauk, C. L. (2016). Recommended approaches in the ap-plication of toxicogenomics to derive points of departure for chemical risk assessment.Arch. Toxicol.91, 2045–2065. Fry, R. C. (2015).Systems Biology in Toxicology and Environmental
Health. New York: Academic Press.
Haney, J. Jr. (2015). Consideration of non-linear, non-threshold and threshold approaches for assessing the carcinogenicity of oral exposure to hexavalent chromium. Regul. Toxicol. Pharmacol.73, 834–852.
Health Canada. (2015). Chromium in Drinking Water: Document for Public Consultation. Federal-Provincial-Territorial Committee on Drinking Water. Available at: http://www. healthycanadians.gc.ca/health-system-systeme-sante/con sultations/chromium-chrome/document-eng.php. Accessed March 29, 2017.
IARC. (1990). Chromium, nickel and welding.IARC Monogr. Eval. Carcinog. Risks Hum.49, 1–648.
IARC. (2015). Volume 112. Some Organophosphate Insecticides and Herbicides: Diazinon, Glyphosate, Malathion, Parathion, and Tetrachlorvinphos. Annex 1. Supplementary Material to Volume 112. Available at: http://monographs.iarc.fr/ENG/ Monographs/Vol15801/index.php. Accessed May 23, 2016. Jackson, A. F., Williams, A., Recio, L., Waters, M. D., Lambert, I. B.,
and Yauk, C. L. (2014). Case study on the utility of hepatic global gene expression profiling in the risk assessment of the carcinogen furan.Toxicol. Appl. Pharmacol.274, 63–77. Judson, R., Houck, K., Martin, M., Richard, A. M., Knudsen, T. B.,
Shah, I., Little, S., Wambaugh, J., Woodrow Setzer, R., Kothya, P.,et al. (2016). Analysis of the effects of cell stress and cyto-toxicity on in vitro assay activity across a diverse chemical and assay space.Toxicol. Sci.153, 409.
Judson, R. S., Magpantay, F. M., Chickarmane, V., Haskell, C., Tania, N., Taylor, J., Xia, M., Huang, R., Rotroff, D. M., Filer, D. L.,et al. (2015). Integrated model of chemical perturbations of a biological pathway using 18 in vitro high-throughput screening assays for the estrogen receptor.Toxicol. Sci.148, 137–154.
Klein, T. and Bischoff, R. (2011). Physiology and pathophysiology of matrix metalloproteases.Amino Acids41, 271–290. Kopec, A. K., Kim, S., Forgacs, A. L., Zacharewski, T. R., Proctor, D.
M., Harris, M. A., Haws, L. C., and Thompson, C. M. (2012a). Genome-wide gene expression effects in B6C3F1 mouse in-testinal epithelia following 7 and 90days of exposure to hexa-valent chromium in drinking water.Toxicol. Appl. Pharmacol. 259,13–26.
Kopec, A. K., Thompson, C. M., Kim, S., Forgacs, A. L., and Zacharewski, T. R. (2012b). Comparative toxicogenomic analysis of oral Cr(VI) exposure effects in rat and mouse small intestinal epithelia. Toxicol. Appl. Pharmacol. 262, 124–138.
Kramer, A., Green, J., Pollard, J., Jr., and Tugendreich, S. (2014). Causal analysis approaches in ingenuity pathway analysis. Bioinformatics30, 523–530.
Levine, A. J., Feng, Z., Mak, T. W., You, H., and Jin, S. (2006). Coordination and communication between the p53 and IGF-1-AKT-TOR signal transduction pathways. Genes Dev. 20, 267–275.
Luczak, M. W., Green, S. E., and Zhitkovich, A. (2016). Different ATM signaling in response to chromium(VI) metabolism via ascorbate and nonascorbate reduction: Implications for in vi-tro models and toxicogenomics.Environ. Health Perspect.124, 61–66.
McCarroll, N., Keshava, N., Chen, J., Akerman, G., Kligerman, A., and Rinde, E. (2010). An evaluation of the mode of action framework for mutagenic carcinogens case study II: Chromium (VI).Environ. Mol. Mutagen.51, 89–111.
Moffat, I., Chepelev, N. L., Labib, S., Bourdon-Lacombe, J., Kuo, B., Buick, J. K., Lemieux, F., Williams, A., Halappanavar, S., Malik, A. I.,et al. (2015). Comparison of toxicogenomics and traditional approaches to inform mode of action and points of departure in human health risk assessment of benzo[a]-pyrene in drinking water.Crit. Rev. Toxicol.45, 1–43.
NCBI. (2016). PubMed (National Center for Biotechnology Information). Available at: http://www.ncbi.nlm.nih.gov/ pubmed. Accessed July 22, 2016.
NRC. (2007).Toxicity Testing in the 21st Century: A Vision and A Strategy. Washington, DC: National Research Council. NTP. (2007). National Toxicology Program technical report on the
toxicity studies of sodium dichromate dihydrate (CAS No. 7789-12-0) administered in drinking water to male and fe-male F344/N rats and B6C3F1 mice and fe-male BALB/c and am3-C57BL/6 mice.NTP Toxicity Report Series Number 72, NIH Publication No. 07-5964.
NTP. (2008). National Toxicology Program technical report on the toxicology and carcinogenesis studies of sodium dichromate dihydrate (CAS No. 7789-12-0) in F344/N rats and B6C3F1 mice (drinking water studies), NTP Toxicity Report Series Number 546. NIH Publication No. 08-5887.
O’Brien, T. J., Ding, H., Suh, M., Thompson, C. M., Parsons, B. L., Harris, M. A., Winkelman, W. A., Wolf, J. C., Hixon, J. G., Schwartz, A. M., et al. (2013). Assessment of K-Ras mutant frequency and micronucleus incidence in the mouse duode-num following 90-days of exposure to Cr(VI) in drinking wa-ter.Mutat. Res.754, 15–21.
OEHHA. (2011).Public Health Goal for Hexavalent Chromium (Cr VI) in Drinking Water. Sacramento, CA: Pesticide and Environmental Toxicology Branch, Office of Environmental Health Hazard Assessment, California Environmental Protection Agency.
Rager, J. E., Moeller, B. C., Miller, S. K., Kracko, D., Doyle-Eisele, M., Swenberg, J. A., and Fry, R. C. (2014). Formaldehyde-asso-ciated changes in microRNAs: Tissue and temporal specific-ity in the rat nose, white blood cells, and bone marrow. Toxicol. Sci.138, 36–46.
Rager, J. E., Strynar, M. J., Liang, S., McMahen, R. L., Richard, A. M., Grulke, C. M., Wambaugh, J. F., Isaacs, K. K., Judson, R., Williams, A. J., et al. (2016). Linking high resolution mass spectrometry data with exposure and toxicity forecasts to advance high-throughput environmental monitoring. Environ. Int.88, 269–280.
Richard, A. M., Judson, R. S., Houck, K. A., Grulke, C. M., Volarath, P., Thillainadarajah, I., Yang, C., Rathman, J., Martin, M. T., Wambaugh, J. F.,et al. (2016). ToxCast chemical landscape: Paving the road to 21st century toxicology.Chem. Res. Toxicol. 29, 1225–1251.
Rotroff, D. M., Martin, M. T., Dix, D. J., Filer, D. L., Houck, K. A., Knudsen, T. B., Sipes, N. S., Reif, D. M., Xia, M., Huang, R.,et al. (2014). Predictive endocrine testing in the 21st century using in vitro assays of estrogen receptor signaling responses. Environ. Sci. Technol.48, 8706–8716.
Russo, P., Catassi, A., Cesario, A., Imperatori, A., Rotolo, N., Fini, M., Granone, P., and Dominioni, L. (2005). Molecular mecha-nisms of hexavalent chromium-induced apoptosis in human bronchoalveolar cells.Am. J. Respir. Cell Mol. Biol.33, 589–600. Salmela, M. T., Pender, S. L., Reunala, T., MacDonald, T., and
metalloelastase (MMP-12) in duodenal and skin lesions of pa-tients with dermatitis herpetiformis.Gut48, 496–502. Smith, M. T., Guyton, K. Z., Gibbons, C. F., Fritz, J. M., Portier, C. J.,
Rusyn, I., DeMarini, D. M., Caldwell, J. C., Kavlock, R. J., Lambert, P. F.,et al. (2016). Key characteristics of carcinogens as a basis for organizing data on mechanisms of carcinogen-esis.Environ. Health Perspect.124, 713–721.
Storey, J. D. (2003). The positive false discovery rate: A Bayesian interpretation and the q-value.Ann. Stat.31, 2013–2035. TCEQ. (2016). Hexavalent Chromium Oral Reference Dose.
Development Support Document Proposed. CAS Registry Number: 18540-29-9. Austin, TX: TCEQ.
Thomas, R. S., Black, M. B., Li, L., Healy, E., Chu, T. M., Bao, W., Andersen, M. E., and Wolfinger, R. D. (2012a). A comprehen-sive statistical analysis of predicting in vivo hazard using high-throughput in vitro screening.Toxicol. Sci.128, 398–417. Thomas, R. S., Clewell, H. J., 3rd, Allen, B. C., Yang, L., Healy, E.,
and Andersen, M. E. (2012b). Integrating pathway-based tran-scriptomic data into quantitative chemical risk assessment: A five chemical case study.Mutat. Res.746, 135–143.
Thompson, C. M., Proctor, D. M., Haws, L. C., Hebert, C. D., Grimes, S. D., Shertzer, H. G., Kopec, A. K., Hixon, J. G., Zacharewski, T. R., and Harris, M. A. (2011). Investigation of the mode of action underlying the tumorigenic response in-duced in B6C3F1 mice exposed orally to hexavalent chro-mium.Toxicol. Sci.123, 58–70.
Thompson, C. M., Proctor, D. M., Suh, M., Haws, L. C., Hebert, C. D., Mann, J. F., Shertzer, H. G., Hixon, J. G., and Harris, M. A. (2012). Comparison of the effects of hexavalent chromium in the alimentary canal of F344 rats and B6C3F1 mice following exposure in drinking water: Implications for carcinogenic modes of action.Toxicol. Sci.125, 79–90.
Thompson, C. M., Proctor, D. M., Suh, M., Haws, L. C., Kirman, C. R., and Harris, M. A. (2013). Assessment of the mode of action underlying development of rodent small intestinal tumors following oral exposure to hexavalent chromium and rele-vance to humans.Crit. Rev. Toxicol.43, 244–274.
Thompson, C. M., Rager, J. E., Suh, M., Ring, C. L., Proctor, D. M., Haws, L. C., Fry, R. C., and Harris, M. A. (2016). Transcriptomic responses in the oral cavity of F344 rats and B6C3F1 mice fol-lowing exposure to Cr(VI): Implications for risk assessment. Environ. Mol. Mutagen.57, 706–716.
Thompson, C. M., Seiter, J., Chappell, M. A., Tappero, R. V., Proctor, D. M., Suh, M., Wolf, J. C., Haws, L. C., Vitale, R., Mittal, L.,et al. (2015a). Synchrotron-based imaging of chro-mium and gamma-H2AX immunostaining in the duodenum following repeated exposure to Cr(VI) in drinking water. Toxicol. Sci.143, 16–25.
Thompson, C. M., Wolf, J. C., Elbekai, R. H., Paranjpe, M. G., Seiter, J. M., Chappell, M. A., Tappero, R. V., Suh, M., Proctor, D. M., Bichteler, A.,et al. (2015b). Duodenal crypt health following exposure to Cr(VI): Micronucleus scoring, gamma-H2AX immunostaining, and synchrotron X-ray fluorescence mi-croscopy.Mutat. Res. Genet. Toxicol. Environ. Mutagen.789–790, 61–66.
Thompson, C. M., Young, R. R., Suh, M., Dinesdurage, H. R., Elbekai, R. H., Harris, M. A., Rohr, A. C., and Proctor, D. M. (2015c). Assessment of the mutagenic potential of Cr(VI) in the oral mucosa of Big BlueVR
transgenic F344 rats.Environ. Mol. Mutagen.56, 621–628.
U.S. EPA. (2010). Toxicological review of hexavalent chromium in support of summary information on the integrated risk infor-mation system (IRIS). External Review DRAFT. Washington, DC: U.S. Environmental Protection Agency.
U.S. EPA (2014). The Third Unregulated Contaminant Monitoring Rule (UCMR3): Occurrence Data. Washington, DC: U.S. Environmental Protection Agency.
U.S. EPA (2015). ToxCast & Tox21 Summary Files from invi-trodb_v2. Available at: https://www.epa.gov/chemical-re search/toxicity-forecaster-toxcasttm-data. Accessed November 2015.
Wambaugh, J. F., Wang, A., Dionisio, K. L., Frame, A., Egeghy, P., Judson, R., Setzer, and R. W. (2014). High throughput heuris-tics for prioritizing human exposure to environmental chem-icals.Environ Sci Technol.48(21), 12760–12767.
Wetmore, B. A., Wambaugh, J. F., Allen, B., Ferguson, S. S., Sochaski, M. A., Setzer, R. W., Houck, K. A., Strope, C. L., Cantwell, K., Judson, R. S.,et al. (2015). Incorporating high-throughput exposure predictions with dosimetry-adjusted in vitro bioactivity to inform chemical toxicity testing. Toxicol. Sci.148, 121–136.