EVALUATION OF THE PERFORMANCE OF THE HIGH-DIMENSIONAL
PROPENSITY SCORE ALGORITHM TO ADJUST FOR CONFOUNDING OF
TREATMENT EFFECTS ESTIMATED IN HEALTHCARE CLAIMS DATA
Hoa Van Le, MD
A dissertation submitted to the faculty of the University of North Carolina at Chapel Hill in partial fulfillment of the requirements for the degree of Doctor of Philosophy in the Department of
Epidemiology in the Gillings School of Global Public Health.
Chapel Hill 2012
Approved by:
ii
iii ABSTRACT
HOA VAN LE: Evaluation of the Performance of the High-Dimensional Propensity Score Algorithm to Adjust for Confounding of Treatment Effects Estimated in Healthcare Claims Data
(Under the direction of Professor Til Stürmer)
The aim of the high-dimensional propensity score (hd-PS) algorithm is to select and adjust for baseline confounders in pharmacoepidemiologic studies based on healthcare claims data. It is not well understood how the performance of the hd-PS is affected by 1) the channelling of drugs at specific calendar time periods and differences in administrative claims databases; 2) low outcome incidence or exposure prevalence in medium sized or large cohorts; and 3) aggregation of medical diagnoses and medications in cohorts with small size, low outcome incidence and low exposure prevalence.
We estimated risk ratios for upper gastrointestinal complication in patients with rheumatoid arthritis or osteoarthritis after initiating oral celecoxib versus ibuprofen or diclofenac in two large longitudinal healthcare claims databases. We conducted separate analyses for subcohorts before and after withdrawal of rofecoxib, a drug in the same class as celecoxib. We applied the hd-PS algorithm using a combination of demographic, predefined and hd-PS covariates with either PS deciles or 1:1 greedy matching for each cohort. In addition, we conducted pooled analyses for two combined databases stratified by data source and adjusted by either deciles of separate PSs or 1:1 greedy matching within the data source. The different methods of propensity score confounder selection inconsistently reduced confounding by indication across calendar time periods and administrative data sources.
iv
v
ACKNOWLEDGEMENTS
I am greatly indebted to Dr. Til Stürmer and Dr. Victor J. Schoenbach for their tremendous advice and support, and great patience specifically during the dissertation process and study period at UNC.
I would like to express my gratitude to the members of my dissertation committee: Dr.Charles Poole, Dr. M. Alan Brookhart and Dr. Kathleen J. Beach for their many invaluable comments and advice.
I would like to thank to all of my dear teachers, classmates, friends, and colleagues at UNC and GSK for their wonderful support.
I would like to acknowledge the Vietnam Education Foundation, UNC Department of Epidemiology, GlaxoSmithKline, Harry Guess-Merck Scholarship, UNC Graduate School and International Society for Pharmacoepidemiology for financial support.
vi
TABLE OF CONTENTS
LIST OF TABLES ... viii
LIST OF FIGURES ... x
LIST OF ABBREVIATIONS ... xi
Chapter I. STATEMENT OF SPECIFIC AIMS ... 1
II. LITERATURE REVIEW ... 5
A. BACKGROUND ... 5
B. FACTORS AFFECTING PERFORMANCE OF THE HIGH-DIMENSIONAL PROPENSITY SCORE ALGORITHM ... 9
C. MEDICAL CODING AND AGGREGATIONS ... 12
D. SUMMARY ... 15
III. METHODS ... 17
A. DATA SOURCES ... 17
B. METHODS COMMON TO THREE SPECIFIC AIMS ... 18
C. METHODS FOR SPECIFIC AIM 1 ... 21
D. METHODS FOR SPECIFIC AIM 2 ... 21
D. METHODS FOR SPECIFIC AIM 3 ... 23
IV. RESULTS: COMPARATIVE GASTRO-INTESTINAL RISK OF NONSTEROIDAL ANTI-INFLAMMATORY DRUG CLASSES: A CAUTIONERY TALE ABOUT “AUTOMATED” PHARMACOEPIDEMIOLOGY ... 25
A. INTRODUCTION ... 25
B. METHODS ... 26
C. RESULTS... 29
vii
V. RESULTS: EFFECTS OF AGGREGATION OF MEDICAL CODES ON THE
PERFORMANCE OF THE HIGH-DIMENSIONAL PROPENSITY SCORE ALGORITHM ... 46
A. INTRODUCTION ... 46
B. METHODS ... 47
C. RESULTS... 52
D. DISCUSSION ... 58
VI. DISCUSSION ... 64
A. SUMMARY OF FINDINGS ... 64
B. PUBLIC HEALTH IMPLICATIONS ... 66
C. STRENGTHS ... 68
D. LIMITATIONS ... 69
E. FUTURE RESEARCH ... 70
F. CONCLUSIONS ... 71
APPENDICES ... 72
APPENDIX A. THE CLINICAL CLASSIFICATION SOFTWARE ... 72
APPENDIX B. SIMULATION RESULTS OF OUTCOME AND EXPOSURE SAMPLINGS .... 73
viii
LIST OF TABLES
Table 4.1. Characteristics of initiators of celecoxib or NSAIDs (ibuprofen or diclofenac) in cohorts 18-65 years old, before and after 1:1 greedy matching based on automated hd-PS covariates, from MarketScan database: age at the date of the first medication use and comorbidities/ use of medications as defined
during six months prior to the first study medication use ... ... 31 Table 4.2. Characteristics of initiators of celecoxib or NSAIDs (ibuprofen or diclofenac)
in cohorts 18-65 years old, before and after 1:1 greedy matching based on automated hd-PS covariates, from Optum database: age at the date of the first medication use and comorbidities/ use of medications as defined
during six months prior to the first study medication use ... 32 Table 4.3. Characteristics of initiators of celecoxib or NSAIDs (ibuprofen or diclofenac)
in cohorts 18-65 years old, before and after 1:1 greedy matching based on automated hd-PS covariates, from MarketScan and Optum databases: age at the date of the first medication use and comorbidities/ use of medications
as defined during six months prior to the first study medication use ... 33 Table 4.4. Risk ratios for the upper gastrointestinal complication within 60 days after
the study drug initiation for the cohorts from the two healthcare claims databases MarketScan and Optum by using the three selection strategies
for confounders and PS deciles or 1:1 greedy matching ... 35 Table 5.1. Characteristics of Initiators of celecoxib or NSAIDs (ibuprofen or diclofenac)
in a cohort 18-65 years old between 1 July 2003 and 30 September 2004 of MarketScan database: age at the date of the first medication use and comorbidities/ use of medications as defined during six months prior to the
first medication use ... 53 Table 5.2. Geometric mean of risk ratios and summary analysis for different cohort
size, outcome incidence and exposure prevalence of initiators of celecoxib or NSAIDs (ibuprofen or diclofenac) in a cohort 18-65 years old between 1
July 2003 and 30 September 2004 of MarketScan database ... 54 Table 5.3. Geometric mean of risk ratios for different cohort size, outcome incidence
and exposure prevalence of initiators of celecoxib or NSAIDs (ibuprofen or diclofenac) in a cohort 18-65 years old between 1 July 2003 and 30 September 2004 of MarketScan database by using the High-Dimensional
Propensity Score (hd-PS) adjustment with different aggregation method ... 55 Table 5.4. Changes of prevalences, covariate-exposure and covariate-outcome
relations when we aggregated potential confounders, ICD-9 codes 53011 (reflux esophagitis) and 53081 (esophageal reflux) from 5-digit ICD-9 into 4-, 3-digit ICD-94-, and levels 44-, 34-, 2 and 1 of the Clinical Classification
Software (CCS) ... 62 Table 5.5. Changes of prevalences, covariate-exposure and covariate-outcome
relations when we aggregated potential confounders, clopidrogel and warfarin from level 5 to levels 4, 3, 2 and 1 of the Anatomical Therapeutic
ix
Table B.1. Simulation results of outcome sampling with recoded cases: constant
adjusted treatment effect estimates and cohort sizes ... 73 Table B.2. Simulation results of exposure sampling with replacement of unexposed:
x
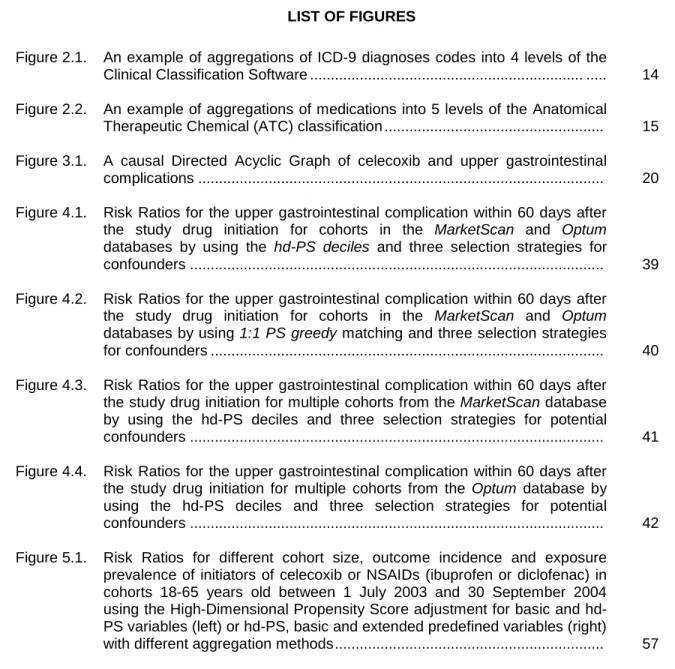
LIST OF FIGURES
Figure 2.1. An example of aggregations of ICD-9 diagnoses codes into 4 levels of the
Clinical Classification Software ... ... 14 Figure 2.2. An example of aggregations of medications into 5 levels of the Anatomical
Therapeutic Chemical (ATC) classification ... 15 Figure 3.1. A causal Directed Acyclic Graph of celecoxib and upper gastrointestinal
complications ... 20 Figure 4.1. Risk Ratios for the upper gastrointestinal complication within 60 days after
the study drug initiation for cohorts in the MarketScan and Optum databases by using the hd-PS deciles and three selection strategies for
confounders ... 39 Figure 4.2. Risk Ratios for the upper gastrointestinal complication within 60 days after
the study drug initiation for cohorts in the MarketScan and Optum databases by using 1:1 PS greedy matching and three selection strategies
for confounders ... 40 Figure 4.3. Risk Ratios for the upper gastrointestinal complication within 60 days after
the study drug initiation for multiple cohorts from the MarketScan database by using the hd-PS deciles and three selection strategies for potential
confounders ... 41 Figure 4.4. Risk Ratios for the upper gastrointestinal complication within 60 days after
the study drug initiation for multiple cohorts from the Optum database by using the hd-PS deciles and three selection strategies for potential
confounders ... 42 Figure 5.1. Risk Ratios for different cohort size, outcome incidence and exposure
prevalence of initiators of celecoxib or NSAIDs (ibuprofen or diclofenac) in cohorts 18-65 years old between 1 July 2003 and 30 September 2004 using the High-Dimensional Propensity Score adjustment for basic and hd-PS variables (left) or hd-hd-PS, basic and extended predefined variables (right)
xi
LIST OF ABBREVIATIONS
AHRQ Agency for Healthcare Research and Quality
ATC Anatomical Therapeutic Chemical (ATC) classification CLASS Celecoxib Long-term Safety Study
CCS Clinical Classifications Software EHR Electronic Health Records
GPRD General Practice Research Database hd-PS High-Dimensional Propensity Score
HIPAA Health Insurance Portability and Accountability Act
HR Hazard Ratio
ICD-9 International Statistical Classification of Diseases 9th version IRR Incidence Rate Ratio
NSAIDs Nonsteroidal Anti-inflammatory Drugs
tNSAIDs Traditional Nonsteroidal Anti-inflammatory Drugs
OA Osteoarthritis
OR Odds Ratio
PS Propensity Score
RA Rheumatoid Arthritis
RCT Randomized Controlled Trial
RR Risk Ratio
UGI Upper Gastrointestinal
SNOMED CT Systematized Nomenclature of Medicine-Clinical Terms
CHAPTER I
STATEMENT OF SPECIFIC AIMS
Although early detection and assessment of drug safety signals is important [1-3], post-marketing drug safety studies often face challenges such as small size, rare incidence of adverse outcomes, or low exposure prevalence after a new drug launch. In addition, active surveillance will often generate a large number of safety signals, which emphasizes the need for a method that can rapidly, yet systematically, refine a signal. Large healthcare claims databases are important sources for active surveillance. However, there is potential channelling bias of drugs, different patients, different providers, healthcare plans, and payers over time in disparate administrative healthcare databases.
2
healthcare claims data. However, it is not known whether different calendar time periods, data sources, low outcome incidence or exposure prevalence can degrade hd-PS performance in medium sized or large cohorts. Also, no study to date has assessed how hd-PS performance is affected by aggregating medical diagnoses and/or medications, especially in cohorts with relatively few patients, rare outcome incidence, or low exposure prevalence. Extensive testing of the performance of hd-PS should be carried out in multiple settings to provide more confidence and to determine the value of this new approach.
This dissertation addresses the following questions:
1) How do different calendar time periods or administrative data sources affect the performance of the hd-PS?
2) How does low outcome incidence or exposure prevalence degrade hd-PS performance in medium sized or large cohorts?
3) How does aggregating medical diagnoses and/or medications affect the hd-PS performance, especially in cohorts with relatively few patients, rare outcome incidence, or low exposure prevalence?
To answer these questions, the following specific aims are addressed in this research:
Specific aim 1: To evaluate the performance of the hd-PS algorithm to adjust for confounding of
treatment effects in cohorts with different calendar time periods and administrative data sources.
3
upper gastrointestinal (UGI) risk on preferential prescribing of coxibs would increase (increased confounding by indication). The channelling of celecoxib at different calendar time periods, or differences in administrative claims databases will affect the hd-PS performance.
Rationale for specific aim 1: As an automated procedure, the hd-PS does not have options for users to consider specific subtleties of the data. These might include, but are not restricted to, expected changes in the channelling of drugs at specific calendar time points (e.g., due to publication of landmark trials, black box warnings, ‘Dear Doctor’ letters, marketing activities by drug makers, new guidelines or policies, etc.) [25], differences in study periods, and differences in database sources. However, it is not known whether the hd-PS performs well in these situations. An assessment of the hd-PS performance may provide insight into a guidance of using hd-PS for different calendar time periods and disparate data sources.
Specific aim 2: To determine how low outcome incidence or exposure prevalence can degrade
hd-PS performance in medium sized or large cohorts.
Hypothesis for specific aim 2: The performance of the hd-PS will degrade not only in cohorts with small size, but also in cohorts with low outcome incidence or infrequent exposure prevalence.
4
Specific aim 3: To evaluate the effects of aggregating medical diagnoses and/or medications on the
hd-PS performance, especially in cohorts with relatively few patients, rare outcome incidence, or low exposure prevalence.
Hypothesis for specific aim 3: Aggregation may improve control of confounding, by increasing the prevalence of rare baseline potential confounders so they would be included in the hd-PS, or may worsen control of confounding, by increasing the amount of information bias in control variables.
CHAPTER II
LITERATURE REVIEW
A. BACKGROUND
Significance of the High-Dimensional Propensity Score algorithm
As the passive drug safety surveillance system has well-recognized drawbacks [27-30], active safety surveillance such as the Sentinel System, a part of the Food and Drug Administration’s Sentinel Initiative, using patient information derived from health insurance claims data [31] is one of the basic methods of signal detection that should be developed [32-34]. However, the active surveillance will most likely generate a large number of safety signals, which emphasizes the need for an approach that can earlier [1-3, 35,36] and more rapidly, yet systematically, refine a signal [36-39]. One approach might be to automate the assessment of the relation between a drug exposure and a medical condition with an ability to conduct evaluations in disparate electronic healthcare claims or medical record databases [40,41].The hd-PS with an automated process for adjustment of a large number of candidate covariates for propensity score model could significantly contribute to the early refinement of drug safety signals [13].
Proxy adjustment for patient health status in longitudinal health claims data
6
and outcomes in pharmacoepidemiologic studies. Chains of proxies might be surrogates for access to care [42], condition severity, physician ability, drug preference [43] or medication co-payment ability [43]. Seeger et al. proposed that health care claims may serve as proxies, in hard-to-predict ways, for important unmeasured variables [45]. Following this general idea of controlling for a wide variety of covariates many of which would not be readily seen as confounders outside of studies based on healthcare claims data, Stürmer et al. used propensity score models with over 70 variables representing medical codes present during a baseline period [5].Johannes et al. created a propensity score model that considered as candidate variables the 100 most frequently occurring diagnoses, procedures, and outpatient medications in healthcare claims [46].
Variable selection for propensity score model
7
avoiding the inclusion of instrumental variables [11,56], variables affected by the treatment (or the outcome), and colliders in M-structures [12].
The high dimensional propensity score algorithm
A recently-developed strategy for selecting from a large pool of baseline covariates for propensity score analyses is the use of a computer-applied algorithm [13,57], such as the High-Dimensional Propensity Score (hd-PS) algorithm. The hd-PS automatically defines and selects variables for inclusion in the propensity score to adjust treatment effect estimates in studies using healthcare claims data [13,14]. The hd-PS macro [13] is a multi-step algorithm to implement proxy adjustment in claims data. The macro’s steps include:
1) identify data dimensions: the hd-PS uses the health service records of patients e.g., 5 common data dimensions: pharmacy claims, outpatient diagnoses, outpatient procedures, inpatient diagnoses, and inpatient procedures;
2) identify candidate covariates: because the prevalence of a binary factor is symmetrical around 0.5, the hd-PS subtracts all prevalence estimates larger than 0.5 from 1.0. In addition to basic variables e.g. age, gender, race, and calendar time, the hd-PS identifies most prevalent covariates from each data dimension (e.g., top n=200);
3) assess recurrence of same code: each code is assessed for within-patient occurrence during a predefined period (e.g., 6 months) and divided into three binary variables: once, sporadic ≥
median number of times, or frequent ≥ 75th percentile number of times. A code would have a “true” value for all three recurrence variables if it occurred above the 75th percentile number of times. If any of the values were equal, the hd-PS dropped the variable with the higher cutpoint;
8
group or unexposed group is zero or 1. The covariate-outcome association is missing when the prevalence of covariate in cases or noncases is zero or 1. The hd-PS also drops covariate if the natural log of its multiplicative bias is missing. For example, covariates with missing covariate-outcome or covariate-exposure associations, with the same symmetric prevalence in exposed and unexposed group, are dropped because they lead the confounding effect equal the null or undefined when we insert them into the Bross formula [13, 26]. Remained variables from data dimensions are prioritized by their potential for confounding control based on the symmetric prevalence of each covariate in the treated and untreated and the bivariate association of the covariate with the study outcome based on absolute value of natural log of multiplicative bias derived by Bross formula after adjusting for demographic covariates [13, 26].
5) select covariates for adjustment: by default, the top k=500 indicator variables from step 4 are selected in addition to age, gender, race and calendar year;
6) estimate exposure propensity score: a propensity score is estimated for each subject as a predicted probability of exposure conditional on all covariates at step 5 using multivariate logistic regression;
7) estimate propensity score-adjusted outcome models: the algorithm groups subjects into propensity score deciles and uses multivariate regression analyses to model the study outcome as a function of exposure and indicator terms for propensity score deciles.
9
The hd-PS algorithm could reduce programming time and error, and run in studies pooling multiple claims databases [13,14]. Prior studies demonstrated the hd-PS was potential algorithm software for active drug safety monitoring systems using longitudinal healthcare claims databases [14]. However, extensive testing of the performance of hd-PS should be carried out in multiple settings to provide more confidence and to determine the value of this new approach. Moreover, any solutions to improve the hd-PS performance particularly in specific settings will contribute to the research community for active drug safety surveillance.
B. FACTORS AFFECTING PERFORMANCE OF HIGH-DIMENSIONAL PROPENSITY SCORE ALGORITHM
Changes of channelling bias and calendar time periods
Channeling bias (here defined as confounding by indication) is a serious threat to the validity of nonexperimental studies of treatment effects [58,59]. Walker et al. defines confounding by indication as a resul of differential selection of patients into drug exposure groups [60]. Schneeweiss
et al. reported patient-, provider-, and system-related factors caused potential bias due to channeling of patients to the newly marketed medication [58]. Factors influencing the prescription of drugs by physicians can vary by physician, change over time [61], and are often based on patients’ characteristics, diagnoses, prognoses, and behaviors. These factors are usually not directly recorded in administrative databases [58,59]. A failure to adjust for imbalanced factors that are predictors of the
outcome of interest leads to biased results. Publications raised the importance of the channeling bias,
especially for new drugs after market launch [58]. There is still a lack of guidance on how to deal with
this challenge. It is unknown if strategies exist to separate which of these factors are potential
confounders or instrumental variables [59].
10
etc.) [25,52], and differences in study periods and administrative healthcare databases. Prior research studies demonstrated the challenges of channelling bias in nonrandomized studies, but no studies addressed how the changes of channelling bias due to the withdrawal of a drug in the same class can affect hd-PS performance.
Different data sources and pooled analyses
There has been increased interest in using automated healthcare claims databases as a useful data source for researchers and regulatory agencies to study the safety of drugs, particularly
for rare outcomes in post-marketing studies. The administrative data have some advantages e.g.,
longitudinal data, accuracy in recording the date of dispensing and less biased by knowledge of the
study outcome, representativeness of routine clinical practice in large populations. However, these
data were generated primarily for administrative purposes and have disadvantages. The claims databases do not completely capture all of a patients’ medical history (e.g., incomplete capture of healthcare or treatments provided outside of health plan coverage, alcohol use, inpatient drugs, over-the-counter medications, medications that cost less than co-payments, dispensed medication less than consumed medication). Many factors are involved in the data generation process and in the creation of quality for a specific database. These factors include coding errors, under-reporting of secondary diagnoses, changes in hardware, software, or coding practice over time, and mergers of
healthcare plans leading to doubling/sharing patient identification. Each database has its own
“specific way” to generate data, and this is often undocumented or not updated [59]. Hennessy et al.
reported that descriptive analyses of the population composition over time can help one determine
the integrity of linked administrative databases [62]. The literature often compared characteristics of
electronic medical records and claims databases. Each claims database is often promoted with its
own features and benefits. There is little information to directly compare the quality of “similar” of
claims databases.
Pharmacoepidemiologic studies usually need large databases pooled from many
11
outcome [1-4]. Recently, Rassen et al. developed a novel method of pooled analyses to use hd-PS
which delivered similar point estimates for multi-center studies [63]. The PS-based pooling method [63] using separate propensity scores estimated from each data source, showed some benefits for the study of the same drug-outcome pair in multiple databases. The pooled analyses were stratified by the center and adjusted by deciles of separate PSs [63] where the PS distribution without trimming of the non-overlap region to create separate PS deciles for which each data source cohort was employed [63]. In addition to pooled analyses using deciles of separate PSs, the pooled analyses can be carried in the matched cohorts after 1:1 PS greedy matching [64] starting at the eighth decimal place [63] and continued to the first within the study center.
Prior research studied the performance of the hd-PS algorithm with established drug-outcomes in US healthcare claims and UK electronic medical record databases [13,15,16]. There are two large longitudinal administrative US databases: MarketScan® commercial claims and encounters of Thomson Reuters healthcare [65] and Optum® Impact® National Managed Care Benchmark Database [66]. MarketScan is a longitudinal 10-year healthcare claims database which captures patient demographics, inpatient and outpatient diagnoses and procedures, and medications from a selection of large private employers, health plans, government agencies and other public organizations. Optum is a longitudinal medical claims history for more than 98 million individuals. The Optum data come from more than 46 health plans in the US with available information: patient demographics such as age and gender, diagnoses, procedures, and medications recorded during outpatient visits and hospital admissions. These two large healthcare claims databases are potential candidates to evaluate the performance of the hd-PS where proxies for the health state of patients are present in the longitudinal health claims data through drug dispensing, medical diagnosis and procedure. The chains of proxies can be surrogates for access to care [42] condition severity, physician ability, drug preference [43] or medication co-payment ability [44]. There was no study to evaluate how the different data sources can affect the hd-PS performance.
12
with propensity score deciles and greedy matching could be observed in studies using two claims data sources, particularly in pre and post-withdrawal subcohorts with potential changes of channelling bias due to rofecoxib withdrawal.
Small samples, rare outcome incidence and low exposure prevalence
Because early detection and assessment of drug safety signals is very important [1-3,37] there is a possible delay if the hd-PS can perform in a large sample size only. The hd-PS algorithm prioritizes variables by their potential for confounding control based on their prevalence and on bivariate associations of each covariate with the treatment and with the study outcome [13,26]. Rassen et al. reported that hd-PS functioned well in small cohorts with >50 exposed patients with an outcome event; and using zero-cell correction or exposure-based covariate selection permitted hd-PS to function robustly with 25–50 exposed patients with an outcome event and to yield estimates closer to estimates obtained in the full cohort [17]. The prior study concluded that few exposed events and few exposed subjects affected the performance of the hd-PS in small samples. In reality, few exposed events will tend to be the norm after a new drug is launched to the market (low exposure prevalence) or due to rare events (low outcome incidence). There is no study so far that has evaluated how few exposed events or few exposed subjects can affect performance of the hd-PS in medium sized and large samples.
The hd-PS algorithm prioritizes variables by their potential for confounding control based on their prevalence and on bivariate associations of each covariate with the treatment and with the study outcome [13,26]. In cohorts with either lower outcome incidence or exposure prevalence, there will be a larger number of baseline potential confounders (e.g., those with low prevalence, missing covariate-exposure association, zero/undefined covariate-outcome association) not meeting hd-PS inclusion criteria.
C. MEDICAL CODING AND AGGREGATIONS
13
its hierarchical relationships [67], but the Clinical Classification Software (CCS) developed by the Agency for Healthcare Research and Quality (AHRQ) can be used to group diagnoses into clinically meaningful categories [68]. Similarly, medications can be grouped into levels of the Anatomical Therapeutic Chemical (ATC) classification [69].
Clinical Classification Software (CCS)
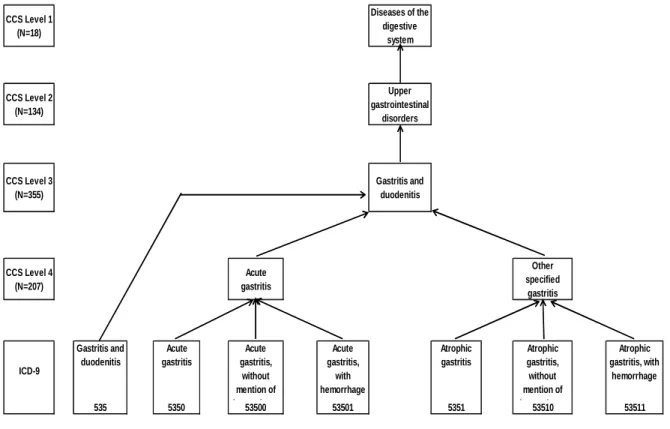
14
Figure 2.1. An example of aggregations of ICD-9 diagnosis codes into 4 levels of the Clinical Classification Software
Anatomical Therapeutic Chemical (ATC) classification
The Anatomical Therapeutic Chemical (ATC) classification of the World Health Organization (WHO) [69] classifies active substances into different groups based on their target organ or system and their therapeutic, pharmacological and chemical properties. Drugs are classified into fourteen main groups (1st level) with pharmacological or therapeutic subgroups (2nd level). The 3rd and 4th levels are chemical, pharmacological or therapeutic subgroups, and the 5th level is the chemical substance. Several ATC groups are subdivided into both chemical and pharmacological groups. The pharmacological group is often chosen if a new substance fits in both a chemical and pharmacological 4th level. Substances in the same 4th ATC level are not pharmacotherapeutically equivalent, as they may have different modes of action, therapeutic effects, drug interactions and adverse drug reaction profiles. New 4th levels are commonly established if at least two approved substances fit in the group. A new substance not clearly belonging to any existing group of related
CCS Level 1 (N=18)
Diseases of the digestive
system
CCS Level 2 (N=134)
Upper gastrointestinal
disorders
CCS Level 3 (N=355)
Gastritis and duodenitis
CCS Level 4 (N=207) Acute gastritis Other specified gastritis ICD-9 Gastritis and duodenitis Acute gastritis Acute gastritis, without mention of hemorrhage Acute gastritis, with hemorrhage Atrophic gastritis Atrophic gastritis, without mention of hemorrhage Atrophic gastritis, with hemorrhage
15
substances of ATC 4th level will often be placed in an X group ("other" group) [69]. An example of aggregations of medications into ATC levels is in Figure 2.2.
Figure 2.2. An example of aggregations of medications into 5 levels of the Anatomical Therapeutic Chemical (ATC) classification
In general, aggregation of potential covariates into higher-level categories increases the number of covariates that are present in at least 100 observations, the default requirement of the hd-PS, and increases the prevalence of the covariate in exposed and unexposed groups, which increases the covariate’s prioritization from the Bross formula if it is associated with treatment [13,26]. But aggregation may simultaneously weaken covariate-exposure and/or covariate-outcome relations, reducing prioritization in the Bross formula. The latter also has the potential to change the impact of control for the aggregated covariate on the adjusted risk ratios. No study to date has assessed how the hd-PS performance is affected by aggregating medical diagnoses and/or medications, especially in cohorts with relatively few patients, rare outcome incidence, or low exposure prevalence.
D. SUMMARY
The hd-PS is a potential algorithm for active drug safety monitoring systems using longitudinal healthcare databases. Prior studies showed that the hd-PS leads to confounding control
ATC Level 1 (N=14)
BLOOD AND BLOOD FORMING ORGANS
ATC Level 2 (N=94)
ANTITHROMBOTIC AGENTS
ATC Level 3 (N=365)
ANTITHROMBOTIC AGENTS
ATC Level 4 (N=855)
PLATELET AGGREGATION
INHIBITORS EXCLUDING HEPARIN
VITAMIN K ANTAGONISTS
ATC Level 5 CLOPIDOGREL TICLOPIDINE DIPYRIDAMOLE WARFARIN
16
that is as least as good as the one obtained by adjustment limited to covariates predefined by expert knowledge [13,15,16]. It could reduce programming time and error, and run in studies pooling multiple claims databases [13,14]. The hd-PS performance has been evaluated with few outcome events or few exposed subjects in small cohorts only [17]. There was a lack of the literature on the potential factors influencing the hd-PS performance.
CHAPTER III
METHODS
This research assesses the factors which can affect the performance of the hd-PS algorithm to adjust confounding for treatments effects using claims databases: different calendar time periods and administrative data sources (Specific aim 1); low outcome incidence or exposure prevalence in medium sized or large cohorts (Specific aim 2); and aggregating medical diagnoses and/or medications, especially in cohorts with relatively few patients, rare outcome incidence, or low exposure prevalence (Specific aim 3). The methods that are common to the three specific aims components will be described, followed by the methods specific to each specific aim. We use a retrospective cohort of upper gastrointestinal (GI) complications with celecoxib versus nonsteroidal anti-inflammatory drugs (NSAIDs) for osteoarthritis (OA) and rheumatoid arthritis (RA) as an example for assessment of the performance of the hd-PS in the cohorts with multiple settings since the upper GI complication treatment effect of COX-2 versus NSAIDs is well established based on several Randomized Controlled Trials (RCT) [18-23]. We therefore assume that a treatment effect estimate closer to 0.5 is less biased by confounding. The current study was exempted by the Institutional Review Board of University of North Carolina at Chapel Hill.
A. DATA SOURCES
18
patient demographics, inpatient and outpatient diagnoses and procedures, and medications from a selection of large private employers, health plans, government agencies and other public organizations. Optum is a longitudinal medical claims history for more than 98 million individuals. The Optum data come from more than 46 health plans in the US with available information: patient demographics such as age and gender, diagnoses, procedures, and medications recorded during outpatient visits and hospital admissions.
During the research process, we encountered the issue of incomplete inpatient diagnoses and procedures for years 1999-2002 of the Optum® Impact® National Managed Care Benchmark Database [66]. To compensate for this limitation, we added MarketScan® commercial claims and encounters of Thomson Reuters healthcare [65].
B. METHODS COMMON TO THREE SPECIFIC AIMS
Study population
We extracted data for all patients with an index date (date of first dispensing of celecoxib or a tNSAID) fell between 1 January 2001 – 30 June 2009 (MarketScan) or 1 July 2003 – 30 June 2008 (Optum). These dates were chosen because of availability of data including inpatient diagnoses and procedure. Additional selection criteria were age 18-65, health insurance plan with full medical and pharmacy benefits, at least 6 months of enrollment history at the index date, at least one diagnosis of RA [International Classification of Diseases 9) code 714, 7140, 7141, 7142, 7143x] or OA (ICD-9 code 715x, 721x); no NSAID dispensing during the 6 months prior to the index date (wash-out period); and no record of any of the following conditions in 6 months prior to the index date: gastrointestinal ulcer disorders, gastrointestinal hemorrhage, active renal, hepatic, coagulation disorders, allergies, malignancy, esophageal or gastroduodenal ulceration.
19
43255 or ICD-9 procedure code 4443) during a 60-day follow-up period after the initiation of the study drug. These outcome definitions were used in a previous study [13] and validated for 1,762 patients in a hospital discharge database with a positive predictive value of 90% validated against medical chart review [72].
Methods for potential confounder selection
Three different methods were employed to select potential confounders to derive the PS:
(1) Expert knowledge only. With this frequently used method, confounders are pre-specified based on the subject‐matter knowledge. The a priori confounders we selected for this study were age, gender, calendar year, hypertension, congestive heart failure, coronary artery disease, inflammatory bowel disease, prior dispensing of gastroprotective drugs, warfarin, antiplatelet, and oral steroids [13,15,73-75];
(2) Semi‐automated covariate selection. With this method, we used the hd-PS algorithm to select confounders to supplement those selected based on expert knowledge.
(3) Automated covariate selection. This method uses the hd-PS algorithm and a more limited set of a priori covariates. We used only age, gender, and calendar year as a priori covariates.
20
Figure 3.1. A causal Directed Acyclic Graph (DAG) for of celecoxib and Upper Gastrointestinal Complications (: causes)
Selection of Variables and Parameters for Propensity Score Balancing
The computer algorithm used to implement methods 2 and 3 in our study is the multi-step hd-PS macro [13]. The macro proceeds in these steps: (i) identify data dimensions, e.g., diagnoses, procedures, and medications; (ii) define covariates using the codes within each dimension; (iii) assess candidate covariates by their recurrence, i.e. multiplicity of the same code, (once, sporadic or frequent); (iv) prioritize covariates by their potential for confounding control based on the bivariate associations of each covariate with the treatment and with the outcome according to Bross formula [13,26]; (v) select a pre‐specified number of covariates for adjustment; and (vi) estimate of the PS using the selected covariates plus any predefined covariates.
21
inpatient procedures, outpatient diagnoses, outpatient procedures and outpatient drug use. We allowed a maximum of 500 covariates for the PS adjustment in a multiplicative model and a maximum of 200 variables from each data dimension, based on 5-digit granularity of ICD-9, CPT or Healthcare Common procedure Coding System (HCPCS), and generic drug names.
C. METHOD FOR SPECIFIC AIM 1
For each cohort from each data source, we compared the 60-day risk of UGI complication in celecoxib initiators to that in tNSAID initiators. We used a log-binomial regression model to estimate adjusted risk ratios (RRs) and their 95% confidence intervals (CIs). We estimated RRs instead of odds ratios to avoid the non-collapsibility of the odds ratio under exchangeability [76]. Models included, in addition to the indicator variable for celecoxib initiation the PS in deciles estimated by different sets of covariates identified by the three methods as dummy variables.
We also conducted pooled analyses, a PS-based pooling method [63], for the two combined databases. The pooled analyses were stratified by data source and adjusted by deciles of separate PSs [63]. We employed the PS distribution without trimming of the non-overlap region to create separate PS deciles for each data source cohort. In addition to the use of the propensity score deciles, we applied 1:1 PS greedy matching [64] starting at the eighth decimal place [63] and continued to the first within the data source to create a matched cohort from each data source and then conducted the pooled analyses for these matched cohorts.
D. METHOD FOR SPECIFIC AIM 2
We selected a cohort example of MarketScan, July 2003-September 2004 for resampling to investigate specific aims 2 and 3.
Sampling techniques to generate cohorts with different sizes, outcome incidences and exposure prevalences
22
aggregation scenario (including no aggregation), we created six categories of 100 cohorts, as follows. We created “small” cohorts by drawing 50% (category 1) and 20% (category 2) simple random samples, 100 times each, without replacement. We created cohorts with low outcome incidence by drawing 50% (category 3) and 20% (category 4) simple random samples, 100 times each, without replacement, from the 117 cases and re-coding the remaining cases as noncases. Cohorts in categories 3 and 4 consisted of the sampled and recoded cases plus the original 18,712 noncases. Finally, we created cohorts with low exposure prevalences by drawing 50% (category 5) and 20% (category 6) simple random samples, 100 times each, without replacement, from the 7,197 exposed subjects and replacing the unselected exposed subjects with the same number of randomly selected unexposed patients. Cohorts in categories 5 and 6 consisted of the sampled exposed subjects, replacements for the unselected exposed subjects, plus the original 11,632 unexposed subjects.
We applied hd-PS to the full study cohort to estimate the treatment effect and used it as the reference value for comparison with results from the generated cohorts. For the 100 samples in each of the cohort categories, we calculated summary statistics for the estimated risk ratios (geometric mean, 25th and 75th percentiles), the mean percentage of covariates selected by hd-PS in the full cohort that were also selected by hd-PS in the samples, the median number of exposed and unexposed subjects, the median number of exposed and unexposed outcomes.
Simulations to validate sampling techniques
To validate the proposed sampling techniques, we simulated data of 10,000 subjects, 6 covariates independent of one another. We started with 3 binary covariates, X1, X2, and X3, each with
a prevalence of 0.2, and 3 continuous covariates, X4, X5, and X6, each with a mean=0 and
variance=1. We estimated the predicted probability of the binary intended treatment T with prevalence ~33% based on these 6 covariates and covariate-treatment associations using a logistic model:
p(T|X1-X6)=(1+exp(-(α0 + α1X1 + α2X2 + α3X3 + α4X4 + α5X5 + α6X6) ) ) -1
23
E(Y|T,X1-X6)=exp(β0 + β1X1 + β2X2 + β3X3 + β4X4 + β5X5 + β6X6 + βTT) )
The parameter value for α0 was selected to obtain a prevalence of T of approximately 33%,
the one for β0 in equation for an incidence of approximately 0.1 per observation over a fixed follow-up time in the untreated, a true exposure RR=0.5. We used parameter values: α1=0.69; α2=0; α3=−1.61;
α4=0.41; α5=0; α6=−0.69; β1=0; β 2=0.69; β3=−1.61; β4=0; β5=0.41; and β6=−0.69. We used the log-linear outcome model. We simulated 1,000 cohort studies with n =10,000 for each sampling scenario. Results of 1,000 runs at 50%, 20%, 10% and 5% sampling rates demonstrated that our proposed techniques did not affect the treatment effect estimate while being able to keep total sample size constant for outcome incidence or exposure prevalence samplings (Appendix B).
D. METHOD FOR SPECIFIC AIM 3
Aggregations of medical diagnoses and medications
In the basic scenario, we applied the hd-PS with up to 5-digit granularity of ICD-9 for inpatient and outpatient diagnoses. Note that 3-digit ICD-9 codes are kept separate from 4- and 5-digit codes in the hd-PS despite some hierarchy between these levels. We transformed ICD-9 diagnoses into four-level CCS categories via the cross-mapped ICD-9 to CCS multi-level diagnoses table [68].There are 18, 134, 355 and 207 categories in CCS levels 1, 2, 3 and 4, respectively. However, not all ICD-9 codes have a corresponding CCS code in all four levels. Therefore we created a “universal” CCS by using the most granular code available for each ICD-9 diagnosis code. We separately investigated different levels of ICD-9 granularity by using the first 3- or 4-digit ICD-9 codes.
24
chosen if a new substance fits in both a chemical and pharmacological 4th level. Substances in the same 4th ATC level are not pharmacotherapeutically equivalent, as they may have different modes of action, therapeutic effects, drug interactions and adverse drug reaction profiles. New 4th levels are commonly established if at least two approved substances fit in the group. A new substance not clearly belonging to any existing group of related substances of ATC 4th level will often be placed in an X group ("other" group).
CHAPTER IV
RESULTS: Comparative gastro-intestinal risk of nonsteroidal anti-inflammatory drug classes: a cautionary tale about “automated” pharmacoepidemiology
A. INTRODUCTION
Non-random assignment of therapy in clinical practice can lead to confounding by indication in observational studies of drug effects [77]. Confounding occurs when either clinically assigned or self-selected drug therapies with similar indications are prescribed preferentially to patients with different baseline prognoses. Propensity score methods have been developed as a strategy for controlling confounding in situations with many variables and limited knowledge of how to select from among them.
26
Moreover, hd-PS has not developed sophisticated options for users to consider specific subtleties of the data. These might include, but are not restricted to, expected changes in the channelling of drugs at specific calendar time points (e.g., due to publication of landmark trials, black box warnings, ‘Dear Doctor’ letters, marketing activities by drug makers, new guidelines or policies, etc.) [25,52], differences in study periods, and differences in administrative healthcare databases.
To investigate the effect of different calendar time periods, data sources on the hd-PS performance to control for confounding of treatment effects, we created an empirical example based on prior research [13,79] that observed elevated crude risk ratios likely due to confounding by indication in studies of upper gastrointestinal (UGI) complications in rheumatoid arthritis (RA) or osteoarthritis (OA) patients initiating celecoxib compared to traditional non-steroidal anti-inflammatory agents (tNSAID). Celecoxib has been shown to decrease risk for UGI complications in several randomized clinical trials (RCT) [18-23]. We therefore assume that a treatment effect estimate closer to 0.5 is less biased by confounding.We subdivided the MarketScan and Optum cohorts into two subcohorts according to whether the study drug was initiated before or after 30 September 2004 (hereafter referred to as “withdrawal”), and separate analyses for pre and post withdrawal periods were conducted.
B. METHODS
Data sources
27 Study population
We extracted data for all patients with an index date (date of first dispensing of celecoxib or a tNSAID) between 1 January 2001 – 30 June 2009 (MarketScan) or 1 July 2003 – 30 June 2008 (Optum). These dates were chosen because of availability of data including inpatient diagnoses and procedures. Additional selection criteria were age 18-65 years, membership in a health insurance plan with full medical and pharmacy benefits, at least 6 months of enrollment history at the index date, at least one diagnosis of RA [International Classification of Diseases (ICD-9) code 714, 7140, 7141, 7142, 7143x] or OA (ICD-9 code 715x, 721x); no NSAID (including aspirin) dispensing during the 6 months prior to the index date (wash-out period); and no record of any of the following conditions in 6 months prior to the index date: gastrointestinal ulcer disorders, gastrointestinal hemorrhage, active renal, hepatic, coagulation disorders, allergies, malignancy, esophageal or gastroduodenal ulceration.
The study outcome of UGI complication was defined as either first peptic ulcer disease complications including perforation, UGI hemorrhage (ICD-9 code 531x, 532x, 533x, 534x, 535x, 5780), or a physician service code for UGI hemorrhage (Current Procedure Terminology [CPT] code 43255 or ICD-9 procedure code 4443) during a 60-day period after the initiation of the study drug. These outcome definitions were used in a previous study [13] and validated in 1,762 patients in a hospital discharge database with a positive predictive value of 90% validated against medical chart review [72].
Methods for confounder selection
28
method, we used the hd-PS algorithm to select confounders to supplement those selected based on expert knowledge. (3) Automated covariate selection. This method uses the hd-PS algorithm and a more limited set of a priori covariates including only age, gender, and calendar year of study drug initiation.
The computer algorithm used to implement methods 2 and 3 in our study is the multi-step hd-PS macro [13]. The macro proceeds in these steps: (i) identify data dimensions, e.g., diagnoses, procedures, and medications; (ii) define covariates using the codes within each dimension; (iii) assess candidate covariates by their recurrence, i.e. multiplicity of the same code, (once, sporadic or frequent); (iv) prioritize covariates by their potential for confounding control based on the bivariate associations of each covariate with the treatment and with the outcome according to Bross formula [13,26]; (v) select a pre‐specified number of covariates for adjustment; and (vi) estimate of the PS using the selected covariates plus any predefined covariates.
Statistical analysis
Because of limited data availability and to mimic as closely as possible the intention-to-treat analyses in the trials, we used a prescription reimbursement claim as the treatment measure to compare the 60-day risk of UGI complication in celecoxib initiators to that in tNSAID initiators. We used log-binomial regression models to estimate adjusted risk ratios (RRs) and their 95% confidence intervals (CIs). We estimated RRs instead of odds ratios to avoid the non-collapsibility of the odds ratio under exchangeability [76]. Models included, in addition to the indicator variable for celecoxib initiation the PS in deciles estimated by different sets of covariates identified by the three methods as dummy variables. For 1:1 PS greedy matched cohorts, models included the indicator variable for celecoxib initiation.
29
applied 1:1 PS greedy matching [64] starting at the eighth decimal place [63] and continuing to the first within the data source to create matched cohorts from each data source, and then conducted the pooled analyses for these matched cohorts. The current study was exempt by the Institutional Review Board of University of North Carolina at Chapel Hill.
C. RESULTS
Individual data source analyses
In the MarketScan database, compared to the tNSAID group celecoxib users had more baseline risk factors, particularly the warfarin use (5% vs. 1%) (Table 4.1); had longer durations of study drug use (mean 66 days vs. 31 days), and had a higher incidence of UGI complication (0.7% vs. 0.6%). We observed that all three adjusted estimates were reduced from the crude RR of 1.16 in the direction of the RCT finding, although they remained greater than 1.0. There was a substantial overlap in the PS distribution between the two treatment groups. Unexpectedly, the adjustment using greedy matching with the PS created by the semi-automated covariate selection moved the crude RR away from the RCT finding.
In the Optum database, compared to the tNSAID group celecoxib users also had a greater prevalence of the above risk factors (Table 4.2), longer durations of drug use (mean 53 days vs. 29 days), and a higher incidence of UGI complication within 60 days after drug initiation (0.9% vs. 0.8%). An analogous trend of adjusted estimates from the three covariate selection strategies was observed as with the MarketScan database. The adjustment using greedy matching with the PS based on predefined covariates delivered an estimate very slightly closer to the RCT finding than did greedy matching with the automated and semi-automated covariate selection methods.
Overall pooled analyses
30
drug initiation (0.8%) than tNSAID initiators (0.7%) (Table 4.4). We observed similar patterns for adjusted estimates using three variable selection methods. There was substantial overlap in the PS distribution between the two treatment groups. Interestingly, the pooled RR from the greedy matching using the predefined covariate PS delivered an estimate very slightly closer to the RCT finding [18-23] than did the other covariate selection methods (Table 4.4).
Calendar time periods
On 30 September 2004 Merck Inc. announced the voluntary withdrawal of rofecoxib from the US market [24]. We hypothesized that channelling of celecoxib, a drug of the same class as rofecoxib, would be affected by the withdrawal of rofecoxib. Specifically, we hypothesized that the influence of UGI risk on preferential prescribing of coxibs would increase (increased confounding by indication). We therefore subdivided the MarketScan and Optum cohorts into two subcohorts according to whether the study drug was initiated before or after 30 September 2004 (hereafter referred to as “withdrawal”), and separate analyses for pre and post withdrawal periods were conducted.
Table 4.1: Characteristics of initiators of celecoxib or NSAIDs (ibuprofen or diclofenac) in cohorts 18-65 years old, before and after 1:1 greedy matching based on automated hd-PS covariates, from MarketScan database: age at the date of the first medication use and comorbidities/ use of medications as defined during six months prior to the first study medication use
Before or on 30 September 2004 After 30 September 2004
Original cohort After PS matching Original cohort After PS matching Original cohort After PS matching
Characteristics Celecoxib Ibuprofen
or Diclofenac
Celecoxib Ibuprofen or Diclofenac
Celecoxib Ibuprofen or Diclofenac Celecoxib Ibuprofen or Diclofenac Celecoxib Ibuprofen or Diclofenac
Celecoxib Ibuprofen or Diclofenac
Number of drug initiators (N) 14,939 19, 917 11,463 11,463 39, 406 103, 308 28,633 28,633 54,345 123,225 40,054 40,054
Age (years)
Median 56.0 52.0 55.0 55.0 55.0 52.0 55.0 55.0 56.0 52.0 55.0 55.0
Mean 54.4 50.6 53.4 53.3 53.7 50.6 53.2 53.4 53.9 50.6 53.5 53.5
Standard Deviation 8.2 9.7 8.5 8.3 8.4 9.7 8.6 8.4 8.3 9.7 8.5 8.4
18-35 (%) 3.1 8.2 3.7 3.5 3.6 8.3 4.1 4.0 3.5 8.3 3.8 3.7
36-45 (%) 10.9 18.7 13.0 13.0 12.0 18.3 13.2 12.4 11.7 18.3 12.8 12.7
46-55 (%) 33.2 37.0 35.8 37.1 34.9 37.2 35.7 36.2 34.4 37.2 35.3 35.7
56-65 (%) 52.9 36.1 47.5 46.4 49.4 36.2 47.0 47.4 50.4 36.2 48.0 47.8
Female (%) 60.9 59.0 60.2 59.5 59.2 58.4 59.1 59.0 59.7 58.5 59.5 59.4
Hypertension (%) 22.6 18.2 20.7 20.4 29.7 25.2 27.0 27.3 27.7 24.1 25.3 25.2
Congestive heart failure (%) 0.4 0.4 0.3 0.4 0.8 0.6 0.6 0.5 0.7 0.5 0.6 0.5
Coronary artery disease (%) 3.3 2.5 2.7 2.7 4.3 3.1 3.7 3.7 4.0 3.0 3.4 3.5
Chronic renal disease (%) 0.5 0.6 0.5 0.6 0.8 0.8 0.8 0.8 0.7 0.7 0.7 0.8
Inflammatory bowel disease
(%) 0.3 0.2 0.3 0.3 0.7 0.4 0.7 0.4 0.6 0.3 0.6 0.3
Use of gastroprotective drugs
(%) 21.3 19.6 18.5 23.4 22.2 19.0 21.8 24.8 21.9 19.1 21.0 24.8
Use of warfarin (%) 2.8 1.1 1.7 1.4 6.0 1.1 3.7 2.4 5.1 1.1 3.2 2.1
Use of antiplatelet (%) 1.7 0.9 1.4 1.2 2.2 1.4 2.1 2.1 2.1 1.3 1.9 1.9
Use of oral steroids (%) 13.0 11.6 12.6 12.0 15.0 14.6 15.1 16.4 14.5 14.1 14.3 14.8
*:1 January 2001-30 June 2009
All
MarketScan*
3
Table 4.2: Characteristics of initiators of celecoxib or NSAIDs (ibuprofen or diclofenac) in cohorts 18-65 years old, before and after 1:1 greedy matching based on automated hd-PS covariates, from Optum database: age at the date of the first medication use and comorbidities/ use of medications as defined during six months prior to the first study medication use
Before or on 30 September 2004 After 30 September 2004
Original cohort After PS matching Original cohort After PS matching Original cohort After PS matching
Characteristics Celecoxib Ibuprofen
or Diclofenac
Celecoxib Ibuprofen or Diclofenac
Celecoxib Ibuprofen or Diclofenac Celecoxib Ibuprofen or Diclofenac Celecoxib Ibuprofen or Diclofenac Celecoxib Ibuprofen or Diclofenac
Number of drug initiators (N) 8,165 12,257 6,916 6,916 36,083 83, 862 34,554 34,554 44,248 96,119 42,041 42,041
Age (years)
Median 55.0 51.0 54.0 54.0 54.0 51.0 54.0 54.0 54.0 51.0 54.0 54.0
Mean 53.3 49.7 52.5 52.7 52.3 50.0 52.1 52.2 52.5 50.0 52.2 52.3
Standard Deviation 8.4 9.9 8.6 8.4 8.9 9.7 8.9 8.8 8.8 9.8 8.9 8.8
18-35 (%) 3.6 9.4 4.2 3.9 5.2 8.9 5.4 5.2 4.9 8.9 5.1 5.0
36-45 (%) 14.3 20.8 16.1 14.8 15.5 20.2 16.0 15.7 15.3 20.3 15.9 15.4
46-55 (%) 35.2 37.3 36.6 38.2 36.7 37.8 37.0 37.6 36.5 37.8 36.9 38.0
56-65 (%) 46.9 32.5 43.2 43.1 42.6 33.0 41.7 41.5 43.4 33.0 42.1 41.7
Female (%) 60.1 57.6 56.8 56.9 57.9 57.4 58.3 58.5 58.3 57.4 57.9 58.3
Hypertension (%) 30.5 25.2 28.8 29.0 32.6 29.4 32.1 32.2 32.3 28.8 31.6 31.7
Congestive heart failure (%) 1.1 0.6 0.9 0.8 0.9 0.7 0.9 0.9 1.0 0.7 0.9 0.9
Coronary artery disease (%) 4.9 3.0 3.8 3.8 4.2 3.5 4.0 4.1 4.4 3.4 4.1 4.0
Chronic renal disease (%) 1.1 0.8 0.9 0.8 0.9 0.9 0.8 1.0 0.9 0.9 0.9 1.0
Inflammatory bowel disease (%) 0.8 0.4 0.8 0.5 0.8 0.5 0.8 0.6 0.8 0.5 0.8 0.5
Use of gastroprotective drugs
(%) 19.9 12.3 16.6 16.2 17.1 11.7 16.5 16.5 17.6 11.7 16.7 16.4
Use of warfarin (%) 3.0 0.7 1.5 1.2 3.5 0.9 2.4 1.8 3.4 0.9 2.2 1.8
Use of antiplatelet (%) 1.7 0.6 1.1 1.0 1.9 1.1 1.8 1.7 1.9 1.0 1.6 1.6
Use of oral steroids (%) 11.6 9.4 10.6 10.7 13.5 11.3 13.3 13.5 13.2 11.1 12.9 13.0
*: 1 July 2003-30 June 2008
All
Optum*
3
Table 4.3: Characteristics of initiators of celecoxib or NSAIDs (ibuprofen or diclofenac) in cohorts 18-65 years old, before and after 1:1 greedy matching based on automated hd-PS covariates, from MarketScan and Optum databases: age at the date of the first medication use and comorbidities/ use of medications as defined during six months prior to the first study medication use
Before or on 30 September 2004 After 30 September 2004
Original cohort After PS matching Original cohort After PS matching Original cohort After PS matching
Characteristics Celecoxib Ibuprofen or Diclofenac
Celecoxib Ibuprofen or Diclofenac
Celecoxib Ibuprofen or Diclofenac Celecoxib Ibuprofen or Diclofenac Celecoxib Ibuprofen or Diclofenac Celecoxib Ibuprofen or Diclofenac
Number of drug initiators (N) 23,104 32,174 18,379 18,379 75,489 187,170 63,187 63,187 98,593 219,344 82,095 82,095
Age (years)
Median 56.0 52.0 55.0 55.0 55.0 52.0 54.0 54.0 55.0 52.0 54.0 54.0
Mean 54.0 50.3 53.1 53.1 53.1 50.3 52.6 52.7 53.3 50.3 52.8 52.9
Standard Deviation 8.3 9.8 8.3 8.3 8.6 9.7 8.8 8.7 8.6 9.7 8.7 8.6
18-35 (%) 3.3 8.7 3.9 3.7 4.4 8.6 4.8 4.7 4.1 8.6 4.5 4.4
36-45 (%) 12.1 19.5 14.2 13.7 13.7 19.1 14.7 14.2 13.3 19.2 14.4 14.1
46-55 (%) 33.9 37.1 36.1 37.5 35.8 37.5 36.4 37.0 35.3 37.4 36.1 36.9
56-65 (%) 50.8 34.7 45.9 45.2 46.2 34.8 44.1 44.2 47.2 34.8 45.0 44.7
Female (%) 60.6 58.5 58.9 58.5 58.6 57.9 58.7 58.7 59.1 58.0 58.7 58.8
Hypertension (%) 25.4 20.9 23.7 23.6 31.1 27.1 29.8 30.0 29.8 26.2 28.5 28.5
Congestive heart failure (%) 0.7 0.5 0.5 0.6 0.9 0.6 0.8 0.7 0.8 0.6 0.8 0.7
Coronary artery disease (%) 3.9 2.7 3.1 3.1 4.3 3.2 3.9 3.9 4.2 3.2 3.8 3.8
Chronic renal disease (%) 0.7 0.7 0.7 0.7 0.8 0.8 0.8 0.9 0.8 0.8 0.8 0.9
Inflammatory bowel disease
(%) 0.5 0.3 0.5 0.4 0.7 0.4 0.8 0.5 0.7 0.4 0.7 0.4
Use of gastroprotective drugs
(%) 20.8 16.8 17.8 20.7 19.8 15.7 18.9 20.3 20.0 15.8 18.8 20.5
Use of warfarin (%) 2.8 1.0 1.6 1.3 4.8 1.0 3.0 2.1 4.3 1.0 2.7 1.9
Use of antiplatelet (%) 1.7 0.8 1.3 1.1 2.1 1.3 1.9 1.9 2.0 1.2 1.7 1.7
Use of oral steroids (%) 12.5 3.6 11.8 11.5 14.3 13.1 14.1 14.8 13.9 11.7 13.6 13.9
*:1 January 2001-30 June 2009; †:1 July 2003-30 June 2008
All
MarketScan* and Optum†
3
34
Greedy matching using the PS with predefined covariates resulted in the highest percentage of exposed patients who were successfully matched (Table 4.4). Greedy matching using the automated hd-PS covariates did not always produce adjusted RRs closer to the RCT finding, compared with greedy matching using the predefined covariate PS. In some cases for the MarketScan database, greedy matching using PS from either automated or semi-automated covariate selection moved the crude estimates far away from the expected decreased risk.
Table 4.4: Risk ratios for the upper gastrointestinal complication within 60 days after the study drug initiation for the cohorts from the two healthcare claims databases MarketScan and Optum by using the three selection strategies for confounders and PS deciles or 1:1 greedy matching
Unadjusted Predefined hd-PS* Predefined + hd-PS
Predefined + hd-PS
RR RR RR RR RR RR RR
(95% CI)† (95% CI)† (95% CI)† (95% CI)† (95% CI)† (95% CI)† (95% CI)†
MarketScan
379 123,225 742 1.16 1.12 1.07 1.10 1.07 93 1.10 74 1.24 73
(0.70) (0.60) (1.02-1.31) (0.99-1.27) (0.94-1.22) (0.96-1.25) (0.92-1.25) (0.92-1.31) (1.04-1.48)
83 19,917 120 0.92 0.91 0.87 0.88 0.80 0.83 0.86
(0.56) (0.60) (0.70-1.22) (0.68-1.20) (0.65-1.17) (0.65-1.19) (0.59-1.09) (0.59-1.17) (0.60-1.21)
46 11,632 71 1.05 0.95 0.92 0.94 0.87 0.75 0.93
(0.64) (0.61) (0.72-1.52) (0.65-1.38) (0.62-1.37) (0.63-1.40) (0.57-1.32) (0.46-1.23) (0.59-1.56)
296 103,308 622 1.25 1.19 1.13 1.16 1.21 1.30 1.29
(0.75) (0.60) (1.09-1.43) (1.03-1.37) (0.97-1.30) (1.00-1.34) (1.02-1.45) (1.06-1.60) (1.05-1.59)
Optum
396 96,119 717 1.20 1.10 1.09 1.09 1.03 1.07 1.10 95
(0.89) (0.75) (1.06-1.36) (0.97-1.25) (0.96-1.24) (0.96-1.24) (0.89-1.19) (0.92-1.23) (0.95-1.28)
68 12,257 78 1.31 1.21 1.20 1.20 1.17 1.10 1.27
(0.83) (0.64) (0.95-1.81) (0.87-1.69) (0.85-1.70) (0.85-1.70) (0.81-1.69) (0.75-1.63) (0.86-1.87)
328 83,862 639 1.19 1.08 1.07 1.07 1.01 0.99 1.02
(0.91) (0.76) (1.04-1.36) (0.95-1.24) (0.93-1.23) (0.93-1.23) (0.86-1.17) (0.85-1.16) (0.87-1.20)
MarketScan and Optum
Overall 98,593 775 219,344 1,459 1.18 1.11 1.08 1.09 1.05 96 1.08 83 1.16 83
(0.79) (0.67) (1.08-1.29) (1.01-1.21) (0.98-1.18) (0.99-1.19) (0.95-1.16) (0.96-1.21) (1.03-1.30)
January 2001-September 2004 23,104 151 32,174 198 1.06 1.02 0.97 1.00 0.94 92 0.94 80 1.02 79 (0.65) (0.62) (0.86-1.31) (0.82-1.25) (0.76-1.25) (0.80-1.26) (0.74-1.19) (0.73-1.22) (0.79-1.32)
15,362
114 23,889 149 1.18 1.09 1.07 1.09 1.03 95 0.95 82 1.13 81
(0.74) (0.62) (0.93-1.52) (0.85-1.40) (0.82-1.39) (0.83-1.40) (0.78-1.36) (0.70-1.29) (0.83-1.54)
September 2004-July 2009 75,489 624 187,170 1,261 1.27 1.13 1.10 1.11 1.09 97 1.09 84 1.11 84 (0.83) (0.67) (1.16-1.35) (1.03-1.25) (0.99-1.21) (1.00-1.23) (0.97-1.27) (0.97-1.24) (0.98-1.26)
*hd-PS: high dimensional propensity score; †: Risk Ratio and 95% Confidence Interval; **:Percent of exposed patients matched PS deciles
Initiators N
Celecoxib Ibuprofen or Diclofenac
PS matching Predefined hd-PS*
%** %** %**
July 2003-September 2004
Overall: January 2001-June 2009 54,345
Outcome N (%) Initiators N Outcome N (%) 90
77 75
July 2003-September 2004 7,197 January 2001-September 2004 14,939
95
79 77
October 2004-June 2009 39,406 95 73 72
98
95
July 2003-September 2004 8,165 Overall: July 2003-June 2008 44,248
96
85 85
99
96 96
October 2004-June 2008 36,083
3
36 D. DISCUSSION
We examined three different variable selection methods for the control of confounding in analyses with two large healthcare databases: covariate selection based on expert knowledge only, an automated search via the hd-PS algorithm, and the combination of these two approaches. The results of the three methods were similar. In particular, we did not observe a uniform improvement of confounding control with the hd-PS. Analyses taking into account various calendar time periods and data sources led to large differences in estimates.
Individual and pooled data analyses
In the separate and pooled data analyses, using semi-automated or automated methods to select covariates consistently yielded RRs closer to the RCT findingthan the crude RR,but all the adjusted RRs were still greater than 1.0. Adjusted RRs above 1.0 were inconsistent with previous results from either separate database analysis [13,15,16] or PS-pooling method [63]. Adding the hd-PS covariates into the predefined covariates produced nearly similar estimates with hd-PS deciles, but worse estimates with PS greedy matching.
Calendar time periods