MEDICAID WORK REQUIREMENTS: THE IMPACT ON PAYER MIX, OPERATING MARGINS, AND UNCOMPENSATED CARE
COSTS AT DISPROPORTIONATE-SHARE HOSPITALS IN NORTH CAROLINA
John T. Noble
An honors thesis submitted to the faculty of the Kenan-Flagler Business School at the University of North Carolina at Chapel Hill
Chapel Hill 2020
Approved by _________________________________ (Dr. Saravanan Kesavan)
Approved by _________________________________ (Dr. Bradley Hendricks)
ABSTRACT John T. Noble
Medicaid Work Requirements: The Impact on Payer Mix, Operating Margins, and Uncompensated Care Costs of Disproportionate-Share Hospitals in North Carolina
(Under the direction of Dr. Saravanan Kesavan)
Medicaid work requirements are a relatively new policy, coming into effect January 2018. While the current literature focuses on coverage loss for Medicaid recipients, this honor thesis examines the impacts of implementing Medicaid work requirements in North Carolina. I examine the effects of Medicaid work requirements on payer mix, operating margins, and uncompensated care costs of Disproportionate-Share Hospitals in North Carolina. Using a quantitative approach with hospital data from the Centers for Medicare and Medicaid Services, this study concludes that work requirements
ACKNOWLEDGEMENTS
I am incredibly fortunate to have had the opportunity to work on a Senior Honors Thesis over the past year. The successful completion of this work was made possible by the unending support I have received over the years from educators, mentors, friends, and family. I had the best people in my corner through every step of the process, and I thank you all for your support. I would like to recognize some specific individuals for their guidance this past year:
Dr. Saravanan Kesavan – Thank you for your questions, insights, and support throughout the process. I am grateful for your belief in me throughout this thesis.
Dr. Bradley Hendricks – Thank you for your engaging with my research from the very beginning of my thesis. Your feedback and questions pushed me to think critically about my work.
Mr. Markus Saba – Thank you for serving on my committee, engaging with my work, and providing valuable feedback.
Dr. Patricia Harms – Thank you for everything. Thank you for being our biggest critic and our biggest advocate. Thank you for holding us to the highest standards and helping us be our best selves. Thank you for all of your thoughtfulness,
Ms. Gabriella Aboulafia – Thank you for all the long conversations about Medicaid work requirements and the ACA. Your expertise and guidance pushed me to learn more about the health policy sphere.
My friends – Thank you for always taking an interest in my research and checking in on me. Your love and support made this year-long process possible.
TABLE OF CONTENTS
ABSTRACT ... II
ACKNOWLEDGEMENTS ... III
TABLE OF CONTENTS ... V
LIST OF ABBREVIATIONS ... VII
LIST OF EQUATIONS ... VII
LIST OF FIGURES ... VIII
INTRODUCTION ... 9
LITERATURE REVIEW ... 10
BACKGROUND OF THE MEDICAID PROGRAM ... 10
The Medicaid program: from origins to present day ... 10
Federal-State structure of the Medicaid Program ... 11
The ACA and Section 1115: two critical changes to the Medicaid program ... 12
EFFECTS OF MEDICAID EXPANSION ... 14
Effects of Medicaid Expansion on State Economies ... 15
Effects of Medicaid Expansion on Coverage ... 16
Effects of Medicaid Expansion on Labor ... 17
Effects of Medicaid Expansion on Hospitals ... 19
WORK REQUIREMENTS IN MEANS-TESTED PROGRAMS ... 21
Effects of SNAP Work Requirements ... 21
Effects of Medicaid Work Requirements ... 22
GOALS FOR THIS RESEARCH ... 23
METHODOLOGY ... 24
QUESTION & HYPOTHESES ... 24
First Hypothesis ... 24
Second Hypothesis ... 25
Third Hypothesis ... 26
Fourth Hypothesis ... 26
DISPROPORTIONATE SHARE HOSPITALS & DSH PAYMENTS ... 28
BASELINE DATA AND IDENTIFYING DSH HOSPITALS IN NORTH CAROLINA ... 29
FORECASTING MEDICAID ENROLLMENT IN NORTH CAROLINA AFTER WORK REQUIREMENTS ... 30
EXAMINING PAYER MIX OF DSH HOSPITALS ... 32
EXAMINING OPERATING MARGINS OF DSH HOSPITALS ... 33
Operating Margin ... 33
Revenues ... 34
Costs ... 35
Uncompensated Care Costs ... 36
LIMITATIONS ... 37
RESULTS ... 39
FISCAL YEAR 2014-2015 ... 40
Payer mix before Medicaid work requirements ... 40
Payer mix after Medicaid work requirements ... 41
Operating Margins... 42
Uncompensated Care Costs before and after Medicaid work requirements ... 48
FISCAL YEAR 2015-2016 ... 50
Payer mix before Medicaid work requirements ... 50
Payer mix after Medicaid work requirements ... 51
Operating Margins... 52
Uncompensated Care Costs before and after Medicaid work requirements ... 58
DISCUSSION ... 60
EFFECTS ON PAYER MIX AT HOSPITALS ... 60
EFFECTS ON HOSPITAL OPERATING MARGINS ... 61
Effects on Revenues ... 61
Effects on Expenses ... 61
Overall Effects on Operating Margins ... 62
HOSPITAL UNCOMPENSATED CARE COSTS ... 62
DISCUSSION CONCLUSION ... 63
CONCLUSION ... 64
APPENDICES ... 67
APPENDIX A ... 68
APPENDIX B ... 72
APPENDIX C ... 73
APPENDIX D: SITUATIONAL ANALYSES ... 74
Fiscal Year 2014 – 2015 ... 74
Fiscal Year 2015 – 2016 ... 84
LIST OF ABBREVIATIONS
CMS The Centers for Medicare and Medicaid Services DSH Disproportionate Share Hospitals
ACA The Affordable Care Act
SNAP Supplemental Nutrition Assistance Program
LIST OF EQUATIONS
Equation 1: Calculating potential coverage loss ...32
Equation 2: Operating Margin ...33
Equation 3: Revenue per Medicaid discharge ...34
Equation 4: Revenue per non-Medicaid discharge ...34
Equation 5: Hospital Revenues after Medicaid work requirements ...35
Equation 6: Operating Expense per discharge ...35
Equation 7: Operating Expenses after Medicaid work requirements ...35
LIST OF FIGURES
Figure 1: Payer mix before Medicaid work requirements ... 40
Figure 2: Payer Mix after Medicaid work requirements ... 41
Figure 3: % Revenue per type of patient before Medicaid Work Requirements ... 42
Figure 4: % Revenue per type of patient before Medicaid Work Requirements ... 43
Figure 5: Net Medicaid Revenue before and after Medicaid work requirements .... 44
Figure 6: Average Total Net Revenue before and after Medicaid work requirements ... 45
Figure 7: Operating Expenses before and after Medicaid work requirements ... 46
Figure 8: Operating Margins before and after Work Requirements ... 47
Figure 9: Total Uncompensated Care Costs before and after Medicaid work requirements ... 48
Figure 10: Percentage Point change in Uncompensated Care Costs ... 49
Figure 11: Payer mix before Medicaid work requirements ... 50
Figure 12: Payer Mix after Medicaid work requirements ... 51
Figure 13: % Revenue per type of patient before Medicaid Work Requirements ... 52
Figure 14: Revenue per type of patient before Medicaid Work Requirements ... 53
Figure 15: Net Medicaid Revenue before and after Medicaid work requirements .. 54
Figure 16: Average Total Net Revenue before and after Medicaid work requirements ... 55
Figure 17: Operating Expenses before and after Medicaid work requirements ... 56
Figure 18: Operating Margins before and after Work Requirements ... 57
Figure 19: Total Uncompensated Care Costs before and after Medicaid work requirements ... 58
INTRODUCTION
A significant change in Medicaid policy occurred in January 2018 when the federal government began allowing states to impose work requirements on Medicaid recipients. North Carolina was one of several more states that has considered filing an application with the Centers for Medicare & Medicaid Services (CMS) for the approval of Medicaid work requirements. On March 27, 2019, the North Carolina Senate filed a bill titled “Medicaid Work and Community Engagement Opp.” (NC Senate Bill 387). If passed, Senate Bill 387 would implement work reporting requirements for ‘able-bodied’ adults who receive Medicaid health benefits (North Carolina General Assembly, Senate Bill 387, 2019). Senate Bill 387 would require current North Carolina Medicaid
LITERATURE REVIEW
In this literature review, I first provide a background of the Medicaid program that is important for contextualizing my research. Then, I outline current research which studies the effects Medicaid expansion has on state economies, coverage rates, labor participation, and hospital finances. Next, I discuss the body of research that examines the effects of work requirements on means-tested programs1, such as the Supplemental
Nutrition Assistance Program and Medicaid. Finally, I conclude this literature review by considering the gaps in the current literature and describing how this research contributes to the conversation about Medicaid work requirements.
Background of the Medicaid Program
In this section, I will discuss the history of Medicaid, the structure of the program, and critical recent changes to the program. Together, these sections provide a
foundational knowledge of Medicaid, which is necessary for understanding my research. The Medicaid program: from origins to present day
From its humble beginnings a little over fifty years ago, Medicaid has evolved from a footnote in healthcare to the nation’s most extensive healthcare program. President Lyndon B. Johnson signed Medicaid and Medicare into law as a part of the Social Security Amendments of 1965. A child of President Johnson’s “Great Society Programs,” Medicaid sought to provide medical care to low-income individuals and families. Since its implementation in 1965, Medicaid has become the largest
means-1 A means-tested program, such as Medicaid, is a program that uses individual income or poverty
tested transfer program in the United States, in both the number of participants and total costs (Buchmueller, Ham, & Shore-Sheppard, 2015; Centers for Medicare & Medicaid Services, 2019b). According to CMS, around one in five Americans, or 66 million people, were enrolled in Medicaid in 2019. Federal spending for Medicaid reached $593 billion in fiscal year 2018, and it accounted for two percent of Gross Domestic Product (Congressional Budget Office, 2019). Medicaid has grown from a small program at its inception to a fundamental part of the healthcare system.
Federal-State structure of the Medicaid Program
Medicaid is a joint federal-state program responsible for providing medical coverage to low-income individuals and families. State participation in Medicaid is voluntary for all states, the District of Columbia (DC), and American territories
(Medicaid and CHIP Payment and Access Commission, 2019a). The federal government provides a large majority of the funding for Medicaid and sets requirements for
eligibility, services that states must cover, and reimbursement rates (Buchmueller, Ham, & Shore-Sheppard, 2015). State Medicaid receives payments from the federal
Medicaid, significant variations exist between state Medicaid programs (Bitler &
Zavodny, 2014). Thus, scholars often argue that Medicaid is not a single program, but 51 separate programs.
While states have some control over determining eligibility, they are required to provide Medicaid and services to four federally recognized groups. The current Medicaid law covers the following groups of people: low-income families, pregnant women, people of all ages with disabilities, and individuals that need long-term care (Centers for Medicare & Medicaid Services, 2019c). To be eligible for Medicaid, an individual must meet the criteria set by the federal and state government. Tables 1-4 in the Appendix show the income and resource requirements set by the state of North Carolina to be eligible for Medicaid for different beneficiary groups (North Carolina Department of Health and Human Services, 2019). All states determine the final income thresholds for Medicaid, but they are still subject to minimum and maximum thresholds set by the federal government (Bitler & Zavodny, 2014).
Medicaid is seen as an exemplary model of federalism and shared power between the federal and state governments. Broad federal mandates and state flexibility with the Medicaid program have created a patchwork of Medicaid programs in which no state’s program is structured exactly alike.
The ACA and Section 1115: two critical changes to the Medicaid program
Signed into law in 2010, the ACA aimed to increase insurance coverage and reduce the rate of uninsured individuals. A key component of the ACA allowed states to voluntarily expand Medicaid to cover more low-income Americans (Camilleri, 2017). Under the ACA, Medicaid eligibility could be extended to adults with incomes up to 138 percent of the federal poverty level, with the promise of increased federal funding for expanded coverage (Camilleri, 2017). North Carolina is one of 14 states that opted out of Medicaid expansion under the ACA, and Table 5 in the Appendix shows state decisions to participate in expansions (The Kaiser Family Foundation, 2019). Although lawmakers designed the ACA to expand access to healthcare for as many individuals as possible, states still had the discretion of who to cover and what benefits individuals were entitled to receive.
Another significant change to Medicaid came in 2018 when CMS revised the criteria for Section 1115 waivers. Under Section 1115 of the Social Security Act, the Secretary of Health and Human Services (HHS) can waive certain requirements of Medicaid. The waivers permit states to use federal Medicaid funds in alternative ways if HHS determines that the state will use the funds to promote the objectives of the
non-elderly, and non-pregnant individuals to meet work and community engagement requirements for Medicaid eligibility. State Section 1115 waivers have some common features, but they vary with regards to:
• which populations are required to participate in work or community engagement as a condition of eligibility, and within those populations, which individuals qualify for an exception to the requirement;
• activities that qualify as work or community engagement, and the number of hours beneficiaries are required to complete; and
• the penalties for non-compliance (pg. 2)
Most states with approved waivers opted to expand Medicaid under the ACA, and the work requirements they adopted applies to their expansion population. CMS approved work and community engagement requirements for two non-expansion states, South Carolina and Wisconsin (Medicaid and CHIP Payment and Access Commission, 2019a).
The ACA and Section 1115 waivers dramatically changed the Medicaid program. The ACA offered states the opportunity to expand their contributions to the Medicaid program and provide more coverage to individuals. Alternatively, Section 1115 waivers approved by the Secretary of HHS allow states to enact requirements as a condition of eligibility. These two changes have given states more autonomy, discretion, and power over their Medicaid programs and whom they decide to cover.
Effects of Medicaid Expansion
In this section of my literature review, I review the bodies of research that
However, I believe that understanding the impacts of Medicaid expansion will illuminate my topic and research about work requirements. I will examine the effects Medicaid has on state economies, coverage, labor, and hospitals.
Effects of Medicaid Expansion on State Economies
A substantial body of research found two main economic benefits to states through Medicaid expansion, including state budget savings and tax revenue gains. First, multiple studies suggest that expansion can result in state budget savings through
offsetting state costs in other areas. Research by Ayanian, Ehrlich, Grimes, and Levy (2017) linked Medicaid expansion to positive economic impacts in Michigan. Ayanian et al. (2017) found that Michigan experienced reduced state spending on services covered by Medicaid expansion, such as state mental health and correctional health programs, for adults who were previously ineligible for Medicaid. The authors calculated that due to Medicaid expansion, Michigan saved around $235 million annually (pg. 409). Additional studies conducted in Colorado, Montana, and Louisiana showed state budgetary savings due to Medicaid expansion offsetting the costs of various state health programs (Brown, Fisher, & Resnick, 2016; Richardson, Llorens, & Heidelberg, 2018; Ward & Bridge, 2019). Research across several different Medicaid expansion states concluded that Medicaid expansion has net positive impacts on states’ budgets.
In addition to state budget savings, research suggests that states also see revenue gains from Medicaid expansion. Studies conducted in several states, including Colorado, Michigan, Montana, Louisiana, and Pennsylvania, show that Medicaid expansion
Medicaid led to an increase in state tax revenues of $53.4 million per year. Similarly, Ayanian et al. (2017) found that Medicaid expansion in Michigan will add approximately $145 million to $153 million annually in new state tax revenue. Three main factors that contributed to increased state tax revenues were: the higher federal pay rates for
Medicaid populations after expansion, additional revenue from taxes on managed care organizations, and a decrease in state disproportionate share payments to hospitals as the number of uninsured individuals decreased (Ayanian, Ehrlich, Grimes, & Levy, 2017; Richardson, Llorens, & Heidelberg, 2018). The current research converges on the same idea: Medicaid expansion bolsters state economies through budget savings and new tax revenues.
Effects of Medicaid Expansion on Coverage
Substantial research conducted on health insurance coverage after expansion showed two main things – sizable coverage gains after implementation expansion and a compromise in coverage gains due to state waivers. Most all research surrounding Medicaid expansion reports that states experience coverage gains, reductions in
claim that legislation had an important spillover effect, also known as the “welcome mat effect,” which in turn increased enrollment. The welcome mat effect occurs when an expansion of a public program encourages individuals who were previously eligible for the program, but yet not enrolled, to now sign-up for the program. Hudson and Moriya (2017) find that Medicaid expansions increased coverage for children whose parents gained eligibility under the expansions by 5.7 percent.
However, a growing body of research suggests that Section 1115 waivers that target the expansion population cause coverage losses and may impact healthcare access. Several researchers studied Indiana’s waiver, the Healthy Indiana Plan 2.0, to determine its impacts on coverage gains. One study conducted by Freedman, Richardson, and Simon (2018), found that Indiana’s coverage gains were smaller than the gains in
expansion states. Coverage in Indiana grew by about 3 percent with Medicaid expansion and the waiver in place, compared to about 4 percent for expansion states. Another study by Sommers, Fry, Blendon, and Epstein (2018) similarly concluded that coverage rates were significantly higher in expansion states than in Indiana. Sommers et al. (2018) also assert the waiver program led to less affordable healthcare in Indiana than in expansion states. The findings from these two studies suggest that Medicaid expansion interventions may lead to unintended consequences for coverage and access.
Effects of Medicaid Expansion on Labor
One body of research observed increased employment as a result of expansion. Economic theory predicts that social programs with income-based eligibility will create positive behavioral responses to work effort (Dasgupta & Debraj, 1986; Banerjee, Hanna, Kreindler, & Olken, 2016). In other words, economic theory suggests that social
programs like Medicaid can provide workers with a basic enough living standard to be productive workers. Ward and Bridge (2019) corroborate this economic theory in their study regarding the impacts of Medicaid expansion in Montana. The authors observed a 1.3% increase in employment in Montana after Medicaid expansion (Ward & Bridge, 2019). Furthermore, a multi-state study found that after the ACA, individuals living in expansion states were significantly more likely to be employed than those in non-expansion states (Hall, Shartzer, Kurth, & Thomas, 2017). The study also observed that individuals in expansion states are 6% less likely to be unemployed due to a disability compared to those in non-expansion states (pg. 263).
Another stream of research found that Medicaid expansions do not significantly affect employment or labor participation. Callison and Sicilian (2016) examined
Medicaid expansions and how they affect individual labor market participation by race and ethnicity. The authors found that Medicaid expansions do not lead to increased labor force participation or employment for African American or Hispanic men or women after Medicaid expansions (pg. 318). However, the same study observed that labor market participation improved for white men and women after Medicaid expansions (pg. 318). Work by Kaestner, Garrett, Chen, Gangopadhyaya, and Fleming (2017) similarly
Medicaid expansion on the insurance coverage and labor supply of income and low-educated adults. While the authors found that the number of uninsured adults decreased with Medicaid expansion, the effects on labor supply are statistically insignificant (pg. 631).
One reason the research on labor participation and employment diverged is because studies measured different Medicaid populations. Ward & Bridge (2019), who observed positive effects in employment, controlled their regression analysis for the state, year, total population, population over age 65, population with a disability, population over age 25 with at least a bachelor’s degree, and total employment in the traded sector. Additionally, Hall et al. (2017) used difference-in-difference testing to assess
employment for adults with disabilities. On the other hand, Callison & Sicilian (2016), who found no statistical difference in employment, used race and ethnicity as a measure while Kaestner et al. (2017) observed the effects for low-income and low-educated adults.
Effects of Medicaid Expansion on Hospitals
Another stream of work in the Medicaid literature indicates that expansions improve hospital operating margins and overall financial performance for a variety of hospitals, including DSHs. Current research links improved financial performance and reductions in hospital closures to Medicaid expansions. Most recently, Rhodes,
89). Additionally, operating margins improved significantly for public hospitals and rural hospitals after expansion (pg. 89). Although a few years older than the work by Rhodes et al., Balvin (2016) and Dranove, Garthwaite, and Ody (2016) find comparable decreases in uncompensated care costs and increases in operating margins. Lindrooth, Perraillon, Hardy, and Tung (2018) showed that hospitals in states with Medicaid expansion experienced lower rates of closure than in non-expansion states. Further, the authors showed that hospitals have stronger financial performance, with improved hospital margins of about 33 percent in expansion states (Lindrooth, Perraillon, Hardy, & Tung, 2018). From a different perspective, Bai and Anderson (2016) provide additional evidence supporting the finding that Medicaid expansions improve hospitals’ financial standings. Bai and Anderson (2016) observed that expansions reduced bad-debt expenses and enhanced hospitals’ financial strength.
A subset of the hospital financial literature focuses specifically on DSHs. To investigate how hospitals would react to Medicaid expansions and cuts, Cole, Walker, Mora, and Diana (2014) evaluated hospitals’ financial strength in expansion and non-expansion states. The authors found that hospitals in non-non-expansion states face greater financial stress than hospitals in expansion states (Cole, Walker, Mora, & Diana, 2014). Of the hospitals in non-expansion states examined by Cole et al. (2014), 42.5% of them were in a weakened financial position due to Medicaid funding cuts. In a study to assess the impact of Medicaid expansion on DSH providers, Camilleri (2017) finds that
Work Requirements in Means-Tested Programs
This section of the literature review discusses the research about work requirements in two means-tested programs, the Supplemental Nutrition Assistance Program (SNAP)2 and Medicaid.
Effects of SNAP Work Requirements
One branch of research attempts to understand the connection between SNAP work requirements and program participation. Ku, Brantley, and Pillai (2019)
investigated data from over 2,000 United States counties from 2013 to 2017 and assessed the impact work requirements had on SNAP beneficiaries. Results from this study
indicated that work requirements reduced total SNAP participation and caused more than one-third of SNAP participants without dependents to lose benefits (pg. 1449)
Additionally, the authors reported that states which implemented work requirements saw a reduction of about $2.5 billion in federal SNAP benefits (pg. 1449). Other research by Stacy, Scherpf, and Jo (2018) suggests a decline in program participation with work requirements in place, and the authors observed a reduction of 3.1% in SNAP
participation for adults with no dependents. The study also noted stronger impacts for participants in high unemployment areas and those with a high school education or less (Stacy, Scherpf, & Jo, 2018).
2 The Supplemental Nutrition Assistance Program (SNAP) is a means-tested program run by the U.S.
Effects of Medicaid Work Requirements
Another branch of research explored Medicaid work requirements and their impact on coverage and hospitals’ finances. Arkansas was the first state to receive a Section 1115 waiver to implement Medicaid work requirements as a condition of eligibility, so current research assesses the impact of Medicaid work requirements in Arkansas. Sommers, Goldman, Blendon, Orav, and Epstein (2019), studied the changes in insurance coverage and employment within the first year of work requirement
implementation in Arkansas. Through surveys, the authors found that work requirements in Arkansas decreased Medicaid coverage by 13.2% and increased the uninsured rate by 4% (pg.1075). Although work requirements were associated with significant losses in health insurance coverage, Sommers et al. (2019) didn’t observe any significant change in employment or labor participation. This study was limited by its lower response rate than that of government surveys. Additionally, the Arkansas Department of Human services calculated that in the first 6 months of implementation, 25% of beneficiaries lost coverage (Arkansas Department of Human Services, 2018). Kentucky, a state currently in the process of petitioning for a Section 1115 waiver, forecasted that around 15% of the state’s Medicaid population would lose coverage under the proposed work requirements law (Office of the Governor of Kentucky, 2017).
work requirements in means-tested programs is limited, it suggests work requirements have negative impacts on program participation and downstream effects on providers.
Goals for this Research
METHODOLOGY
In this section of the thesis, I explain my question and hypotheses and the methods I used to analyze my research question. In particular, I outline my research question and hypotheses, define DSH providers and payments, explain uncompensated care costs, describe the baseline data used to assess hospitals’ financials, explain how I forecasted Medicaid enrollment in North Carolina with work requirements, and measured the impact on operating margins and uncompensated care costs. To conclude the
methodology section, I identify the limitations of my research design.
Question & Hypotheses
My research question attempts to answer how Medicaid work requirements will impact the payer mix, operating margins, and uncompensated care costs of
Disproportionate Share Hospitals in North Carolina. My research question is needed because it reframes the debate, and it flips what researchers have been asking. Instead of looking at the effects of Medicaid expansion, I ask what the implications of Medicaid restriction are. Overall, this research seeks to contribute new insights to the Medicaid work requirements debate by exploring the business implications of the proposed policy changes. I have five hypotheses for my research, which are described below.
First Hypothesis
number of uninsured discharges and increased the number of Medicaid discharges, with no significant changes in total discharges (Admon, et al., 2019; Martin, Hartman, Washington, & Catlin, 2017; Freedman, Nikpay, Carroll, & Simon, 2017; Sommers, Blendon, Orav, & Epstein, 2016). This research also suggests that Medicaid expansion increased the proportion of patients with Medicaid coverage and decreased the proportion of patients with private insurance (Admon, et al., 2019; Wu, et al., 2018; Nikpay,
Buchmueller, & Levy, 2016). Much of the current research indicates that Medicaid beneficiaries experience ‘churning,’ or in other words, those who lose Medicaid coverage experience permanent coverage loss or significant gaps in their coverage (Haught,
Dobson, & Luu, 2019; Garfield, Rudowitz, Orgera, & Damico, 2019).
Considering these findings, I assume that Medicaid patients who lost coverage simply end up as uninsured patients. The number of discharges remains the same after work requirements, but the numerators of the Medicaid and uninsured change with work requirements. The number of Medicaid patients will decrease with discharges constant, and the number of uninsured patients will increase with discharges constant. Because of this, I hypothesize that Medicaid work requirements will decrease the proportion of Medicaid patients and increase the proportion of uninsured patients.
Second Hypothesis
decrease in Medicaid patients and an increase in uninsured patients. Another body of research shows that hospitals saw revenues rise significantly due to fewer uninsured patients after Medicaid expansion (Rhodes, Buchmueller, Levy, & Nikpay, 2019; Camilleri, 2017). I hypothesize that due to payer shifts (explained in Hypothesis 1), revenues will decrease as work requirements move Medicaid patients from reimbursed patients to uninsured ones.
Third Hypothesis
Third, I hypothesize that hospitals’ costs will decrease. Hospital operating expenses (e.g., costs) are the total expenses incurred by a hospital for providing patient services to all patients. The cost to provide service to a Medicaid patient is the same as providing care for non-Medicaid patients (American Hospital Association, 2017). However, Medicaid only pays part of a Medicaid patient’s costs, 87 cents per dollar spent, and the hospital must absorb the costs that are not covered by Medicaid (American Hospital Association, 2017). I predict that a hospital’s operating costs will decrease because hospitals will have to treat fewer Medicaid patients after work requirements. Medicaid beneficiaries will be moved to uninsured patient status and their care will be acknowledged as uncompensated care costs, which is separate from a hospital’s operating margins.
Fourth Hypothesis
hospitals lose money by providing services to Medicaid patients. Hospitals receive 87 cents for every dollar spent providing services to Medicaid patients, with more than two-thirds of hospitals receiving Medicaid payments less than the cost of delivering care (American Hospital Association, 2019). However, a Medicaid patient costs the same to treat as a non-Medicaid patient (American Hospital Association, 2017). In other words, it is more expensive for hospitals to provide services to Medicaid patients than the revenues they receive from them. While work requirements would cause hospitals to lose revenue from the displaced Medicaid patients, I predict hospitals’ costs would be reduced at a greater rate since hospitals would no longer have to cover the difference between Medicaid reimbursements and patient costs. As mentioned in the hypothesis below and the DSH uncompensated care costs section, I separate operating margins from
uncompensated care costs. I assume that patients still seek medical care from hospitals but as uninsured patients, and therefore I do not factor those costs into operating margins. Fifth Hypothesis
Lastly, I hypothesize that uncompensated care costs will increase due to Medicaid work requirements. Uncompensated care costs, which are a part of a hospital’s operating costs, are the health care or services hospitals provide that do not get reimbursed. Often, uncompensated care costs arise when people do not have insurance and cannot afford to pay the cost of care. Medicaid beneficiaries who lose coverage because of work
(Haught, Dobson, & Luu, 2019). As a result of this lockout, large portions of recipients will be uninsured or have extended gaps in their coverage, which increases
uncompensated care costs.
Other research shows that Medicaid expansions reduces the uninsured rates at hospitals and uncompensated care costs, with larger decreases in uncompensated care costs at disproportionate-share hospitals (Rhodes, Buchmueller, Levy, & Nikpay, 2019; Admon, et al., 2019; Camilleri, 2017). On the other side, studies find that for states that did not expand Medicaid, uncompensated costs increased (Price & Eibner, 2013). Considering the research, I hypothesize that Medicaid work requirements will increase uncompensated care costs since individuals are moved from Medicaid to uninsured status.
Disproportionate Share Hospitals & DSH Payments
As defined by The Health Resources & Services Administration (2019), Disproportionate Share Hospitals (DSH) “…serve a significantly disproportionate number of low-income patients and receive payments from the Centers for Medicaid and Medicare Services to cover the costs of providing care to uninsured patients.” The goal of the DSH payments is to improve access for Medicaid and uninsured patients (Medicaid and CHIP Payment and Access Commission, 2019). First, states receive DSH payments from the federal government to offset DSH hospitals’ cost of providing care to Medicaid patients. Federal law then requires each state’s Medicaid program to make DSH
2019). The Social Security Act sets two methods for a hospital to qualify as a DSH hospital. A hospital is designated as a DSH hospital in one of two ways:
1) If a large urban hospital demonstrates more than 30% of their total net inpatient care revenues go towards providing indigent care3.
2) If a hospital’s DSH Patient Percentage Equation exceeds 15% (Centers for Medicare & Medicaid Services, 2020). See Appendix B for a full explanation of the DSH Patient Percent Equation.
I chose to examine DSH hospitals because a majority of hospitals in North Carolina are classified as DSH providers. Around 70% of all hospitals in North Carolina are classified as DSH providers (Centers for Medicare & Medicaid Services, 2020)4.
Baseline Data and Identifying DSH Hospitals in North Carolina
My research methodology employs a quantitative approach by using Medicaid data. The quantitative approach I used relied on available data from Medicare Hospital Cost Reports (MHCRs) from the fiscal years 2014 – 2015 and 2015 – 2016 (Centers for Medicare & Medicaid Services, 2020). Any provider that receives Medicaid payments is required by law to submit an annual cost report to the Centers for Medicare & Medicaid Services (Centers for Medicaid and CHIP Services, 2020). MHCRs contain valuable data about all hospitals in North Carolina, such as facility characteristics, total costs, total revenues, uncompensated care costs, Medicaid charges, and other financial statement data (Centers for Medicare & Medicaid Services, 2015). Next, I cross-referenced the MHCR data with a list of DSH locations released by the NC Department of Health and
3 Indigent care is used to define care towards individuals who are uninsured and/or are not eligible for
government health care coverage such as Medicaid or Medicare.
Human Services (NC Medicaid Division of Health Benefits, 2019). Cross-referencing the data allowed me to identify and pull out information for only DSH providers.
Forecasting Medicaid Enrollment in North Carolina after Work Requirements After considering the hospital financial data, I used four case studies to evaluate the impact of work requirements. The first case study examines how work requirements reduce program participation and benefits in the Supplemental Nutrition Assistance Program (SNAP). The study is relevant to my Medicaid research since both SNAP and Medicaid are means-tested programs. The results are helpful to estimate how Medicaid enrollment in North Carolina is impacted by work requirements (Ku, Brantley, & Pillai, 2019). The second case study is from Kentucky, which forecasted how the state’s Medicaid population would lose coverage under the proposed work requirements law. Kentucky’s work requirement law has similar language as the proposed North Carolina law, and it projects the Medicaid population which will lose coverage under the law (Office of the Governor of Kentucky, 2017). These forecasts are helpful to estimate how Medicaid enrollment in North Carolina is impacted by work requirements. Both the third and fourth case studies contain results from Arkansas’ implementation of work
requirements. Arkansas can be used as a case study due to the similar language and benefit structure of the work requirement laws as the proposed North Carolina law. Although the two laws are similar, the financial effects on hospitals in Arkansas can’t be directly imposed on hospitals in North Carolina because of differences in the number of DSH hospitals per state. In Arkansas, 5% of the hospitals in the state are classified as DSH as compared to 70% of hospitals in North Carolina (Medicaid and CHIP Payment and Access Commission, 2019). Since DSH providers serve a large number of Medicaid recipients and low-income individuals, it’s important to research the difference North Carolina hospitals could see as result of Medicaid work requirements.
I believe examining these four case studies is important because it gives a more holistic view of how North Carolina Medicaid beneficiaries would be impacted by work requirements. I averaged the coverage losses from each study and found that
implementation of work requirements, on average, leads to a 14% decrease in coverage. I use the 14 % average in my primary analysis and then run situational analyses to show how Medicaid in North Carolina would react under each scenario. For this thesis, I assume that all individuals who lose coverage move to uninsured status. The four case studies, one from another means-tested program, one forecast, and two implementation studies from Arkansas, help me forecast different scenarios for North Carolina.
to determine the effects on operating margins. Equation 1 shows the steps of how coverage loss is calculated.
Equation 1: Calculating potential coverage loss
1) Use the Medicare Hospital Cost Reports to determine the number of Medicaid discharges per hospital.
2) Evaluate the number of Medicaid recipients subject to work requirements that would lose Medicaid coverage in N.C. based on the average coverage loss of the four case studies
Since Medicaid work requirements are relatively new and data is still being collected on their effects, I decided to run a situational analysis to show how DSH providers reacted under different forecasts. I used the two Arkansas case studies to demonstrate how DSH providers would be affected, as well as the projections from Kentucky’s work requirements proposal. Examining different projections of the financial effects gives a more holistic view of how hospitals will react under different
circumstances. The language laws from Arkansas and Kentucky are nearly identical to the language of the North Carolina law, making it easier to compare the states.
Examining payer mix of DSH hospitals
The steps outlined above are essential for me to understand the Medicaid
Examining operating margins of DSH hospitals
After I determined the impact to payer at DSH providers, I examined how the coverage loss affects hospital performance in North Carolina. I hoped to determine DSH hospitals’ financial well-being by observing each hospitals’ operating margin before and after Medicaid work requirements are enacted. Operating margins is a measure routinely used by researchers and policymakers to measure hospital performance (Rhodes,
Buchmueller, Levy, & Nikpay, 2019; Bai & Anderson, 2016). The following section outlines how I determined the operating margins for DSH providers.
Operating Margin
I focused on operating margin in this thesis because the operating margin is generated from hospitals’ core business and it is more comparable across hospitals than total profit. For my study, Hospital Operating Margin is defined as net income from patient care (i.e. patient services) divided by net patient revenue. Patient care includes revenues from hospitals’ inpatient, outpatient, and Medicaid-related services. Equation 1 illustrates how operating margin will be calculated both before and after Medicaid work requirements:
Equation 2: Operating Margin
!"# %&#'"(# )"*"(+" − -.#&/ %&#'"(# 01"2&#'(3 451"(6"6 !"# %&#'"(# )"*"(+"
Revenues and Costs
To calculate the operating margin for a hospital, I first calculated the changes in revenues and costs. Accounting for differences in coverage with work requirements in place, I determined hospitals’ costs and revenues from the hospital data obtained earlier. The data from CMS contains total revenues, net Medicaid revenues, operating costs, net Medicaid charges, and hospital discharges for Medicaid recipients. Total patient revenue is defined as the total amount of income generated from providing services to patients. Net Medicaid patient revenue is the total amount of income a hospital receives from the federal government from providing services to Medicaid patients, less the costs of providing service to those patients. Hospital operating expenses are the total expenses incurred by a hospital for providing services to patients, both Medicaid and non-Medicaid. I used the following equation to calculate changes to revenues and costs: Revenues
Equation 3: Revenue per Medicaid discharge
!"# %"&'()'& *"+",-".
%"&'()'& /'.(0)12". = Average Medicaid Revenue per patient
I calculate the Revenue per Medicaid discharge by dividing the net Medicaid revenues by the number of Medicaid discharges. I do this to determine the average revenue a hospital brings in per Medicaid discharge.
Equation 4: Revenue per non-Medicaid discharge
!"# 3)#'",# *"+",-".4%"&'()'& *"+",-".
discharges. I do this to determine the average revenue a hospital brings in per non-Medicaid discharge.
Equation 5: Hospital Revenues after Medicaid work requirements ("#$%&'%$ )%*&ℎ',-#* (./) 1 /#2#34# 5#, "#$%&'%$ 5'6%#36) +
(7896': )%*&&ℎ',-#* (./) − "#$%&'%$ )%*&ℎ',-#* (./)< 1 /#2#34# 5#, $%*&ℎ',-# = Total Hospital Revenue
Costs
Equation 6: Operating Expense per discharge
89"1)#',2 :;9",.".
56#)7 /'.(0)12". = Average Operating Expense per discharge
I calculate the Operating Expense per discharge by dividing the total Operating Expenses by the total number of discharges. By doing this, I am able to see the average operating expense it costs to treat each patient.
Equation 7: Operating Expenses after Medicaid work requirements
Examining uncompensated care costs of DSH hospitals Uncompensated Care Costs
Uncompensated care costs are services provided by hospitals that do not get reimbursed (Centers for Medicare & Medicaid Services, 2020). Uncompensated care costs arise when patients do not have insurance or cannot afford the cost of medical care. There are two types of uncompensated care:
• Charity care: the hospital does not charge the patient at all, or charges the patient at a discounted rate below the hospital’s cost of delivering care
• Bad Debt: the hospital charges the patient but is not able to collect payment
Uncompensated care is the sum of charity care and bad debt. Since hospitals vary in their policies regarding charity care, there is no clear distinction between charity care and bad debt (Rhodes, Buchmueller, Levy, & Nikpay, 2019). Therefore, in this thesis, I analyze uncompensated care as a combined measure rather than each component. I also measure uncompensated care costs as a percent of operating expenses since uncompensated care is a measure of forgone revenue. Measuring uncompensated care as a percent of a hospital’s operating expenses is common in this area of research (Rhodes, Buchmueller, Levy, & Nikpay, 2019; Garcia, Thompson, Howard, & Pink, 2018).
For my honors thesis, unlike other research, I kept uncompensated costs separate from operating margins in my analysis. Scholars commonly factor in uncompensated care costs to total operating expenses although hospitals categorize these two costs separately (Haught, Dobson, & Luu, 2019; Rhodes, Buchmueller, Levy, & Nikpay, 2019;
programs, such as DSH payments or CHIP, to offset these costs. Factoring
uncompensated care costs into the operating expenses and operating margins, overstates the cost of providing care, and thereby overstates both measures. I decided to measure operating margins and uncompensated care costs separately because it gives a more holistic view of how work requirements would affect different parts of hospitals’ financials.
Equation 8: Uncompensated Care Costs
(Operating Expense per patient discharge x (Total discharges – Total discharges after Medicaid work requirements)) + Uncompensated Care Costs
A full list of equations and assumptions can be found in Appendix D.
Limitations
My study is not without its limitations, and I anticipate a few of them with my proposed methodology. One limitation of this study is that this is a projection. Since North Carolina has not yet implemented Medicaid work requirements, there is no definitive number of how Medicaid enrollment will change. The actual enrollment change could be higher or lower than the average I use in my methodology. Since I am forecasting how North Carolina hospitals would react, I cannot assert causality. I plan to incorporate a situational analysis of high and low estimates based on the case studies to get a better view of how work requirements impact hospitals (Appendix D).
RESULTS
In this section, I hope to provide a high-level analysis of how work requirements impact hospitals’ payer mix, operating margins, and uncompensated care costs. The analysis explores fiscal years 2014 – 2015 and 2015 – 2016, to understand how financials change as work requirements are imposed.
Prior to my analysis, I omitted all hospitals in North Carolina that the state did not identify as DSH providers. From the 2014 – 2015 DSH list, I dropped 10 DSH designated hospitals because they had missing values that were critical for the analysis (e.g. Net Revenue from Medicaid). Additionally, I removed 2 observations in which operating margins had absolute values of 100% or greater. I removed the same number of
Fiscal Year 2014-2015
The first year of data I examined was from 2014 – 2015. This results subsection shows the overall payer mix, operating margins, and uncompensated care costs before and after Medicaid work requirements.
Payer mix before Medicaid work requirements
I calculated the payer fix for hospitals from this financial year by dividing the total number of Medicaid discharges by the total number of hospital discharges. I then averaged the 88 hospitals’ payer mixes to find the average payer mix at hospitals before work requirements. As shown in the Figure 1 below, on average, 21 % of hospital discharges are Medicaid patients, 40% are Medicare patients, and 39% are neither. For the purposes of this study, 21% of hospital discharges are Medicaid patients and 79% are non-Medicaid patients.
Figure 1: Payer mix before Medicaid work requirements
21%
40% 39%
% Hospital Discharges that are Medicaid
% of Hospital Discharges that are Medicare
Payer mix after Medicaid work requirements
I then calculated the impact work requirements would have on the number of Medicaid discharges at hospitals. I repeated the steps above and divided the number of Medicaid discharges with Medicaid work requirements by the total number of hospital discharges after work requirements. Figure 2 below shows the average payer mix at hospitals after Medicaid work requirements are implemented. After work requirements, 19 % of hospital discharges are Medicaid patients, 39% are Medicare patients, and 40% are neither. Medicaid patient discharges are 19% of the payer mix and non-Medicaid patient discharges are 81%. After Medicaid work requirements, Medicaid discharges decreased by 2% and discharges of non-Medicaid patients increased by 2%.
Figure 2: Payer Mix after Medicaid work requirements
19%
42% 39%
% Hospital Discharges that are Medicaid (WR)
% of Hospital Discharges that are Medicare
Operating Margins
Revenues before Medicaid work requirements
I calculated the percent of hospital revenue per patient type by dividing Net Medicaid Revenue by the Net Patient Revenue. I then averaged the 88 hospitals’ payer mixes to find the average percent of hospitals revenues by patient type before work requirements. Figure 3 below shows that 8% of a hospital’s revenues comes from Medicaid patients and 92% of revenues
come from all other patients.
Figure 3: % Revenue per type of patient before Medicaid Work Requirements
8%
92%
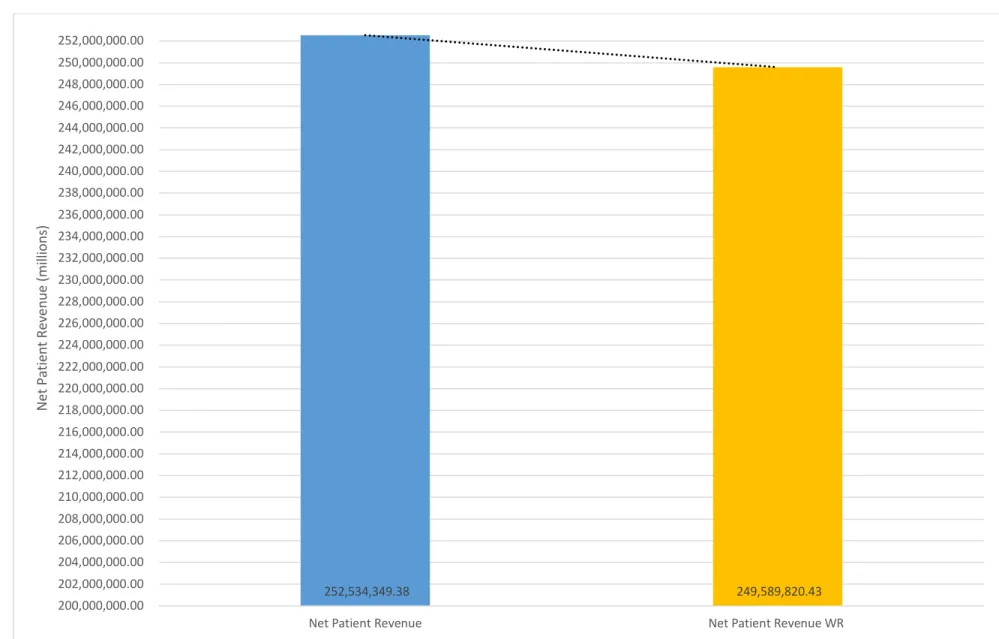
Revenues after Medicaid work requirements
I then calculated the impact work requirements would have on the percent of hospital revenue per patient. In Figure 4 below, the percent of hospital revenues generated per patient type are shown. After work requirements, 7% of a hospital’s revenues comes from Medicaid patients and 93% of revenues come from all other patients. With work requirements in place, the percent of hospital revenue that comes from Medicaid patients decreases by 1%. Figures 5 and 6 show hospitals’ average net Medicaid revenue and average total revenue before and after Medicaid work
requirements. Net Medicaid Revenue decreases by 14% after work requirements, as shown in Figure 5 below. Average total revenues for hospitals decreased by 1.17% with work requirements in place, as displayed in Figure 6.
Figure 4: % Revenue per type of patient before Medicaid Work Requirements
7%
93%
% Revenue from Medicaid Patients WR
Figure 5: Net Medicaid Revenue before and after Medicaid work requirements
21,032,349.62 18,087,820.67
1,000,000 2,000,000 3,000,000 4,000,000 5,000,000 6,000,000 7,000,000 8,000,000 9,000,000 10,000,000 11,000,000 12,000,000 13,000,000 14,000,000 15,000,000 16,000,000 17,000,000 18,000,000 19,000,000 20,000,000 21,000,000
Net Revenue from Medicaid Net Revenue from Medicaid WR
Figure 6: Average Total Net Revenue before and after Medicaid work requirements
252,534,349.38 249,589,820.43
200,000,000.00 202,000,000.00 204,000,000.00 206,000,000.00 208,000,000.00 210,000,000.00 212,000,000.00 214,000,000.00 216,000,000.00 218,000,000.00 220,000,000.00 222,000,000.00 224,000,000.00 226,000,000.00 228,000,000.00 230,000,000.00 232,000,000.00 234,000,000.00 236,000,000.00 238,000,000.00 240,000,000.00 242,000,000.00 244,000,000.00 246,000,000.00 248,000,000.00 250,000,000.00 252,000,000.00
Net Patient Revenue Net Patient Revenue WR
Costs before and after Medicaid work requirements
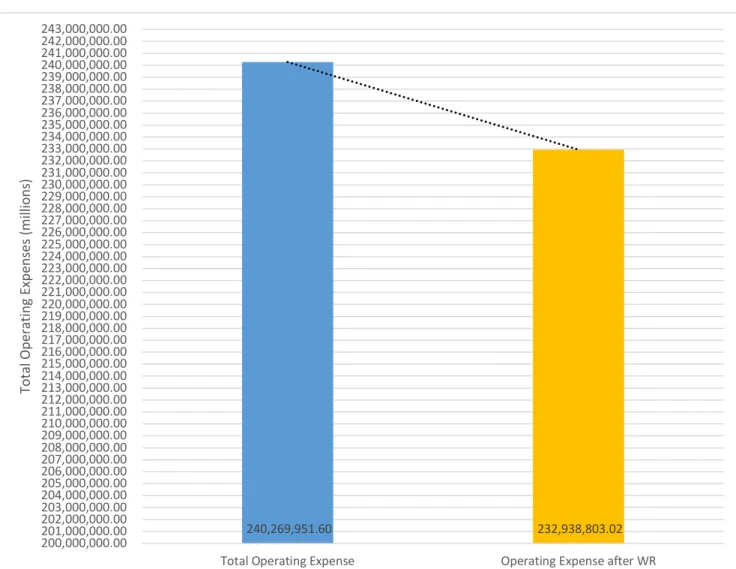
After I calculated the revenues for hospitals, I analyzed the operating expenses. In
Figure 7 below, I show the change in operating expenses before and after Medicaid work
requirements. Operating expenses decreased from around $240 million to $232 million,
or a 3.05% decrease in expenses.
Figure 7: Operating Expenses before and after Medicaid work requirements
240,269,951.60 232,938,803.02
200,000,000.00 201,000,000.00 202,000,000.00 203,000,000.00 204,000,000.00 205,000,000.00 206,000,000.00 207,000,000.00 208,000,000.00 209,000,000.00 210,000,000.00 211,000,000.00 212,000,000.00 213,000,000.00 214,000,000.00 215,000,000.00 216,000,000.00 217,000,000.00 218,000,000.00 219,000,000.00 220,000,000.00 221,000,000.00 222,000,000.00 223,000,000.00 224,000,000.00 225,000,000.00 226,000,000.00 227,000,000.00 228,000,000.00 229,000,000.00 230,000,000.00 231,000,000.00 232,000,000.00 233,000,000.00 234,000,000.00 235,000,000.00 236,000,000.00 237,000,000.00 238,000,000.00 239,000,000.00 240,000,000.00 241,000,000.00 242,000,000.00 243,000,000.00
Total Operating Expense Operating Expense after WR
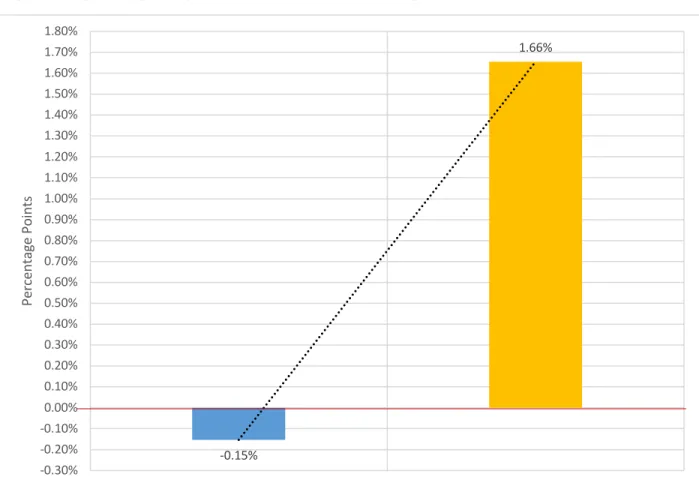
Overall Effects on Operating Margins
I show revenues and costs above to show how each component factors into
hospital operating margins. Before work requirements the average operating margins for
hospitals in North Carolina was -0.15%. After work requirements, operating margins
increase to 1.66%, an average increase of 1.81 percentage points. Figure 8 displays the
changes in operating margins with Medicaid work requirements in place.
Figure 8: Operating Margins before and after Work Requirements
-0.15% 1.66% -0.30% -0.20% -0.10% 0.00% 0.10% 0.20% 0.30% 0.40% 0.50% 0.60% 0.70% 0.80% 0.90% 1.00% 1.10% 1.20% 1.30% 1.40% 1.50% 1.60% 1.70% 1.80% Per cen ta ge Po in ts 1
Uncompensated Care Costs before and after Medicaid work requirements
First, I calculated the raw uncompensated care costs for hospitals. Figure 9 below
shows uncompensated care costs before and after Medicaid work requirements.
Uncompensated care increased 40.26% from around $18 million per hospital to over $25
million after work requirements. Additionally, I calculated uncompensated care costs for
hospitals as a percent of total operating expenses. As mentioned in the methodology
section, measuring uncompensated care costs against total operating costs is a common
measure in this area of research. I show the change in the percentage of uncompensated
care costs as a percent of total operating expenses in Figure 11 below. Figure 11 shows
uncompensated care costs as percent of total operating expenses increases by 3.38
percentage points from 9.45% to 12.83%.
Figure 9: Total Uncompensated Care Costs before and after Medicaid work requirements
18,209,972.74 25,541,121.31
2,000,000.00 4,000,000.00 6,000,000.00 8,000,000.00 10,000,000.00 12,000,000.00 14,000,000.00 16,000,000.00 18,000,000.00 20,000,000.00 22,000,000.00 24,000,000.00 26,000,000.00 28,000,000.00
Total Unreimbursed and Uncompensated Care Uncompensated Care Costs after WR
Figure 10: Percentage Point change in Uncompensated Care Costs
9.45%
12.83%
0.00% 1.00% 2.00% 3.00% 4.00% 5.00% 6.00% 7.00% 8.00% 9.00% 10.00% 11.00% 12.00% 13.00% 14.00%
1 2
Per
cen
ta
ge
Po
in
ts
Fiscal Year 2015-2016
The second year of data I examined was from 2015 – 2016. This results
subsection shows the overall payer mix, operating margins, and uncompensated care
costs before and after Medicaid work requirements.
Payer mix before Medicaid work requirements
I calculated the payer mix for hospitals in fiscal year 2015 – 2016 using the same
steps as from fiscal year 2014 – 2015. Figure 12 shows that across hospitals, an average
of 22% of hospital discharges are Medicaid patients, 40% are Medicare patients, and 38%
are neither. Conclusively, 22% of hospital discharges are Medicaid patients and 78% are
non-Medicaid patients.
Figure 11: i
22%
40% 38%
% Hospital Discharges that are Medicaid
% of Hospital Discharges that are Medicare
Payer mix after Medicaid work requirements
I then calculated the impact work requirements would have on the number of
Medicaid discharges at hospitals. Figure 13 below shows the average payer mix at
hospitals after Medicaid work requirements are implemented. After work requirements,
20 % of hospital discharges are Medicaid patients, 41% are Medicare patients, and 39%
are neither. Medicaid patient discharges are 20% of the payer mix and non-Medicaid
patient discharges are 80%. In fiscal year 2015 – 2016, the same as in 2014 – 2015,
Medicaid discharges decreased by 2% and discharges of non-Medicaid patients increased
by 2%.
Figure 12: Payer Mix after Medicaid work requirements
20%
41% 39%
% Hospital Discharges that are Medicaid (WR)
% of Hospital Discharges that are Medicare
Operating Margins
Revenues before Medicaid work requirements
I calculated the percent of hospital revenue per patient type by dividing Net
Medicaid Revenue by the Net Patient Revenue. I then averaged the 88 hospitals’ payer
mixes to find the average percent of hospitals revenues by patient type before work
requirements. Figure 14 below shows that 8% of a hospital’s revenues comes from
Medicaid patients and 92% of revenues
come from all other patients, similar to the previous fiscal year.
Figure 13: % Revenue per type of patient before Medicaid Work Requirements
8%
92%
% Revenue from Medicaid Patients
Revenues after Medicaid work requirements
I then calculated the impact work requirements would have on the percent of
hospital revenue per patient. In Figure 15 below, the percent of hospital revenues
generated per patient type are shown. After work requirements, 7% of a hospital’s
revenues comes from Medicaid patients and 93% of revenues come from all other
patients. With work requirements in place, the percent of hospital revenue that comes
from Medicaid patients decreases by 1%. Figures 16 and Figure 17 show hospitals’
average net Medicaid revenue and average total revenue before and after Medicaid work
requirements. Net Medicaid Revenue decreases by 14% after work requirements, as
shown in Figure 16 below. Average total revenues for hospitals decreased by 1.15% with
work requirements in place, as displayed in Figure 17.
Figure 14: Revenue per type of patient before Medicaid Work Requirements
7%
93%
% Revenue from Medicaid Patients WR
Figure 15: Net Medicaid Revenue before and after Medicaid work requirements
22,635,470.08 19,466,504.27
1,000,000.00 2,000,000.00 3,000,000.00 4,000,000.00 5,000,000.00 6,000,000.00 7,000,000.00 8,000,000.00 9,000,000.00 10,000,000.00 11,000,000.00 12,000,000.00 13,000,000.00 14,000,000.00 15,000,000.00 16,000,000.00 17,000,000.00 18,000,000.00 19,000,000.00 20,000,000.00 21,000,000.00 22,000,000.00 23,000,000.00 24,000,000.00
Net Revenue from Medicaid Net Medicaid Patient Revenue WR
Figure 16: Average Total Net Revenue before and after Medicaid work requirements
274,680,503.39 271,511,537.58
200,000,000.00 202,000,000.00 204,000,000.00 206,000,000.00 208,000,000.00 210,000,000.00 212,000,000.00 214,000,000.00 216,000,000.00 218,000,000.00 220,000,000.00 222,000,000.00 224,000,000.00 226,000,000.00 228,000,000.00 230,000,000.00 232,000,000.00 234,000,000.00 236,000,000.00 238,000,000.00 240,000,000.00 242,000,000.00 244,000,000.00 246,000,000.00 248,000,000.00 250,000,000.00 252,000,000.00 254,000,000.00 256,000,000.00 258,000,000.00 260,000,000.00 262,000,000.00 264,000,000.00 266,000,000.00 268,000,000.00 270,000,000.00 272,000,000.00 274,000,000.00 276,000,000.00 278,000,000.00 280,000,000.00
Net Patient Revenue Net Patient Revenue WR
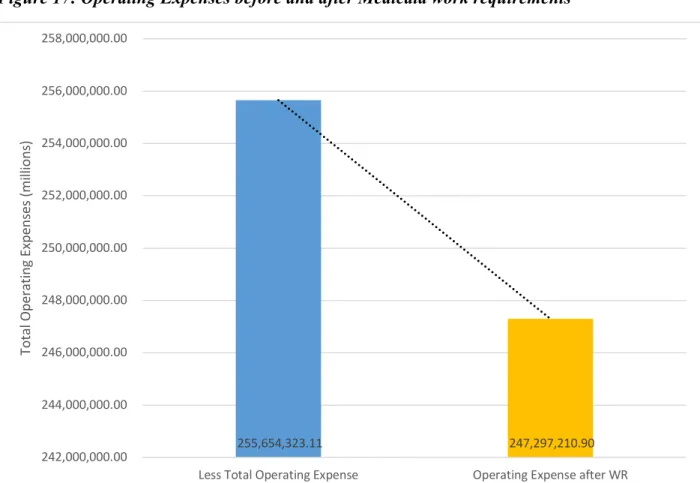
Costs before and after Medicaid work requirements
After I calculated the revenues for hospitals, I analyzed the operating expenses. In
Figure 18 below, I show the change in operating expenses before and after Medicaid
work requirements. Operating expenses decreased from around $255 million to $247
million, or a 3.27% decrease in expenses.
Figure 17: Operating Expenses before and after Medicaid work requirements
255,654,323.11 247,297,210.90
242,000,000.00 244,000,000.00 246,000,000.00 248,000,000.00 250,000,000.00 252,000,000.00 254,000,000.00 256,000,000.00 258,000,000.00
Less Total Operating Expense Operating Expense after WR
Tot
al
O
pe
rat
ing
Expe
nse
s
(m
ill
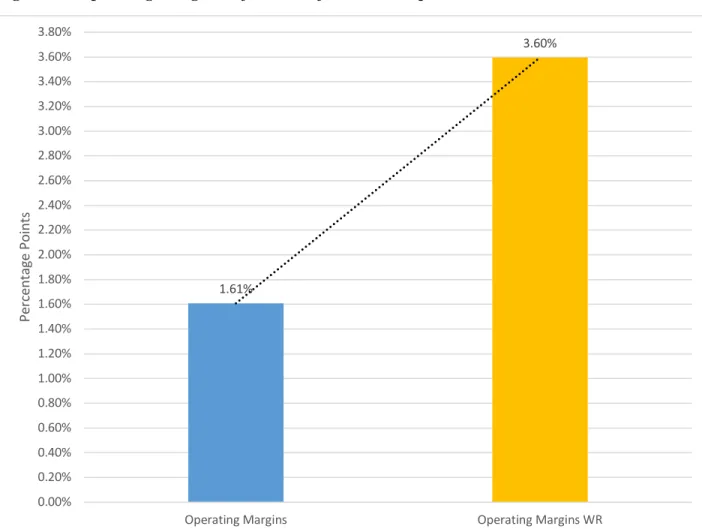
Overall Effects on Operating Margins
I show revenues and costs above to show how each component factors into
hospital operating margins. Before work requirements the average operating margins for
hospitals in North Carolina was -1.61%. After work requirements, operating margins
increase to 3.60%, an average increase of 1.99 percentage points. Figure 19 displays the
changes in operating margins with Medicaid work requirements in place.
Figure 18: Operating Margins before and after Work Requirements
1.61% 3.60% 0.00% 0.20% 0.40% 0.60% 0.80% 1.00% 1.20% 1.40% 1.60% 1.80% 2.00% 2.20% 2.40% 2.60% 2.80% 3.00% 3.20% 3.40% 3.60% 3.80%
Operating Margins Operating Margins WR
Uncompensated Care Costs before and after Medicaid work requirements
First, I calculated the raw uncompensated care costs for hospitals. Figure 9 below
shows uncompensated care costs before and after Medicaid work requirements.
Uncompensated care increased 50.43% from around $16 million per hospital to over $24
million after work requirements. Additionally, I calculated uncompensated care costs for
hospitals as a percent of total operating expenses. As mentioned in the methodology
section, measuring uncompensated care costs against total operating costs is a common
measure in this area of research. I show the change in the percentage of uncompensated
care costs as a percent of total operating expenses in Figure 20 below. Figure 20 shows
uncompensated care costs as percent of total operating expenses increases by 3.27
percentage points from 8.71% to 11.98%.
Figure 19: Total Uncompensated Care Costs before and after Medicaid work requirements
16,572,999.32 24,930,111.54
2,000,000.00 4,000,000.00 6,000,000.00 8,000,000.00 10,000,000.00 12,000,000.00 14,000,000.00 16,000,000.00 18,000,000.00 20,000,000.00 22,000,000.00 24,000,000.00 26,000,000.00 28,000,000.00
Figure 20: Percentage Point change in Uncompensated Care Costs
8.71%
11.98%
0.00% 1.00% 2.00% 3.00% 4.00% 5.00% 6.00% 7.00% 8.00% 9.00% 10.00% 11.00% 12.00% 13.00%
Cost of uncomensated care as operating % patient
DISCUSSION
In this section, I discuss the key implications of the results from my study. I
divide up the discussion section by the three main areas of analysis: payer mix, operating
margins, and uncompensated care costs. I also explore some of the limitations of my
research in the following section. The situational analysis in Appendix C shows how
DSH providers could react under different circumstances.
Effects on Payer Mix at Hospitals
Based on the results from the 2014 – 2015 and 2015 – 2016 fiscal years, the payer
mix shifted with the introduction of work requirements. In both years, the percentage of
Medicaid discharges per hospital decreased by 2%, and the percentage of non-Medicaid
discharges increased by 2%. Research from Medicaid expansion suggested that
expansion increased the proportion of patients with Medicaid coverage and decreased the
proportion of patients with private insurance (Admon, et al., 2019; Wu, et al., 2018;
Nikpay, Buchmueller, & Levy, 2016). My findings suggest that Medicaid work
requirements would results in changes in payer mix for DSH hospitals, with reductions in
payers covered by Medicaid and increases in patients with no expected source of
payment. The total volume of hospitals appears to decrease as patients are ‘crowded-out’
Effects on Hospital Operating Margins
Effects on Revenues
The findings from this study suggest that for DSH providers, Medicaid work
requirements reduce revenue because patients who lost their Medicaid coverage will no
longer have their services reimbursed by Medicaid. Medicaid revenues appear to be hit
the hardest by the implementation of work requirements, with hospitals seeing an average
of a 14% decrease in Medicaid revenues. The data implies that total net patient revenues
decrease between 1.15 and 1.17 percentage points as a result of the reduction in Medicaid
revenues. Findings from current work requirements research suggest that Medicaid
revenues at hospitals fall by 10 to 11% (Haught, Dobson, & Luu, 2019). My research
agrees with previous studies, and it suggests that hospitals’ Medicaid and total revenues
decrease as a result of the decrease in Medicaid patients and an increase in uninsured
patients.
Effects on Expenses
Similar to revenues, the study indicates that costs for DSH are reduced after
Medicaid work requirements by between 3.05% and 3.27%. Costs for providing service
to Medicaid patients and non-Medicaid patients remained the same with work
requirements in place. This study suggests that the payer shift moving away from
Medicaid patients decreases a hospital’s operating expenses because there are fewer
Overall Effects on Operating Margins
Overall, operating margins appear to increase as a result of Medicaid work
requirements because the decrease in operating expenses is greater than the decrease in
revenues. The data in my study shows that Medicaid patients bring in less revenue per
discharge than non-Medicaid patients, and it appears that Medicaid patients’ costs exceed
the reimbursement rates. Therefore, a reduction in the number of these patients will
increase the overall margins. The results suggest that hospital operating margins improve
because the costs of treating Medicaid patients are greater than the revenues they
generate.
Hospital Uncompensated Care Costs
My analysis suggests that uncompensated costs will increase if Medicaid work
requirements are implemented. The total uncompensated care costs increased by 40.26%
and 50.43% in fiscal years 2014 – 2015 and 2015 – 2016, respectively. These increases
translate to a 3.38 and a 3.27 percentage point increase in uncompensated care costs as a
percent of total operating expenses. Not only do uncompensated care costs increase after
work requirements, but they also become a more significant part of total operating
expenses for hospitals. Increases in uncompensated care appear to be affected by shifts in
payer mix. Individuals that are moved from Medicaid to uninsured status, so those
patients are no longer able to cover their hospital care expenses. Hospitals are required by
law to provide care to patients, regardless of insurance status, and those care expenses are