CHARACTERIZATION OF ARBOVIRAL DISEASE IN WESTERN NORTH CAROLINA
John Whitworth Wallace
A dissertation submitted to the faculty of the University of North Carolina at Chapel Hill in partial fulfillment of the requirements for the degree of Doctor of Philosophy in the Department of
Epidemiology.
Chapel Hill 2015
ii © 2015
iii ABSTRACT
John Whitworth Wallace: Characterization of arboviral disease in western North Carolina (Under the direction of Steven R. Meshnick)
La Crosse encephalitis (LACE) is the most commonly reported mosquito-borne illness in North Carolina, and the annual incidence of LACE in NC is among the highest in the nation—North Carolina accounts for 25% of all LACE cases reported to the Centers for Disease Control and Prevention (CDC) from 2008-2012. Within North Carolina, LACE is reported from western NC, with 7 mountain counties in the southwestern portion of the state accounting for over 90% of all cases in NC since 2000. LACE is commonly found in rural, wooded areas, where peridomestic environments are conducive to mosquito exposure, but few epidemiologic studies have quantified the association between peridomestic habitat and LACE.
Using a cohort of 501 patients tested for arboviral disease at MHS, the risk of LACE was compared based on demographic and peridomestic risk factors including age, gender, rural residence, peridomestic land cover, type of home, and number of objects around the home. Of the 69 cases, the majority were white, non-Hispanic, and under the age of 16 with clinically measured fever, headache, vomiting, and altered mental status. Upon adjustment for age, the risk of LACE among those living in forested rural areas was 2.55 times the risk among those living in non-forested or urban areas (95% confidence interval: 1.59, 4.09).
Confirmed and probable cases of LACE in NC, identified from historical reportable disease surveillance data from 2000-2012, were aggregated at the county and census tract-level to determine the extent and location of spatial clusters of LACE cases. Spatial scan statistics generated from
iv
western NC. The clusters identified in this study occur at the sub-county level, and may not have been identified using traditional county-level analyses.
v
ACKNOWLEDGEMENTS
There are so many people I’d like to thank for their support and guidance throughout the evolution of this dissertation. I am so grateful to have a dissertation advisor, Dr. Steve Meshnick, who has been a strong advocate for me and the pursuit of this research. He has been an incredible mentor throughout both my coursework and my dissertation, offering insight and guidance during this research and additional projects. Dr. Meshnick has fostered my interests in vector-borne disease and provided opportunities for continued research in this field, and I look forward to further work with him. I would also like to thank Dr. Jen Horney for her endless support and advocacy throughout my entire career at UNC—I interviewed for a position at the Center for Public Health Preparedness in my senior year of undergrad and have been fortunate to have had her guidance as a supervisor, mentor, and friend since that time. Finally, I’d like to thank Dr. Charles Poole for his guidance and advocacy as my academic advisor within the Department—his vast knowledge of epidemiologic principles and methods has been an incredible resource for me and other students, but it is his continued support throughout my academic endeavors that I am most appreciative.
vi
and spatiotemporal statistics is incredibly overwhelming, but his ability to translate it into approachable, teachable, practical concepts has been of great use for this research and future endeavors. Dr. Mike Emch, who joined the committee on short notice, has added substantial technical knowledge and advice for the approach to spatial analytics within this dissertation. I am grateful for his interest, expertise, and timely, thoughtful feedback during the final year of this dissertation. Lastly, I’d like to thank Dr. David Weber, who has contributed so much substantive knowledge regarding La Crosse Encephalitis and clinical data. Dr. Weber has been an inspiration from his encyclopedic knowledge of infectious diseases and hospital epidemiology, and his assistance with review of and submission of manuscripts has been much appreciated. This was a truly multi-disciplinary committee and I was fortunate to have the knowledge and expertise of each member contributing to phases of this dissertation.
This project would not have been possible without the support of several other individuals and institutions. Dr. Sheri Denslow initiated this project in her work at Mission Health System, and this dissertation was an extension of her initial work. Dr. Denslow was the project coordinator and was responsible for my work while at Mission Health System, providing countless hours of supervision, assistance, and consultation throughout the project, and I am ever grateful for her support. I also would like to thank Mission Health System for sponsoring me as an intern and the NC Division of Public Health for hiring me as an employee during much of this work. Lastly, I’d like to thank Dr. Brian Byrd for his expertise and support of this research from Western Carolina University and from the NC Mosquito and Vector Control Association, and look forward to the potential work that may come from this
dissertation.
vii
TABLE OF CONTENTS
LIST OF TABLES ... x
LIST OF FIGURES ...xi
LIST OF ABBREVIATIONS ... xii
1. INTRODUCTION ... 1
A. Overview ... 1
1. Characteristics of La Crosse virus infections ... 1
2. La Crosse virus transmission dynamics ... 3
3. Surveillance of La Crosse Encephalitis ... 5
4. Occurrence of La Crosse Encephalitis ... 7
B. Risk factors of La Crosse Encephalitis ... 9
1. Demographic risk factors of La Crosse Encephalitis... 9
2. Peridomestic risk factors of La Crosse Encephalitis ... 11
3. Summary of risk factors ... 14
C. Spatial analysis of La Crosse Encephalitis ... 15
1. Principles of mapping La Crosse Encephalitis data ... 16
2. Spatial clustering of La Crosse Encephalitis ... 18
2. SPECIFIC AIMS ... 21
viii
A. Characterization of La Crosse Encephalitis patients and evaluation of
risk factors among Mission Health System patients, 2010-2012... 24
1. Study design ... 24
2. Study population ... 25
3. Outcome assessment ... 27
4. Demographics and other covariates ... 29
5. Exposure assessment ... 30
6. Human subjects research and data management ... 34
7. Data analysis ... 35
8. Statistical Power ... 36
B. Analysis of spatial trends of LACE incidence in western NC ... 38
1. Study Design ... 38
2. Study Population ... 39
3. Identification of La Crosse Encephalitis cases ... 40
4. Human subjects research ... 40
5. Calculation of incidence measures ... 41
6. Data analysis ... 42
4. MANUSCRIPT 1: RISK FACTORS ASSOCIATED WITH LA CROSSE ENCEPHALITIS IN WESTERN NORTH CAROLINA, 2010-2012 ... 44
A. Overview ... 44
B. Introduction ... 45
C. Materials and Methods ... 46
ix
E. Discussion ... 51
F. Conclusions ... 53
5. MANUSCRIPT 2: SPATIAL CLUSTERING OF LA CROSSE ENCEPHALITIS IN WESTERN NORTH CAROLINA, 2000-2012 ... 60
A. Overview ... 60
B. Introduction ... 61
C. Methods ... 63
D. Results ... 66
E. Discussion ... 68
6. SUMMARY ... 77
A. Characterization of La Crosse Encephalitis patients and evaluation of risk factors among Mission Health System patients, 2010-2012... 77
1. Summary of findings ... 77
2. Public health implications... 77
3. Future research ... 78
B. Analysis of spatial trends of La Crosse Encephalitis incidence in western NC, 2000-2012 ... 79
1. Summary of findings ... 79
2. Public health implications... 79
3. Future research ... 80
x LIST OF TABLES
Table 1. National Notifiable Disease Surveillance System (NNDSS) case
definitions in use during the study period ... 27 Table 2. Demographic characteristics of confirmed and probable LACE cases
(n=69) and full cohort (n=501), Mission Health System, 2010-2012 ... 54 Table 3. Clinical and laboratory characteristics of confirmed and probable LACE
cases (n=69), Mission Health System, 2010-2012 ... 55 Table 4. Potential risk factors for LACE measured among the Mission Health
System subcohort (n=409), 2010-2012 ... 56 Table 5. Crude and adjusted risk ratios for peridomestic risk factors for LACE
among the Mission Health System subcohort (n=409), 2010-2012... 57 Table 6. Characteristics of reported cases to NC DPH and included in the spatial
xi
LIST OF FIGURES
Figure 1. Diagram of the La Crosse virus transmission cycle ... 4 Figure 2. Average annual incidence of neuroinvasive California Serogroup virus,
by county, 1996-2010 ... 8 Figure 3. Annual number of confirmed and probable LACE cases in North
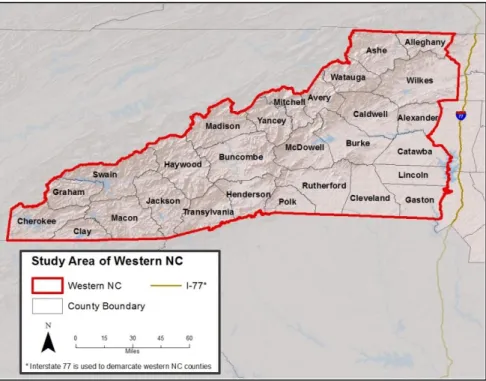
Carolina, 1990-2011 ... 9 Figure 4. Counties within the western North Carolina study area ... 26 Figure 5. Statistical power to detect a risk ratio varying exposure prevalence
given a sample size of 409 for peridomestic exposes of rural
residence, forested habitat, and their joint effect ... 38 Figure 6. Mission Health System hospital facilities throughout western NC in
2012 ... 58 Figure 7. Month of symptom onset for patients tested for LACE, Mission Health
System, 2010-2012. ... 59 Figure 8. Annual sum of LACE cases reported to NC DPH, 2000-2012 ... 72 Figure 9. County (a) and census tract (b) incidence density from LACE cases
reported to NC DPH, 2000-2012 ... 74 Figure 10. Spatial clustering assessed for unadjusted (a) and adjusted (b) LACE
xii
LIST OF ABBREVIATIONS CDB Communicable Disease Branch
CDC Centers for Disease Control and Prevention CI Confidence interval
CSF Cerebrospinal fluid
CSTE Council of State and Territorial Epidemiologists DAG Directed acyclic graph
EBCI Eastern Band of the Cherokee Indians EEE Eastern Equine Encephalitis
EIA Enzyme immunoassay
GIS Geographic information systems IFA Indirect fluorescent antibody
IgG Immunoglobulin G
IgM Immunoglobulin M
IRB Institutional Review Board
LAC La Crosse
LACE La Crosse Encephalitis MHS Mission Health System
NC North Carolina
NCDHHS North Carolina Department of Health and Human Services NCDPH North Carolina Division of Public Health
NCEDSS North Carolina Electronic Disease Surveillance System NCSLPH North Carolina State Laboratory for Public Health NLCD National Land Cover Dataset
xiii
PY Person-years
RR Risk ratio
SLE Saint Louis Encephalitis
UA Urban area
UC Urban cluster
US United States
1 CHAPTER 1 INTRODUCTION A. Overview
Arthropod-borne viruses, referred to as arboviruses, are the cause of sporadic outbreaks of neurological disease throughout the world.1-3 Arboviruses are predominantly transmitted by mosquitoes and ticks, with the majority of arboviruses in the United States (US)—domestic arboviruses—
transmitted to humans by mosquitoes. Historically, the domestic arboviral infections that have caused significant human illness are western equine encephalitis (WEE), eastern equine encephalitis (EEE), St. Louis encephalitis (SLE), and La Crosse encephalitis (LACE).4 More recently, the emergence of West Nile virus (WNV) in the US and the threat of Dengue and Chikungunya emergence from the tropics have renewed attention to arboviral disease.5,6 LACE is the most frequently reported arboviral disease in North Carolina (NC), and investigation into the risk factors and occurrence of disease in NC can help reduce the burden of LACE and, potentially, other emergent diseases in NC.3
1. Characteristics of La Crosse virus infections
2
encephalitis in the US, and is the second most prevalent domestic arboviral disease in the US, behind WNV.4,10-12
In the early investigations of LACE in Wisconsin, Thompson and Evans (1965) conducted a serologic survey of 637 Wisconsin residents and found laboratory evidence of California encephalitis virus infection in 25.9% of samples, with the highest prevalence in outdoor workers and those living in rural areas. An additional finding of this study was that acute meningo-encephalitis occurs in only a “small percentage” of those infected.8 This initial finding of mild or asymptomatic infections has been shown in numerous additional studies, resulting in the general consensus that the majority of LAC infections present as mild febrile illness or are asymptomatic.4,13-16 Because infections may be asymptomatic, LAC disease implies the clinical expression of LAC infection, as described below.
Although infection with LAC virus is thought to be asymptomatic in most individuals, those who become ill develop febrile illness with symptoms including headache, fever, chills, nausea, vomiting, and lethargy. LAC disease may also present more severely as neuroinvasive LAC disease, referred to as LACE. LACE is characterized by neuroinvasive symptoms including nuchal rigidity, altered mental status, seizures, coma, and paralysis in addition to the symptoms of LAC disease. The presentation of LACE is similar to that of enteroviral meningitis and herpes simplex encephalitis, with the former likely to occur in similar seasons as LACE.17 The differentiation between LAC disease and LACE is the neuroinvasive presentation that occurs with LACE.
3
from management of symptoms.19 Fatalities due to LAC disease are rare, occurring in less than 1% of cases.20
LACE primarily occurs in children under the age of 15, representing approximately 90% of reported cases in previous studies.3,12,14 The association with infection in younger patients is unique to LACE, as other mosquito-borne diseases such as SLE and WNV primarily affect individuals over the age of 40.12 In animal models of LACE, younger age was associated with higher viremia, which may explain the severity of disease and occurrence of encephalitis among children.3
2. La Crosse virus transmission dynamics
Most arboviruses are maintained through a natural zoonotic transmission cycle between hematophagous (blood feeding) arthropods and susceptible non-human vertebrate hosts. Infected arthropod vectors transmit virus by feeding on and infecting susceptible vertebrate hosts, where the infected host produces viremia sufficient to transmit to other vectors. Vectors feed on infected hosts and transmit virus to other susceptible hosts. Additionally, some arboviruses, including LAC virus, are transmitted transovarially and venereally between vectors. While humans and domestic animals are often infected, they generally do not play a role in the transmission cycle and are referred to as “dead-end” hosts.4,21
LAC virus has 3 transmission cycles: horizontal transmission between infected mosquitoes and susceptible mammalian hosts, horizontal venereal transmission between infected mosquitoes and susceptible mosquitoes, and vertical transmission between infected mosquitoes and their progeny.4,22-24 The LAC transmission cycle shown in Figure 1 from McJunkin et al (1998) and reproduced in Alatoom and Payne (2009) demonstrates these routes of transmission.22,23 The primary vector of LAC is the eastern treehole mosquito (Aedes triseriatus), an aggressive daytime biting container-breeding
4
mammals including eastern chipmunks (Tamias striatus), the eastern gray squirrel (Sciurus carolinensis) and red foxes (Vulpes vulpes), which serve as amplifiers for the virus, maintaining a sufficient viral load to facilitate transmission of virus to vectors that feed upon the amplifying host.4,24,26
Figure 1. Diagram of the La Crosse virus transmission cycle.23
The vectors and primary hosts of LAC are commonly found in eastern deciduous forest habitats and maintain the disease transmission cycle in their natural habitats. Vertical transmission,
5
and fragmented forest provide suitable habitat for small mammals including the LAC reservoir species, maintaining the disease transmission cycle both in forested and residential areas.29
In 1999, Gerhardt et al identified the first occurrence of natural LAC infection in the exotic Asian Tiger mosquito (Aedes albopictus), followed by the identification of LAC infection in the exotic Aedes japonicus mosquitoes in 2011.30,31 These species have demonstrated vector competence in transmitting LAC in the laboratory, and could be important accessory vectors in the transmission of LAC.31,32 Both these exotic vectors are aggressive daytime biting mosquitoes, similar to Ae triseriatus, but are well-adapted to peridomestic areas around homes where, unlike Ae triseriatus, they prefer to breed in sunlit containers.29 Such commensalism among these vectors increases the abundance of mosquitoes in the peridomestic habitat, and therefore may increase the risk of LAC in endemic areas.
Another important consideration within the LAC transmission cycle is seasonality. While the virus over-winters in infected mosquito eggs, mosquitoes are inactive in the colder months of the year. The result is a distinctive seasonality for LAC and other arboviruses, with little or no new infections over the winter and highest incidence periods during the late-summer from July to September when
arthropods are most active.4,12,24
3. Surveillance of La Crosse Encephalitis
Although the first case of human encephalitis attributed to California serogroup viruses did not occur until 1963, surveillance of human encephalitis, including California encephalitis and other
arboviruses, has been conducted by the Centers for Disease Control and Prevention (CDC) since 1955. State health departments would submit annual reports to CDC on patients with confirmed infection with arboviral encephalitis, often including the laboratory evidence, date of onset, county of residence, age, and sex of the patient.14,16 The reporting and classification of disease was similar to the current
6
based on a standardized case definition. The current case definition was developed in 1990 by the CDC and the Council of State and Territorial Epidemiologists (CSTE) and has been revised over time in 1996, 2001, 2004, 2011, and lastly in 2014.12,33
The 2014 case definition classifies LACE cases as either confirmed or probable, where a
confirmed case meets clinically compatible symptoms for neuroinvasive disease and at least one of the following, as specified by the CDC in the National Notifiable Diseases Surveillance System (2014):
(i) Isolation of virus from, or demonstration of specific viral antigen or nucleic acid in, tissue, blood, CSF, or other body fluid, OR
(ii) Four-fold greater change in virus-specific quantitative antibody titers in paired sera, OR
(iii) Virus-specific IgM antibodies in serum with confirmatory virus-specific neutralizing antibodies in the same or a later specimen, OR
(iv) virus-specific IgM antibodies in CSF and a negative result for other IgM antibodies in CSF for arboviruses endemic to the region where the infection occurred
A probable neuroinvasive case meets clinically compatible symptoms for neuroinvasive disease and virus-specific IgM antibodies in CSF or serum but with no other testing. The clinically compatible symptoms for neuroinvasive disease are physician documented meningitis, encephalitis, acute flaccid paralysis, or other signs of central or peripheral neurologic dysfunction, and absence of a more likely clinical explanation.34 Fever ≥100.4°F (38°C), as reported by the patient or clinician, has been a requirement of past case definitions, but was dropped from the 2014 case definition due to inconsistencies in reporting across states.35,36
7
disease cases by local health departments throughout North Carolina, with serologic testing of suspected arboviral disease cases submitted to the State Laboratory of Public Health (NCSLPH) by healthcare providers throughout the state.37 For LACE, unfortunately, no state-supported mosquito surveillance is conducted in NC, due in part to the recent elimination of the Public Health Pest Management section within the NC Department of Environment and Natural Resources. Human surveillance, therefore, is the sole source of LAC virus surveillance. After case investigation by local health departments, NCDPH classifies the potential cases as confirmed, probable, suspect, or non-cases based on the CDC case definitions. These case reports are housed within NCDPH and are reported to CDC on a regular basis.
4. Occurrence of La Crosse Encephalitis
The geographic distribution of LACE was originally focused in the upper Midwest states of Ohio, Wisconsin, Minnesota, Illinois, and Iowa, which accounted for 88.8% of the 1,348 reported LACE cases from 1963-1981.14 The number of reported cases per year was relatively stable from 1963-1992, with an average of 70 cases per year in the US; however, a review of LACE cases from 1999-2007 reported an average of just under 100 cases per year.4,12 In addition to the increase in the number of cases, a geographical shift in the distribution of cases has resulted in an increased number of cases in the southeastern US. West Virginia, Ohio, North Carolina, and Tennessee accounted for 81% of all 754 LACE cases reported from 2003-2012, although areas of Wisconsin, Minnesota, and Illinois remain endemic and have continued to report recent cases of LACE.3
8
existence of the virus.4 These focal areas are evident when viewing the county-level incidence of LACE reported to CDC from 1996-2010 (Figure 2).38
Figure 2. Average annual incidence of neuroinvasive California Serogroup virus, by county, 1996-2010.38
Within North Carolina, there has been a general increase in the number of confirmed and probable LACE cases identified, with 199 cases reported from 1990-2010 (Figure 3).38 Eighty-nine percent of those cases were reported after 1998. The highest burden of reported disease occurs in western North Carolina, as shown in Figure 2, with very low incidence in the rest of the state. In a review of the LACE cases reported from 2003-2012, the high incidence in NC was driven by 7 counties in
9
Figure 3. Annual number of confirmed and probable LACE cases in North Carolina, 1990-2011.
B. Risk factors of La Crosse Encephalitis
Many risk factors for LAC infection are well known and supported in the literature. Demographic risk factors such as age and gender have strong associations with LAC infection and are thought to be classic characteristics of the disease. Similarly, ecological risk factors that contribute to mosquito exposure, and in particular, Ae triseriatus habitat, have long been considered risk factors for infection, although
potential changes in the disease transmission cycle, such as the influence of Ae albopictus, may alter the influence of the known ecological risk factors. Additional risk factors in recent research are more related to sociodemographic factors that are associated with infection.
1. Demographic risk factors of La Crosse Encephalitis
The age distribution of LACE cases is one of the hallmarks of the disease, where children are disproportionately more likely to develop encephalitis from LAC infection. In a review of nationally reported encephalitis cases associated with California serogroup infections from 1963-1981, McGowan
et al (1973) and Kappus et al (1983) characterized risk groups for LACE, most prominently identifying children under the age of 15, who made up over 90% of the cases. Less than 30% of cases were under
0 5 10 15 20 25 30 35
1990 1995 2000 2005 2010
N u m b e r o f R e p o rte d Cases
10
the age of 5 and less than 2% were infants less than one year of age.14,16 In more recent studies, children remain the most frequently reported age group, with 88% of cases under the age of 18 in a review of nationally reported cases of LACE from 2003-2012.3 Possible explanations for this demographic trend are thought to be due to host-related susceptibility, differences in virulence and pathogenesis, and differential exposure to vectors.3,12
Gender is another commonly cited risk factor for disease, where males are more likely to develop LACE than females. The initial studies of LACE in Wisconsin identified a higher prevalence of disease among males, primarily due to their employment in outdoor work environments or attendance at summer forestry camps, with a higher proportion of incident infections discovered in younger males.8 These results remained consistent throughout reviews of surveillance data from 1963 – 1981 by McGowan et al (1973) and Kappus et al (1983), and persists throughout most studies of LAC, most recently reported in studies of disease in areas of Tennessee (60% male), West Virginia (60% male), and North Carolina (70% male).14,16,39-41 In a review of all neuroinvasive California serogroup virus cases reported to CDC from 1999-2007, the incidence of LACE in males was 1.5 times greater than the
incidence of infection in females (95% CI [derived]: 1.31, 1.72).12 The common explanation given for this association is that males are more likely to have exposure to mosquitoes through various outdoor activities (e.g., boys playing outside more than girls), although the explanations given at the time tend towards potentially gender-biased suppositions rather than scientific evidence.14 Current studies do show, however, that this gender distribution is not exclusive to LACE—reportable disease data from 1999-2007 identify greater incidence of WNV, SLE, and EEE in males as compared to females.12
11
interesting case study, where a high incidence of disease occurs among American Indians living within the Qualla Boundary of the Eastern Band of the Cherokee Indians.42,43 This incidence is most likely due to the surrounding environment, rather than a differential expression of disease among American Indian populations. This case study does, however, reinforce the importance of the ecological aspects and geographic location of LACE.
2. Peridomestic risk factors of La Crosse Encephalitis
The risk factors for LACE closely follow the ecological facets of the disease, where exposure to Ae triseriatus habitat in endemic areas is the primary risk factor. Mosquito exposure is a function of
personal behaviors and the surrounding environment. Within studies of vector-borne disease, therefore, much attention is given to the peridomestic environment—the area around the home, which can be the most frequent source of mosquito exposure.
The most established risk factors for LACE are rural residence and exposure to or residence in forested habitat. These risk factors are ecologically well-founded given the sylvatic transmission cycle of LAC virus. The initial studies of LACE in Wisconsin by Thompson et al (1965) found a high prevalence of LACE seroconversion among young men working in forestry camps, and noted that many of these individuals lived in rural areas of Wisconsin where exposure to mosquitoes was assumed to be higher.8 Several years later, a large seroprevalence study in Minnesota by Monath et al (1970) identified significantly higher proportions of seroprevalence among rural patients when compared to urban patients.44 Cases of LACE have also been reported from individuals residing in suburban areas, providing further evidence that LACE is more prevalent in non-urban settings.45
12
fully examined. As a follow-up to the early LACE studies, Thompson and Gundersen (1983) identified higher rates of seroconversion among individuals living in rural forested habitat when compared to rural and non-forested urban areas of known endemicity east of La Crosse, WI.46 Cases originating from forested areas was also cited by Thompson et al (1965).
The drawback of many of these studies, however, was that almost all of these studies lacked a suitable comparison group for statistical analysis and many were small sample case series or
seroprevalence studies with little focus on incident cases.8,9,13,42-46 These studies, arguably, established a preponderance of evidence for the association between LACE and rural and forested areas, but no statistically rigorous epidemiologic studies of LACE occurred prior to 1992.
The lack of epidemiologic evidence in support of the ecological risk factors of LACE is attributable more to the difficulties in designing a study to assess the risk factors of LACE rather than the quality of prior research. With no large scale outbreaks and widespread occurrence of disease, obtaining a
sufficient sample size of LACE cases must occur over the course of multiple years or over large areas that may capture different locations of focal disease. For this reason, disease surveillance registries have been used to identify cases of disease, but the use of surveillance registries presents its own difficulty in defining a suitable comparison group. Studies by Woodruff et al (1992) and Erwin et al (2002) are the few investigations to use methodologically valid comparison groups allow for the calculation of risk, or, in the case of case-control studies, an approximation of risk from odds.39,47
13
significant in the multivariate model, including at least six containers within 300 feet of the home (OR=4.1, 95% CI: 0.4, 40.3), at least 10 tires within 300 feet of the home (OR=3.2, 95% CI: 0.9, 11.9), and forest less than 50 feet from the home (OR=3.2, 95% CI: 0.5, 21.2).47 This finding is in line with previous research that artificial and natural containers allow for an increase in mosquitos, and therefore, a potential increase in LACE prevalence.
Erwin et al (2002) tested many of these peridomestic risk factors in a cohort study of suspected LACE cases in patients in eastern Tennessee in the summer of 2000. Erwin identified incident LACE in 16 of 40 participants and evaluated the clinical, environmental, and entomological characteristics of LACE. Similar to findings by Woodruff et al (1992), this study determined that the presence of at least one treehole near the residence was associated with an increase in LACE risk (RR=3.96, 95% CI: 1.04, 14.99). Time spent outdoors was also a significant risk factor, with a mean of 5.9 hours spent outdoors among the infected and a mean of 4.0 hours among the uninfected (mean difference=1.93, 95% CI: 0.28, 3.59). The significant risk factors identified in this research, time spent outdoors and treeholes near the residence, support the ecologic factors of LACE transmission and are an important step in identifying individuals at risk of LACE.
Other peridomestic, domestic, and behavioral risk factors were explored in these epidemiologic studies, with no significant findings. The presence of window screens and use of insect repellant were both assessed by Woodruff et al (1992) and Erwin et al (2002), with no clear association between LACE and the risk factors under study.39,47 Other non-significant risk factors evaluated by Woodruff et al
14
resulting in a reliance on windows that may or may not contain window screens. No studies, to our knowledge, have examined the relationship between home construction and LACE.
Another methodologic approach to the challenges of studying LACE is an ecological study, where cases and their characteristics are aggregated within a measured geographical area. Haddow et al (2011) used this methodology to examine demographic and socioeconomic risk factors for LACE incidence in census tracts in West Virginia. Reported cases from 2003-2007 surveillance records were used to calculate the incidence of LACE infection for each census tract in West Virginia. Discriminant analysis was used to evaluate the predictive ability of census demographics for LACE incidence among census tracts. LACE incidence was higher in census tracts that were less educated, lower in housing density, and built before 1970.48 Few other studies have examined socioeconomic factors, although Woodruff et al
(1992)did identify and adjust for confounding by education in their analysis.47
The primary limitation of the study by Haddow was the methodological implication of using aggregate data. Individual-level conclusions drawn from this study, and from all aggregate studies, are susceptible to ecologic bias, where it is assumed that the characteristics of the group (census tract) are representative of the characteristics of the individuals under study. While the assumption of
homogeneity among groupings is commonly cited as a solution to ecologic bias, individual-level studies are preferable.49
3. Summary of risk factors
15
presence of treeholes as the lone exception. Rural residence and residence in forested areas are
historically cited as risk factors, but few studies have specifically evaluated and quantified their effect on LACE risk. Proximity to forest edge and artificial containers around the yard have variable evidence in support of their role as risk factors for LACE. Other peridomestic factors such as home condition, yard condition, presence of window screens in homes, and have shown no associations.
Future studies of risk factors of LACE should focus on obtaining a sufficient number of cases and suitable comparison groups. Risk factors should be measurable at the individual level, rather than the aggregate level. The emergence of LACE in the southeastern US, given the biology of the disease
transmission cycle, may be facilitated by human encroachment into hardwood forests, so ecological risk factors remain important to the understanding of LACE risk.
C. Spatial analysis of La Crosse Encephalitis
Mapping of case counts, incidence, and risk factors has been used since the first review of arboviral encephalitis cases by McGowan in 1973. Case counts and incidence maps are useful in
quantifying or determining the presence or absence of disease across a geographical area, while maps of risk factors are useful in identifying areas where an increased risk of infection may occur. Point maps, which identify the locations of points within a geographical area, were originally used to identify cases and locations of disease activity, but these methods often compromise the confidentiality expected with medical records. As a result, the majority of maps generated are choropleth maps aggregated by areas defined by administrative boundaries at the state, county, or local scale.50,51 Aggregate-level mapping and analyses must be conducted and interpreted with caution to avoid ecologic bias and several other problems with data aggregated within a particular area.
16
Statistical tests of spatial data provide a more reliable and valid means of identifying geographic patterns or trends in the mapped data. These methods generally test whether there is geographical heterogeneity within the area of interest while accounting for variability within the data. The results of these analyses, therefore, identify statistically significant trends and patterns within geographic data.
1. Principles of mapping La Crosse Encephalitis data
With respect to LACE surveillance data, aggregation by state provides little information on the true burden of disease due to the focal nature of LAC virus. Surveillance data reported by CDC at the county-level clearly identify counties of high incidence, which allows for the visual assessment of these focal areas in relation to the entire county (Figure 2). However, in analyses at finer spatial scales it is often important to aggregate cases of disease among smaller administrative areas such as census tracts or census block groups. The application of LACE incidence rates to an entire county population assumes that disease risk is homogenous throughout the county, or that assumption is at least implied in the visual interpretation. With respect to LACE, however, the knowledge of vector and host habitat,
geographical variability, and human populations indicate that disease risk may vary throughout a county or geographic area. This is also a problem with mapping within areal units—defining LACE risk and incidence based on county or other administrative boundaries can lead to inaccurate characterizations of risk, as habitat, geographical features, and areas of disease do not adhere to administrative
boundaries.
17
scales if necessary. The second limitation of aggregate data is that of the small number problem, where fine-scale aggregates and rates with small populations are greatly influenced by single occurrences of disease. The result of the small number problem is unstable rates that fluctuate due to variations in population, and the solutions are to either increase the aggregation at a loss of resolution or use smoothing techniques that incorporate neighboring values.50,53 The problems outlined above require careful consideration during analysis to prevent fallacious interpretations of spatially aggregated data.
Due to the highly focal nature of LAC virus transmission, county-level scales do not sufficiently characterize the occurrence of LACE. In a study of LACE incidence and spatial scale, Haddow et al (2009) examined incidence calculated at the county and census tract levels among different population
denominators. Using the denominator of children 15 years or younger, county incidence ranged from 0-226.5 annual cases per 100,000 persons, with a median of 41.5 annual cases per 100,000, while the incidence at the census tract level ranged from 50-673.9 annual cases per 100,000 persons, with a median of 126.7 annual cases per 100,000.54 These findings support other calls for finer scale analysis of vectorborne disease surveillance data at the census tract level by Eisen and Eisen.55
18 2. Spatial clustering of La Crosse Encephalitis
Mapping of disease data allows for visualization of data within geographic areas and allows for crude visual assessment of trends and patterns across space. Statistical tests of spatial data provide a more valid and reliable means of recognizing geographic trends and patterns. For example, while the areas of high incidence shown in the national distribution of LACE cases Figure 1 may be readily apparent, statistical tests provide a more rigorous analysis that accounts for variability within the population and within the measured data. For a highly focal disease like LACE, natural clusters of disease are likely to occur in endemic areas, and spatial cluster analysis is a method to detect areas of high risk throughout the area of interest.
Spatial clusters of disease are areas with a high concentration of cases relative to the surrounding area, and the principle dates back before John Snow’s cholera investigations. Spatial clustering, by definition, implies areas of heterogeneity throughout the area of interest. Methods exist to detect clustering at global and local scales, testing whether or not clustering exists within an area and where those clusters exist. In the general sense, these spatial cluster statistics test whether or not the disease is evenly distributed across the area of interest. Spatial cluster analyses are commonly used in spatial epidemiologic investigations, both for chronic diseases and infectious diseases, particularly in investigations of social or environmental factors.
19
high or low disease.57 This study was able to identify 3 clusters of high incidence in central Illinois to allow for targeted public health interventions within these areas.56
Studies of LACE clustering in Tennessee, West Virginia, and throughout the US by Haddow have used similar methodologic approaches to identifying areas of high risk. In a review of ArboNet data at the national level, Haddow and Odoi (2009) used Anselin’s local indicators of spatial association (LISA) to identify significant areas of high incidence in counties in West Virginia, Ohio, Tennessee, Wisconsin, and NC.10 Within Tennessee, Haddow et al (2009) examined clustering at a finer scale, using LISA to detect clusters within census tracts, and this approach was repeated in West Virginia by Haddow et al (2011), both finding areas of significant high incidence.48,54 While the LISA and Getis-Ord statistics are able to identify areas with high spatial autocorrelation, they are limited in that they do not readily account for population variance across the study area and do not allow for the adjustment of confounders and other covariates.
The Kulldorff scan statistic is another method of identifying local clusters of disease, and allows for variability within the population to detect areas of high incidence and allows for covariate-adjusted scanning methods. In an additional analysis of the West Virginia LACE data, Haddow et al (2011) used the Kulldorff scan statistic to identify clusters of high incidence at the census tract level, achieving similar results as with the LISA method.40 The Kulldorff scan statistic, implemented in SaTScan software (Silver Spring, MD) is ideal for detecting clusters of rare diseases, and it has very high power in detecting clusters in rural areas.58 The covariate adjustment afforded by SaTScan allows for the control of risk factors, which may introduce confounding if not distributed evenly across the study population.
The ability to identify areas of high LACE risk will allow for targeted public health
20
21 CHAPTER 2 SPECIFIC AIMS
La Crosse Encephalitis (LACE) is the most commonly reported mosquito-borne illness in North Carolina (NC), and the annual incidence of LACE in NC is among the highest in the nation. North Carolina accounts for 25% of all LACE cases reported to the Centers for Disease Control and Prevention (CDC) from 2008-2012. In North Carolina, LACE is primarily reported from western NC, with 7 mountain counties in the southwestern portion of the state accounting for over 90% of all reported cases in NC since 2000. North Carolina has a state-wide enhanced passive surveillance system that relies on health care providers, diagnostic laboratories, and local health departments to report cases of LACE to the NC Division of Public Health (NCDPH), a division of the NC Department of Health and Human Services (NCDHHS).
The distribution of LACE is thought to be the result of human encroachment into highly focal areas of enzootic transmission. LACE is commonly found in rural, wooded areas where peridomestic environments are conducive to mosquito exposure, but few epidemiologic studies have quantified the association between peridomestic risk factors and LACE. Demographic risk factors, particularly age and gender, may confound the relationship between peridomestic variables and LACE. Studies within areas of historically high incidence present the opportunity to obtain a sufficient number of cases and a suitable comparison group for epidemiologic analysis into associations between LACE and select risk factors.
22
and identify spatial clusters of high incidence within the study area. The specific aims this investigation are to:
1. Characterize cases of LACE identified at Mission Health System (MHS) from 2010-2012 and evaluate demographic and peridomestic risk factors associated with disease
2. Analyze spatial trends of LACE in historical reportable disease surveillance data and identify areas of high LACE incidence in western NC
A cohort of 501 individuals tested for arboviral disease at MHS in Asheville, NC from January 1, 2010 to NCDPH was retrospectively reviewed to address aim 1. A case-series investigation was conducted among all MHS cohort patients meeting the criteria for confirmed and probable LACE, and the
demographic, clinical, and laboratory characteristics of disease were summarized. A cohort study of the entire MHS cohort quantified the association of LACE and demographic and peridomestic risk factors. Specifically, we assessed the relationship between LACE risk and habitat type within a radius of the home, residence in a rural or urban setting, the type of home, and the number of potential containers around the home, all of which are thought to play a role in exposure to LACE and its vectors.
To identify spatial trends of LACE in western NC, 228 individuals with confirmed or probable LACE reported to the NCDPH from 2000-2012 were used to calculate incidence at the county and census tract level. Data at the census tract scale allowed for the identification of localized clusters of LACE at finer spatial scales than the commonly reported county incidence measures. Spatial scan statistics were used to detect the size and location of spatial clusters of high LACE incidence within western NC. These clusters were adjusted for known confounders and population variance that would otherwise inhibit the identification of LACE incidence clusters.
23
those with a high number of containers around the home. For the spatial analysis of NCDPH LACE data, we hypothesized that the incidence of LACE was not distributed evenly across western NC, and spatial clustering exists in focal areas throughout the region.
24 CHAPTER 3 RESEARCH STRATEGY
A. Characterization of La Crosse Encephalitis patients and evaluation of risk factors among Mission Health System patients, 2010-2012
1. Study design
To address study aim 1, a case-series investigation was implemented to summarize the cases of LACE and a cohort analysis was used to evaluate and quantify the associations of demographic and peridomestic risk factors to LACE. These investigations were conducted within retrospectively reviewed medical records in collaboration with MHS in Asheville, NC, and NCDPH.
The case-series investigation was limited to those individuals with a physician ordered arboviral panel test who met the confirmed and probable case classification for LACE, as defined by CDC. The case-series was a descriptive analysis of the identified cases focusing on demographics such as age, race, and ethnicity, but also including clinical symptoms, duration of hospitalization, and date of illness onset. While a case-series investigation lacks a statistical comparison group, the summary statistics generated are useful in identifying common characteristics of the disease and allow for (non-statistical) comparison to other cases described in the literature.
The cohort study utilized all individuals tested for arboviral disease at MHS and assess
demographic and peridomestic risk factors thought to be associated with LACE. Because this study was retrospective, we were able to efficiently measure exposures and the outcome using existing
25
generated from this analysis allowed for the quantification of the association of risk factors and LACE among individuals reporting to MHS for suspicion of arboviral disease.
An additional benefit of this study was the ability to assess case ascertainment and
completeness of reporting of LACE cases at MHS. We compared the cases identified at MHS to the cases found in the NCDPH reportable disease surveillance system during the study period. Mission Hospital is the largest tertiary care referral center in western NC, and MHS is thought to report the majority of LACE cases to NCDPH. However, additional follow-up such as convalescent serology may be conducted
outside of Mission Hospital, resulting in incomplete case ascertainment based solely on reporting by MHS. This review quantified the proportion of cases identified by MHS in the NCDPH reportable disease surveillance database and assessed the agreement of the surveillance counts. The results of the
investigation will provide insight into the generalizability of our cohort study, which relies solely on data from MHS.
2. Study population
The study population for Aim 1 consisted of a cohort of 501 patients identified in a joint surveillance initiative for LACE between MHS and the CDB of the NCDPH. For inclusion into the cohort, each individual must have had a physician-ordered test for arboviral disease from Mission Hospital between January 1, 2010 and December 31, 2012. Further exclusions based on state of residence and address data are identified in the analytic methodology to follow. MHS is the largest tertiary care referral center in western NC, with the majority of patients being residents of or visitors to western NC and the surrounding areas of upstate SC and eastern TN. This cohort was not limited by age, gender, or race and ethnicity.
This cohort was collected as part of routine surveillance for arboviral disease by Mission
26
Mission Hospital, NC DHHS, and UNC as part of public health surveillance activities. Therefore, no formal enrollment procedures were initiated aside from assembling the cohort based on physician-ordered arboviral tests. Patient records from admission to discharge were retrospectively reviewed, with demographic, clinical, and laboratory results entered into a surveillance database at MHS (Appendix 1).
The results of this study are generalizable to the entire population at risk of LACE in western NC counties (Figure 4) and more broadly applicable to individuals living in LACE endemic areas throughout the US. Our cohort is representative of individuals with access to healthcare in western NC, as the study cohort includes individuals seeking primary, secondary, and tertiary care through MHS. Using our case ascertainment data, we will be able to evaluate how well the Mission Hospital cohort represents the total number of LACE cases reported to NCDPH. Despite these efforts, we acknowledge that the majority of LAC infections are mild or asymptomatic and thus go unreported. The use of neuroinvasive disease (LACE) ensures that the most severe presentations of disease are captured in our analyses, and reduces the potential for underreporting given the serious symptoms and acute onset.
27 3. Outcome assessment
The outcome of interest in this study, LACE, was defined as a confirmed or probable case of neuroinvasive arboviral disease as identified by the CDC case definition. The case definition uses a combination of clinical criteria and laboratory evidence to classify cases as either confirmed or probable. In 2011 there was a new case definition released by CDC, resulting in the application of two case
definitions within the study period, depending on the year of onset. Cases occurring prior to January 1, 2011 were classified based on the 2004 definition, and the 2011 definition was applied to cases occurring on or after January 1, 2011.
The two definitions of neuroinvasive arboviral encephalitis differ only slightly in the definition of clinical symptoms and in the laboratory evidence for classifying confirmed or probable. Fever was more stringently defined as measuring at least 100.4°F (38°C) in the 2011 case definition, and the clinical criteria indicative of neuroinvasive disease is similar but more concisely worded and require physician documentation. The supportive laboratory evidence is similar in both case definitions, although the confirmatory 2011 case definition explicitly states that the CSF test must be non-reactive to other arbovirus-specific IgM antibodies (Table 1).
Table 1. National Notifiable Disease Surveillance System (NNDSS) case definitions in use during the study period.
2004 Case Definition 2011 Case Definition
Applicable Study
Time Period January 1, 2010 – December 31, 2010 January 1, 2011 – December 31, 2012
Clinical Criteria Fever, AND
Acutely altered mental status (e.g., disorientation, obtundation, stupor, or coma), OR
Other acute signs of central or peripheral neurologic dysfunction (e.g., paresis or paralysis, nerve palsies, sensory deficits, abnormal reflexes, generalized convulsions, or abnormal movements), OR
Pleocytosis (increased white blood cell concentration in cerebrospinal fluid [CSF]) associated with illness clinically
compatible with meningitis (e.g.,
Fever (≥100.4°F or 38°C) as reported by the patient or a health-care provider, AND
Meningitis, encephalitis, acute flaccid paralysis, or other acute signs of central or peripheral neurologic dysfunction, as documented by a physician, AND
28
headache or stiff neck), AND
Absence of a more likely clinical explanation
Laboratory Evidence Confirmed
Isolation of virus from, or demonstration of specific viral antigen or nucleic acid in, tissue, blood, CSF, or other body fluid, OR
Four-fold or greater change in virus-specific quantitative antibody titers in paired sera, OR
Virus-specific IgM antibodies in CSF, by antibody capture enzyme immunoassay (EIA), OR
Virus-specific IgM antibodies in serum, with confirmatory immunoglobulin G (IgG) antibodies in the same or a later specimen by another serologic assay
Probable
Stable (less than or equal to a two-fold change) but elevated titer of virus-specific serum antibodies, OR
Virus-specific serum IgM antibodies detected by antibody-capture EIA but with no confirmatory testing
Confirmed
Isolation of virus from, or demonstration of specific viral antigen or nucleic acid in, tissue, blood, CSF, or other body fluid, OR
Four-fold or greater change in virus-specific quantitative antibody titers in paired sera, OR
Virus-specific IgM antibodies in CSF, with no antibodies reactive to other endemic arboviruses, OR
Virus-specific IgM antibodies in serum, with confirmatory virus-specific neutralizing antibodies in the same or a later specimen
Probable
Virus-specific IgM antibodies in CSF or serum but with no other testing
Antibody testing, either by antibody-capture enzyme immunoassay (EIA) or
immunofluorescence assay (IFA), is the most commonly ordered test for LACE and other arboviral diseases. The NCSLPH is the primary diagnostic laboratory for arboviral tests from MHS, and specimen are sent to NCSLPH for arboviral panel testing. These arboviral panel tests including EIA tests for IgM antibodies reactive to LAC and WNV, and include IFA for immunoglobulin M (IgM) and immunoglobulin G (IgG) antibodies reactive to LACE, WEE, SLE, EEE, and WNV.59 The results of the panel tests provide the supportive laboratory evidence for case classification, with either a single result or a combination of positive tests used to confirm a case. Virus-specific IgM antibodies may persist in serum for months after initial infection, so the case classification for a confirmed test requires confirmatory testing in patients with virus-specific IgM antibodies in serum.60 In the absence of this confirmatory testing of serum, the case is classified as probable.35,36
29
NCDPH. Additionally, NCSLPH reports positive laboratory results to NCDPH, with the duplicative reporting as a check to improve case ascertainment and completeness of reporting. Potential cases are then investigated by the local health department and reviewed by NCDPH to ultimately classify the case. Those cases are then reported to the CDC through ArboNET, a CDC-sponsored national surveillance system for arboviral disease.
4. Demographics and other covariates
Patient demographics were assessed for the characterization of cases in the case-series and in the cohort analysis. The demographic variables thought to be risk factors for LACE are age and gender— males under the age of 15 have had the highest incidence of disease in prior studies.4,12,14,16 These variables were readily available from patient medical records, where age upon admission was
determined from date of birth and patient admit date and gender was reported in the patient medical record. We investigated the association of age as a continuous variable, ordinal variable using age groups, and as a dichotomous variable using specific ages as cut-points.
Additional demographics of interest collected from medical records were race and ethnicity. As described previously, Szumlas et al (1996) identified a high seroprevalence of LACE among American Indians living within the Qualla Boundary of the Eastern Band of Cherokee Indians (EBCI).42 This variable is of particular interest because LACE has been stigmatized as a disease of American Indians in certain parts of NC, although no evidence exists that this claim is due to an association with race; rather, this population happens to live in an area of high endemicity (B. Byrd, personal communication).61 In this research, race was coded categorically. Hispanic ethnicity was also collect from medical records,
30
Selected clinical and laboratory characteristics were reported for the description of cases in the case series and the cohort study. These variables were limited to the data elements agreed upon by the MHS study personnel prior to research. The clinical characteristics included type of hospital visit, reported symptoms, time to hospitalization, and final diagnosis code. Reported symptoms included those reported in the patient history prior to admission and those recorded clinically during the hospital visit. Up to 5 final diagnosis codes were recorded for each patient, and corresponded to the long-description of the Clinical Modification of the International Classification of Disease, Ninth Revision (ICD-9-CM) from the Nation Center for Health Statistics and the Centers for Medicare and Medicaid
Services.62 Length of hospital stay was defined as the difference between the discharge date-time and the admission date time. Time to hospitalization was defined as the difference in days between date of admission and patient-reported date of onset. Time of onset was not recorded, limiting the precision of time to hospitalization. Laboratory characteristics including type of arboviral test specimen from patients and additional patient diagnostic tests were extracted from the medical record. Arboviral test specimen characterized whether the sample was patient serum or CSF, and whether the sample was during the acute (within 10 days from onset) or convalescent phase (later than 10 days from onset).
5. Exposure assessment
The primary objective of Aim 1 was to investigate demographics and peridomestic risk factors using data that are readily available to investigators without additional interviews, site visits, and assessments. This allowed for the study methodology to be replicated in future investigations of reportable disease surveillance data by public health practitioners without costly site visits and
31
The peridomestic exposures of interest in the investigation were urban and rural residence, habitat type around the home, type of home, and the number of objects and structures around the home. Measurement of these risk factors relied on geocoding of patient addresses collected from medical records overlayed on census data, land cover data, and aerial imagery. ArcGIS 10 (ESRI;
Redlands, CA) was used to geocode addresses, utilizing the North America Geocode Service provided by ArcGIS Online, which is an automated, composite geocoding service utilizing 5 different address locators for US addresses. Additionally, geocoded addresses were interactively geocoded to determine the exact rooftop of the determined location. Non-matching addresses from the automated geocoding were interactively geocoded utilizing county tax parcel data and Google MapsTM (Mountain View, CA), with approximate address locations and nearest neighbor addresses used for addresses that fail to geocode. The process of manual (interactive) geocoding using available web-based services is considered a feasible, cost effective method to improve the quality of geocoded addresses.63 Rural areas, where rural routes and post office boxes often occur, are notoriously difficult to geocode, and sensitivity analyses were conducted to assess the effect on study results.64
Urban and rural residence was determined using Urban Area and Urban Cluster data from the 2010 Census, provided by the US Census Bureau. This is a shapefile for GIS that identifies 115 urban areas (UAs) or urban clusters (UCs) in North Carolina, where UAs are defined as areas with a population of at least 50,000, and UCs are areas with between 2,500 and 50,000 people.65 In this investigation, rural residence was a binary variable where any geocoded address outside of UAs and UCs was considered rural. LACE has traditionally been identified in rural areas, so this classification allowed for the quantification of any association between rural residence and LAC.
32
30m pixel is assigned a land cover type and is commonly used to assess habitat type and ecological classifications. This dataset was published in 2014, and utilizes orthoimagery from 2011, which generally captures the land cover conditions during the study period. This dataset identifies habitat types such as deciduous forest, evergreen forest, urbanized and developed areas, and farmland that will allow for identification of peridomestic habitat type.66 We assessed the percentage of habitat type within 100m, 200m, and 250m of the geocoded address, examining both the percentage of forest around the home and the most frequent (predominant) habitat type around the home. The most common vector of LAC,
Ae triseriatus, is a woodland mosquito and forest is often cited as a risk factor for LACE, the exposure assessment allowed for the identification and quantification of habitat types associated with LACE.
Type of home was assessed using aerial imagery to view the home at each geocoded address. Aerial imagery from 2010 is available from the NC Onemap Statewide Orthoimagery 2010 project of the NC Center for Geographic Information and Analysis, which allows free public access to true color orthoimagery for the entire state of NC taken during the year 2010 at a pixel resolution of 6 inches.67 Using this imagery, we were readily able to view the residence at each geocoded address and assess the type of home as a categorical variable with classifications of mobile home, stick-built singlefamily home, or multi-unit home such as an apartment, condominium, or town-home. Housing characteristics, particularly presence of window screens and lack of air conditioning, are presumptive risk factors for mosquito-borne disease, and mobile homes often lack central heating and air and are generally considered to be of poorer construction than stick-built single family homes. Additionally, living in a mobile home could be a proxy of socioeconomic status. In light of these factors, our investigation will explore the relationship between home type and LAC.
33
number of objects around the home that are viewable from the NC Onemap Statewide Orthoimagery in radii of 50m and 100m around the geocoded address. This variable will initially be explored as a
continuous variable in addition to numerical groupings and dichotomization by the mean number of objects around the home. These objects include additional structures such as barns, outbuildings, and sheds, neighboring homes, and general refuse around the home. While prior research with smaller sample sizes has conducted in-person visual assessments of homes, our investigation uses readily available imagery to determine a similar metric for measuring the association between number of items in the yard and LAC.
These peridomestic variables are measured using readily accessible sources of data, and certain limitations must be acknowledged. Under ideal study conditions, these variables would be measured in the weeks and months prior to symptom onset of each study participant to capture the peridomestic environment that existed at the time of exposure. Given the small number of cases and the inability to predict the place and time of disease occurrence, such timely measurement of exposures is not feasible. Several prior studies have conducted environmental assessments upon notification of cases or
identification of controls, but such methodology still struggles with temporality. Our investigation, similar to prior studies, relies on the assumption that the exposure assessment, derived from the most recent available data, is representative of the peridomestic environment at the time of LAC exposure.
34
prolonged periods of time outdoors, particularly around dawn and dusk when Ae triseriatus mosquitoes are most active.
6. Human subjects research and data management
Data from Aim 1 were collected as part of routine surveillance for arboviral disease by MHS. The Institutional Review Boards (IRB) of Mission Health Systems (# 13-03-983) from the North Carolina Division of Public Health (# 2013-1), and the University of North Carolina at Chapel Hill (# 13-0787) each exempted this study from IRB review as part of public health surveillance and investigation activities. Non-essential individually identifiable data were withheld from the investigators, and address data were only provided for the purposes of exposure assessment and were maintained according to the data security protocols specified in the IRB application to each IRB.
The data for Aim 1 were extracted from the electronic medical records system at MHS from August 2012 to February 2013 in collaboration with the Public Health Epidemiologist (PHE) from Mission Hospital within MHS. The MHS PHE maintained a roster of all patients with a physician-ordered arboviral test ordered between January 1, 2010 and December 31, 2012. A study investigator was employed by MHS and NCDPH to assist with active surveillance for potential LACE cases, and collected information from the patients tested for arboviral disease. Data were collected in an encrypted, password-protected database using Epi Info 7TM (Atlanta, GA) and stored and maintained at MHS during collection. Upon IRB exemption and completion of data collection, a copy of the dataset stripped of all non-address
identifiers was made available to investigators for the proposed research.
Source files for the exposure assessment, if not readily available from medical charts, were collected from the variety of publicly available sources described in the exposure assessment above and housed in file geodatabases for use by investigators. Exposures were measured for each study
35
on an encrypted, password-protected storage media in accordance with level II data security measures recommended by the UNC IRB with additional protections recommended by information technology support staff.
7. Data analysis
To investigate the risk factors associated with LACE among a cohort of patients tested for arboviral disease at MHS, we first conducted a case-series analysis characterizing demographics such as age, race, and ethnicity. Descriptive statistics were generated from univariate analyses to define the characteristics of individuals with disease in the study cohort. In addition to demographics, cases were described by date of onset, duration of hospitalization, and major clinical symptoms. This
characterization of cases will contribute to the general knowledge of individuals with LACE and identify similarities and differences among other groups of cases in the literature.
An analysis of the entire cohort from Mission Hospital compared the risk of disease based on demographic and peridomestic exposures among those tested for arboviral disease. The outcome of interest, LACE, was a dichotomous variable indicating presence or absence of disease. For the risk factors, rural residence was coded as a dichotomous variable, while type of home and habitat type around the home were coded as categorical and dichotomous variables. The number of objects and structures around the home will be assessed as a continuous variable, an ordinal variable, and as a dichotomous variable about the mean. Categorical variables were also collapsed into dichotomous variables when appropriate.
36
separate models, then jointly to assess multicollinearity and control for other risk factors. This analysis was an efficient method to utilize our entire cohort, rather than using subset of cases and controls. Log-binomial regression allows for evaluation of risk with a binary outcome given our exposures and adjustment for confounding and modification. Our analyses generated RRs indicating the degree to which peridomestic risk factors affect the risk of LAC encephalitis. Effect measure modification was evaluated using likelihood ratio tests with an a priori alpha level of 0.15. Potential confounders were identified using a directed acyclic graph (DAG) and evaluated using an a priori change-in-estimate value of 10%.68 Case ascertainment of LAC encephalitis by Mission Hospital to NCDHHS was summarized by calculating the proportion of Mission Hospital cases among the total LACE cases reported to NCDHHS between January 1, 2010 and December 31, 2012.
8. Statistical Power
In addressing Aim 1, we tested the hypothesis that there was no difference in LACE risk among those exposed and not exposed to the peridomestic risk factors. The study sample size was fixed in that all individuals within the cohort who meet our selection criteria will be included in the analysis. The entire cohort is comprised of 501 individuals, and we expected between 400 – 500 to be included in the final analysis due to exclusions from individuals with residence outside of western NC and individuals with non-geocodable addresses.
37
there were 39 LAC cases out of 196 individuals living in a rural residence (risk in exposed=0.199) and 19 LAC cases out of 213 living in an urban area (risk in unexposed=0.089).
38
Figure 5. Statistical power to detect a risk ratio varying exposure prevalence given a sample size of 409 for peridomestic exposes of rural residence, forested habitat, and their joint effect.
B. Analysis of spatial trends of LACE incidence in western NC 1. Study Design
The cohort data from the MHS study were limited by the narrow time period from 2010-2012. To analyze spatial trends in LACE occurrence, we used historical reportable disease surveillance data from NCDPH from 2000-2012. These data were used to generate incidence maps for cases of LACE throughout western NC, and were aggregated at the county and at the census tract level, allowing for a finer spatial scale from which to assess the degree of spatial clustering of LACE incidence. For highly focal diseases such as LACE, it is essential to conduct fine scale spatial analyses to identify areas of high incidence.