Analytical Tools for Integrating Transfers into Water Resource Management Strategies
Brian R. Kirsch
A dissertation submitted to the faculty of the University of North Carolina at Chapel Hill in partial fulfillment of the requirements for the degree of Doctor of Philosophy in the
Department of Environmental Science and Engineering
Chapel Hill
2010
Approved by:
Gregory W. Characklis, Ph.D.
Francis DiGiano, Ph.D.
Tim Kelley, Ph.D.
David Moreau, Ph.D.
ii ABSTRACT
Brian R. Kirsch
Analytical Tools for Integrating Transfers into Water Resource Management Strategies
(Under the direction of Gregory W. Characklis, Ph.D.)
Many municipalities within the United States anticipate rising demand for water
as populations grow. Traditionally, rising demand has often been addressed via
infrastructure projects, such as reservoirs. However, a variety of factors has combined to
make such projects less attractive, such as increased development costs, stricter
environmental regulation, and greater public opposition.
By contrast, transfers of water from existing sources can be used to more
efficiently manage risk posed by rising demand, allowing water to be acquired on more
of an as-needed basis. When developing transfer agreements, however, questions of
timing, quantity, and type of transfers must be settled if transfers are to be effectively
employed. Regional differences in water law, the nature of the available resources and
the degree of hydrologic variability further determine how transfers might be applied.
This research contributes to knowledge in three specific areas:
(i) This work examines the manner in which different types of market-based
transfers can be combined with firm capacity to form minimum expected cost
iii
that meet defined reliability and/or cost variability constraints. In doing so, a
Monte Carlo simulation is paired with the “implicit filtering” optimization
routine, designed to optimize portfolios despite the sampling error, or “noise”,
inherent in searching for an optimal expected value.
(ii) The second phase of research applies a modified technique (control variate) to
reduce the level of noise inherent in the simulation, thereby improving the
efficiency and accuracy of the optimization approach. This method is applied
to the study region as the simulation is expanded from a one-year to a 10-year
model, and results in a significant reduction in computational burden (as much
as 50%).
(iii) A technique is developed to generate synthetic streamflow time series in a
manner that reproduces autocorrelation in the historic record. This method is
used to develop streamflow records representative of future climate scenarios,
which are then used as inputs for a model that assesses different risk-based
transfer agreements within the Research Triangle region of North Carolina.
Results demonstrate that even minor changes in expected streamflows can
iv
v
Table of contents
List of figures………..vii
List of tables………....ix
Chapter 1: Introduction………..………..1
Chapter 2: Optimization of Water Supply Portfolios in the Lower Rio Grande Valley………...6
2.1 Introduction……….……….6
2.2 Methodology……….………..11
2.2.1 Hydrologic-Market Simulation………...13
2.2.2 Optimization Framework………21
2.2.3 Control Variate Method……….26
2.2.4 Application of CV Method………....28
2.2.5 Expansion to Multi-Year Model………....31
2.2.6 Application of CV Method to Multi-Year Simulation……...32
2.2.7 Study Region………...35
2.3 Results………45
2.3.1 Developing Minimum Cost Portfolios………..45
2.3.2 Application of CV Method to Single-Year Model………...55
2.3.3 Multi-Year Portfolio Scenarios……….60
2.3.4 Long-Term Option Contracts………...64
vi
Chapter 3: Improved Method for Developing Alternative Hydro-climate
Scenarios and their Effects on Water Transfer Agreements………...69
3.1 Introduction………...69
3.2 Methodology……….74
3.2.1 Study Region………..74
3.2.2 Managing Transfers………....77
3.2.3 Autoregressive Models and Autocorrelation………..79
3.2.4 The Autocorrelated Bootstrap………81
3.2.5 Application of the Model to the Study Region…………..91
3.3 Results………...94
3.4 Conclusions……….102
Chapter 4: Conclusions……….………..104
vii
LIST OF FIGURES
2.1 Expected cost landscape………..22
2.2 Schematic of optimization algorithm, model, and pilot study………30
2.3 Map of Lower Rio Grande Region………..36
2.4 Minimum cost portfolios for different strategies………46
2.5 Variations on strategy C2………....53
2.6 Landscapes with and without CV method……….……….…………56
2.7 Average optimized results of the one-year model………..57
2.8 Optimized one-year portfolio results………..59
2.9 Optimized 10-year portfolio results………60
2.10 Average optimized results of the 10-year model………..62
2.11 Map of variance reduction………64
2.12 Expected option activity over 10 years……….65
3.1 Risk chart for OWASA in 2025………..82
3.2 How Y is converted to Y'………....89
3.3 Partial autocorrelation function………...90
3.4 The 1-lag correlation of historic OWASA inflows………...91
3.5 Autocorrelation function………...92
3.6 Histograms of Standardized Inflow Index……….93
3.7 Histogram of SII values for high flow events………95
viii
3.9 CDFs of the lowest observed annual storage for OWASA………..99
ix
LIST OF TABLES
2.1 Summary of control variates used in multi-year scenarios………34
2.2 Simulation data summary………38
2.3 Minimum cost portfolios………...47
2.4 Strategy B and C2 portfolios……….52
1 Chapter 1: Introduction
Rising water demand and concerns over scarcity have driven an increasing
number of regions to explore market-based approaches to water resource management
(Anderson and Hill 1997; Easter, Rosegrant et al. 1998; National Research Council
2001). Nonetheless, most water markets remain relatively unsophisticated, with
transactions involving only permanent transfers of water rights. While a number of
studies have shown that permanent transfers encourage long-term allocation efficiency
(Howe, Schurmeier et al. 1986; Young 1986; Saliba 1987; Chang and Griffin 1992;
Griffin and Boadu 1992; Colby, Crandall et al. 1993; Hearne and Easter 1997; Howe and
Goemans 2003; Brookshire, Colby et al. 2004; Nieuwoudt and Armitage 2004), such
transfers provide a less effective means of managing short-term scarcity. Rising demand
in many regions has increased the level of economic and social disruption brought about
by seasonal droughts, consequently some markets are beginning to support a more
sophisticated menu of temporary transfers (Howitt 1998). In response, some researchers
have investigated the potential efficiency gains associated with “spot market” leases
(Vaux and Howitt 1984; Smith and Marin 1993; Characklis, Griffin et al. 1999) and
options (Hamilton, Whittlesey et al. 1989; Michelsen and Young 1993; Watters 1995;
Jercich 1997; Howitt 1998; McCarl, Dillon et al. 1999; Villinski 2004).
Spot market leasing generally involves the immediate transfer of “wet” water,
with the lease price subject to considerable variability based on supply and demand
2
purchaser the right to lease water at a later date at an agreed upon “exercise” price. The
certainty inherent in the exercise price can make options an attractive hedge against spot
market price volatility, while providing the additional advantage of postponing transfer
decisions (and full payment) until better information is available. Both leases and options
improve market flexibility relative to permanent transfers alone, allowing water users to
more rapidly adapt to changing conditions while meeting their reliability goals with a
reduced volume of “firm” capacity. As leases and options have become more widely
available, there has been increased interest in how water users might coordinate the use
of these instruments to achieve the dual objectives of maintaining water supply reliability
and lowering supply costs.
Riparian law may not extend the property rights necessary to permit water
markets, but generally, water utilities that withdraw and treat water may sell that treated
water to another utility (with limitations). However, these sorts of transfers do require
some type of infrastructure in place (e.g., pipelines, interconnections between distribution
systems), generally limiting transfer opportunities more than the raw water transfers in
the western U.S. Despite the more limited opportunities, transfers in the eastern U.S. can
often meet reliability objectives at lower costs than expansions of firm capacity, though
these transfers tend to be established on a contractual basis.
Regardless of the environment, both market- and contract-based transfers require
active management of when and how much water to transfer. In the two study regions in
this work, anticipatory, risk-based decision rules are used to manage transfers. The
decision rules are designed differently for each study region, recognizing the different
3
are predicated on the idea that transfers should be initiated prior to water supply levels
reaching a crisis point, and both express some explicit or implicit concept of risk, the
likelihood of water supply levels reaching that crisis point.
The models used in this work involve Monte Carlo techniques, an important
choice given the nature of how the transfers are being used. Transfers are not being used
as a primary, everyday source of water supply. Rather, they are used as supply
augmentation during droughts, and as such represent infrequent events with a wide
variability in their frequency and quantity of consumption. Performing hundreds, or even
thousands, of realizations (i.e., repetitions) of the simulation provides greater precision in
the estimates of expected costs and outcomes. Ultimately, this work provides a range of
tools that will enable utilities to confidently assess the viability, costs, and effectiveness
of potential transfer strategies.
Chapter 2 combines two published papers into a single, integrated work. Both
papers address the optimization of a “portfolio” of water supply assets of a utility in the
Lower Rio Grande Valley in Texas. A Monte Carlo simulation is created to determine
expected outcomes of a range of scenarios and portfolio strategies. Traditionally, Monte
Carlo simulations have been of limited use in water resources planning. As a sampling
technique, Monte Carlo simulations produce sampling errors, such that traditional,
gradient-based optimization methods are of little use. Without the ability to optimize
Monte Carlo simulations, their use has languished. In this work, the Monte Carlo
simulation is paired with an optimization method that has been designed to optimize a
simulation that exhibits the sort of sampling errors produced by Monte Carlo simulations.
4
this sort of simulation-optimization pairing within the water resources community. The
paper also demonstrates how risk-based decision rules can effectively govern the use of
temporary transfers, such as leases and options. This paper ultimately shows how the
composition of optimized portfolios can shift as the priorities of the utility change (e.g.,
the relative importance of minimal cost versus cost volatility versus reliability). The
second paper within the chapter continues the work of the first paper, but expands the
one-year simulation period of the first paper to a 10-year simulation, which is more in
line with the planning periods of utilities. In order to counter the increased computational
burden, the simulation is paired with a variance reduction technique. This is the first
example of a variance reduction technique being used as an aid to optimization, not
simply to improve the accuracy of a simulation. As a result, the use of this variance
reduction technique roughly halves the computational burden required to produce an
optimized portfolio with a given level of accuracy and precision. Moreover, the longer
simulation period allows the exploration of how long-term option contracts can be
adjusted to both accommodate growth in demand for water and minimize cost.
The third chapter in this work turns away from the optimization aspect of the
previous chapter, instead focusing on improving the simulation to better predict the
performance of temporary transfers. Specifically, this work improves the ability of a
synthetic time series to replicate the autocorrelation of the historic record. Streamflows
commonly contain a significant amount of autocorrelation within the time series, and
replicating that autocorrelation is vital to replicating long-term high- and low-flow
events. Moreover, other techniques that generate synthetic records containing
5
relates the autocorrelation contained within the historic time series as a whole. These
other techniques neglect the fact that, particularly with streamflows, autocorrelation can
fluctuate seasonally as hydrologic conditions change (e.g., evapotranspiration, soil
moisture). The technique developed in this work, the autocorrelated bootstrap, not only
reproduces the historic autocorrelation function, but also the seasonal fluctuations in the
correlation structure. The manner in which data is treated as part of the autocorrelated
bootstrap produces an opportunity to adjust seasonal averages and standard deviations to
reflect future climate change scenarios. Thus, given improved climate change
predictions, the autocorrelated bootstrap becomes a tool in which those predictions can be
translated into a meaningful form for water utilities, that is, how the performance of water
supplies is altered.
The autocorrelated bootstrap is applied to the Research Triangle region of North
Carolina. The model simulates the use and performance of interruptible contracts
governing the sale of treated water between urban users. The ability of the autocorrelated
bootstrap to replicate the historic rate of long-term extreme flow events is proven. The
simulation itself then shows that the expected rate of transfers is highly dependent upon
future average inflows. For instance, if average annual inflows were to drop just 7%,
expected transfer rates double.
In total, the work here presents a range of tools to aid in both the simulation and
optimization water resources. Specifically, the use of temporary transfers is shown to be
an efficient and effective mechanism for ensuring the reliability of a utility’s water
6
Chapter 2: Optimization of Water Supply Portfolios in the Lower Rio Grande Valley
(Note: This chapter combines the work published in two papers:
Kirsch, B. R., Characklis, G. W., Dillard, K. E. M. and C. T. Kelley (2009). "More Efficient Optimization of Long-term Water Supply Portfolios," Water Resources Research, 45, W03414.
Characklis, G. W., Kirsch, B. R., Ramsey, J., Dillard, K. E. M. and C. T. Kelley (2006). "Developing Portfolios of Water Supply Transfers", Water Resources Research, 42(5), W05403.)
2.1 INTRODUCTION
Several previous studies have used either linear or stochastic programming
techniques to identify combinations of supply alternatives, including infrastructure,
transfers and conservation, that minimize the expected costs of meeting urban water
demand (Lund and Israel 1995; Wilchfort and Lund 1997; Watkins and McKinney 1999;
Jenkins and Lund 2000). In general, these methods have involved some form of two
stage model in which the first step involves a hydrologic simulation that is used to
establish a discrete set of supply scenarios. This information is combined with price and
usage data to develop least cost combinations of long-term (e.g., reservoirs) and
short-term supply alternatives (e.g., leases, options), with results suggesting that the
coordinated use of short-term transfers can reduce costs.
This work focuses solely on market-based transfers, but expands on earlier studies
7
issues that have received less attention in previous work. In particular, this work
describes portfolio development from a perspective of a utility manager seeking to
minimize water supply costs. In many earlier studies a city’s decision to acquire water
via leases or options and its actual receipt of the water occur within a single time period.
While these periods have often been long enough (3 to 6 months) that this is not
unreasonable, such an approach assumes that the city buys and acquires water at exactly
the time it is needed or, alternatively, that the city has perfect information regarding its
future needs at the time it makes a purchase. Even in a market where transactions can be
completed quickly, such a scenario is at odds with the risk averse nature of utilities who
will generally seek to augment supply in advance of a shortfall (i.e. without perfect
information). Toward that end, this work identifies anticipatory decision rules, using the
ratio of expected supply to expected demand as the basis for determining when (and how
much) to lease/exercise. These rules could provide a utility with a decisionmaking
framework for arriving at a least cost solution using information as it becomes available
throughout the year.
Uncertainty with respect to spot market prices will also be a primary concern
when developing portfolios that include temporary transfers. In this work spot lease
prices are represented as distributions (based on actual market data) and this information
is used to price options in a risk neutral manner consistent with financial theory (Black
and Scholes 1973; Hull 1999). The use of lease price distributions provides the
additional benefit of allowing for the calculation of both expected cost and cost
variability. This is a potentially important distinction because while minimizing expected
8
decisions regarding a portfolio’s suitability. Cost variability has been considered before,
Watkins and McKinney (1997) describe a relatively elegant approach that incorporates
consideration of both expected supply costs and their variance when identifying an
optimal solution, however, their approach assumes a symmetrically distributed objective
function (essentially cost). This may not be the case in many regions, a point made more
significant given that the risk of high costs associated with asymmetric tails in the
distribution may have a significant impact on decisionmaking.
The modeling approach employed consists of a hydrologic-market simulation
embedded within a search-based optimization algorithm. This methodology is designed
to identify the portfolio of rights, options and/or leases that minimizes expected costs
while meeting constraints related to both supply reliability and (in some cases) cost
variability. When minimizing the expected costs of water supply in a stochastic
environment, computational burden can be a particular concern. In water supply
problems, the expected cost surface near the optimum is often relatively flat and can be
somewhat “noisy”, increasing the likelihood that a search will become trapped in a local
minimum. To combat these challenges, a different type of search technique (“implicit
filtering”) is used, one proven to be widely applicable for problems where the solution
surface exhibits high-frequency, low-amplitude noise (Choi, Eslinger et al. 1999).
The computational burden of this type of simulation-optimization approach has
traditionally been a deterrent to its broader use. The initial investigation made into
portfolio optimization uses a short-term (i.e. one year) planning horizon as a
proof-of-concept and to better differentiate the effects of various decision variables and initial
9
second phase of this research (i.e., the second paper) extends the planning horizon and
develops techniques to reduce the now expanded computational burdens of the
simulation-optimization.
Implicit filtering is used to navigate local minima caused by high-frequency,
low-amplitude noise, and the ability to navigate this noise is dependent upon its magnitude.
The magnitude of the noise is a product of the variance of the objective function (i.e. the
expected portfolio cost), which can be reduced by increasing the number of realizations
(i.e. simulation runs) on which each expected value is based but at the cost of an even
greater computational burden. As a means of reducing this burden, a variance reduction
technique known as the control variate (CV) method (Lavenberg and Welch 1981;
Avramidis and Wilson 1996) is applied. The CV method can reduce the noise inherent in
optimization surfaces based on expected values by using a priori knowledge of how
random variations in a simulation’s inputs affect its output, and using this information to
reduce the variance in simulation output. The method has been used in other areas, most
notably the pricing of stock options (Boyle 1977; Johnson and Shanno 1987; Broadie and
Glasserman 1996), but always with a standalone Monte Carlo (MC) simulation. In this
case, it is applied within a simulation-optimization framework with the intent of
characterizing its potential for improving optimization efficiency. This is also the first
application of this technique in a water resources context, so in addition to providing
information on the degree of improved efficiency that might be expected, it should also
provide some general insights into what factors are most important in improving
10
The expansion of this concept to multi-year scenarios extends the planning
horizon to a level of more interest to utilities, provides insights into how portfolio
composition might change over time, and produces results that are less dependent upon
initial conditions. It also allows for an investigation of several types of long-term option
contracts, those which allow the purchaser with year-to-year flexibility, while still
providing the long-term contractual security that frees the utility from the cost and
inconvenience of annual renegotiation. Results suggest that the combination of implicit
filtering and the control variate method is capable of significantly improving the
efficiency of simulation-based optimization, a finding that could be applied in a broad
range of water resource contexts. Similarly, results related to the composition of
long-term water supply portfolios, including multi-year option contracts, may provide insights
valuable in the formulation of water supply strategies.
This simulation-optimization approach is applied to the Lower Rio Grande
Valley, a region that supports an active water market (Griffin and Characklis 2002). The
availability of hydrologic information and 10 years of spot lease price data make this
region well suited for an exploration of water supply portfolio development. The region
also exhibits characteristics typical of many water scarce western regions, including
rapidly growing municipal demand and a large agricultural sector. Results should
provide general insights into the role that options and leases can play in lowering the cost
of meeting water supply reliability goals. While this work represents firm supply
capacity as water rights, a similar approach could be used to develop portfolios
11 2.2 METHODS
An approach is developed to identify a minimum cost portfolio of rights and
transfers that meets one city’s water demand with a specified reliability over a period of
12 months. The regional water supply is provided via a reservoir, with water allocated to
users through a system of rights. Water can be obtained via the following three
mechanisms:
The first is permanent rights. These entitle the holder to a pro rata share of
reservoir inflows (after correcting for losses), such that a city owning 5% of regional
rights is allocated 5% of inflows. Allocations are made at the end of each month, and the
water can be used in any subsequent month. Permanent rights are transferable, but
regulatory approval takes time, so the city’s volume of permanent rights is assumed
constant throughout the year. Their price (pR) is represented as an annualized cost based
on purchase price.
The second mechanism is spot market leases. Lease transactions can be
completed at the end of each month, and leased water may then be used in any
subsequent month. Leasing transactions receive less regulatory scrutiny as they involve
only a temporary transfer and so may be completed quickly (i.e., within a few days).
Spot lease prices in each month t are linked to reservoir levels and described as random
variables (p ˆ Lt).
The third mechanism is option contracts. Option contracts provide the right to
lease water at a later date and an agreed upon price. Options can be purchased just before
the beginning of the year and ‘‘exercised’’ on a single call date (i.e., a European call
12
been exercised, the leased water can be used in any subsequent month. Options not
exercised on the call date lapse and have no further value. Option prices (pO) and
exercise prices (pX) are based on the distribution of spot lease prices (p ˆ Lt) in the exercise
month.
Options are priced using a “risk-neutral” approach in which it is assumed
impossible to make risk-free profits (Black and Scholes 1973). In other words, the
expected value an option provides relative to a spot market lease does not exceed the
option’s price (Hull 1999). The price of a European call option (pO) is calculated by
discounting the option’s expected value on the call date back to the point at which the
option is purchased, with the expected value based on the difference between the exercise
price and spot lease price, or zero, whichever is larger (expression in brackets), such that
pO = e−rT • E max ˆ p L
t −pX, 0
(
)
[
]
[2.1]where r is the discount rate (monthly) and T is the period between purchase and exercise
dates (months).
The general approach to portfolio development first involves constructing a
stochastic simulation that models the city’s responses to changing hydrologic and market
conditions. The simulation is embedded within an optimization framework which, for
any given set of initial conditions, identifies the portfolio of water market transfers that
minimizes expected costs while meeting constraints related to reliability and cost
variability. The regional context is the western United States, a setting where agricultural
water use generally dominates and increasing water scarcity is driven by urban
expansion. As such, there are several implicit assumptions. One is that the city is a
13
is a price taker). In addition, because the vast majority of water is used for relatively low
value irrigation, it is assumed that the city can always find sufficient water available
within the market to accommodate a lease or exercise transaction. It is worth noting that
while the assumptions related to the unlimited availability of spot market water and
risk-neutral pricing provide a reasonable basis for this analysis, their use may have
implications for results, and these will be discussed in later sections.
2.2.1 Hydrologic-Market Simulation
The simulation runs over a 12-month period, beginning on 31 December (t = 0),
with the city holding some number of permanent water rights (NR
T) and options (NO). Initial conditions specify reservoir storage (R0) and the amount of water the city has
carried over from the previous year (Nr
0). In each of the following months, regional hydrologic conditions are simulated using data sets describing monthly reservoir inflow,
outflow, and losses, with these conditions linked to both the city’s water supply and the
spot market price for water. This information is then combined with monthly
distributions of the city’s demand to make decisions regarding the purchase of leases
and/or exercise of options. Multiple simulation runs for each set of initial conditions
generate values for the expected annual cost of the city’s portfolio, expressed as (random
variables are denoted by the circumflex)
E Annual Cost
[
]
=NRTpR +NOpO+E N[ ]
X pX +E NLtp ˆ Lt t=011
∑
[2.2]
where,
= total volume of permanent rights held by city (ac-ft); T
R
14
= volume of options purchased at the beginning of the year (ac-ft);
= volume of exercised options (ac-ft);
= volume of spot leases purchased at the end of each month (ac-ft).
Within the simulation, the following constraints apply:
= the city cannot exercise more options than it buys in t = 0;
[2.3]
Nri i=0
11
∑
≤NRT = allocations of reservoir inflows to the city’s permanent rightscannot exceed the number of rights that the city holds;
[2.4]
RMax≥Rt ≥RMin = Reservoir level must stay within specified bounds related to
storage capacity ( RMax) and minimum storage levels ( RMin);
[2.5]
Non-negativity constraints also apply for all variables.
A series of variables are used to describe regional hydrologic conditions,
including it = volume of reservoir inflows for each month t; lRt = volume of reservoir
losses for each month t; and ot = volume of reservoir outflows (including spillage) for
each month t.
A water balance is maintained on the reservoir system throughout the simulation such
that
Rt =Rt−1+it −ot−lR
t. [2.6]
O N
X N
t L
N
O X N
15
From the perspective of the individual city, total reservoir storage is less
important than the volume of water available to the city itself, an amount largely
determined by the city’s initial supply (Nr0) and its share of monthly reservoir inflows
(Nrt). Reservoir inflows available for allocation are calculated as the difference between
monthly inflows and losses, multiplied by an instream loss factor ( lI), which accounts for
losses incurred between the reservoir and user (which in this case is assessed prior to
allocation). Inflows available for allocation to rights holders in each month ( ˆ n t) are
computed as
ˆ
n t =
( )
i ˆ t−ˆ l t •(
1−lI)
[2.7]These inflows are allocated on a pro rata basis such that the distribution of new monthly
inflows accruing directly to the city (N ˆ r
t) is represented as
ˆ N rt =n ˆ t•
NR T N R
[2.8]
where,
N R = total volume of regional water rights.
The total volume of water available to the city in any month is assessed at the end
of the preceding month, and the method of calculation changes depending on whether it
is before or after the exercise month (tx). In months prior to tx, the supply available to the
city in the next month (St+1) includes cumulative inflows and purchased leases, less water
usage such that
St+1= Nri i=0
t
∑
+ NLii=0
t−1
∑
− uii=1
t
16 where,
ut = city’s usage in month t.
In subsequent months, the available supply also includes exercised options, such that
St+1= Nri i=0
t
∑
+ NLii=0
t−1
∑
− uii=1
t
∑
+NX for t = tX, tX+1 …11. [2.10]The decision of whether or not to purchase leases is the last step in each month, and the
decision is based on the city’s available supply, specified by [2.9] or [2.10] (neither of
which include consideration of leases purchased in month t). The leasing decision
involves consideration of both the city’s available supply and the volume of monthly
inflows it expects to have allocated to it over the remainder of the year (calculated on the
basis of historical records). These two values are summed to yield the city’s expected
water supply (SEt+1) over the remainder of the year, such that
[ ]
∑
+ = + + 11 1 + t = i1 E ˆ
1 i
t t r
E S N
S for t = tX, tX+1 …10. [2.11]
where i r
Nˆ = distribution of inflows allocated to the city in each month t.
November (t = 11) inflows are considered when calculating the available supply
for December, but December inflows are allocated to the following year. Therefore
December’s available supply and expected supply are equal (i.e., SEt+1 =St+1).
Once the city’s expected water supply has been calculated, the decision is made to
purchase leases and/or exercise options. This is a two-part decision in which the first step
involves determining whether or not to acquire water and the second involves deciding
17
with the decision to acquire made by comparing this ratio against a specified threshold
value (α), such that if
SE t+1 E ˆ
[ ]
d i i=t+112
∑
≤α, then, the city will acquire water, for t = 0, 1, 2 …11[2.12]
where,
ˆ
d t = distribution of the city’s water demand during each month t.
The question of how much to lease and/or exercise is made by comparing the ratio of
expected supply to expected demand with a second specified threshold value (β). This
leads to leases ( ) being purchased and/or options (NX) exercised until
NL t +NX
(
)
+SEt+1 E ˆ
[ ]
d i i=t+112
∑
=β , for t = 0, 1, 2 …11 [2.13]In all months except tx, NX =0 and the volume of leases purchased can be represented as,
NL
t =β E ˆ
[ ]
d i i=t+112
∑
−SE
t+1, for t≠tX. [2.14]
During tx, the decision process is modified such that exercising options is considered
before purchasing leases. Under these conditions, the first step is to compare the exercise
price (pX) with the current spot lease price (pLt). If the lease price is less than the exercise
price, the city will simply lease the volume defined in [2.14]. If, however, the exercise t
L
18
price is less than the lease price, the city will exercise options, with the volume to be
exercised expressed as follows:
if β E ˆ
[ ]
d i i=t+112
∑
−SEt+1 ≤NO, then NX =β E ˆ
[ ]
d i i=t+112
∑
−SEt+1, otherwise NX =NO.
[2.15]
In the case of the latter scenario, where options alone are insufficient to satisfy [13], the
city will acquire additional water via leasing, such that
NL
t =β E ˆ
[ ]
d i i=t+112
∑
−SEt+1 −NX, for t=tX. [2.16]
Different α and β variables can be specified for individual seasons or even individual
months. In the example described later, two different parameter pairs are established, one
(α1/β1) for the period running up to the month before options can be exercised ( t0 →tX
-1) and another (α2/β2) for the remainder of the year. Expected supply [2.11] is similarly partitioned, such that it is calculated relative to tX in months leading up to tX, and
calculated relative to the end of the year in all subsequent months. Optimal values for α
and β, those that lead to a minimum expected cost portfolio that meets reliability
constraints, are determined as part of the optimization routine (see next section).
The choice to link decision rules to the ratio of expected supply to expected
demand was based on the ability to use this value in determining both when and how
much water to acquire. Alternative decision rules could have been based on the
probability of shortfall, or perhaps even linked to a threshold value for the expected
benefits loss that would accrue as a result of a shortfall. These types of rules may be
19
explored in future work), but their use would have necessitated additional calculations to
answer both the “when” and “how much” questions.
Water is acquired just before the monthly counter changes (i.e., month t + 1
becomes month t), correspondingly St+1→St, which is then represented as
St = Nr
i i=0
t−1
∑
+ NLi i=0
t−1
∑
− uii=1
t−1
∑
, for t = 1, 2 …tX, [2.17]or
St = Nr
i i=0
t−1
∑
+ NLi i=0
t−1
∑
− uii=1
t−1
∑
+NX for t = tX+1, tX+2 …12. [2.18]Available supply (St) is compared with a demand value (dt) obtained by either randomly
sampling a monthly distribution or selecting from a monthly time series. If available
supply is sufficient to meet this demand (i.e., St ≥dt), then demand equals usage (ut = dt).
If available supply is insufficient, then ut = St, leaving a shortfall of dt−St and a
“failure” is recorded for that month. A distinction is made between a “failure” and a
“critical failure” (St dt ≤0.6) in order to recognize differences in severity and the
measures that would be required to compensate for the shortfall. A running tally of both
failures and critical failures is maintained throughout the simulation.
Once available supply and demand have been compared, the process of evaluating
new allocations and lease/exercise decisions repeats monthly through the end of the year.
Each annual run within this probabilistic framework represents one realization of the cost
and reliability of a portfolio defined by selected values for the initial conditions (R0, Nr0)
and decision variables (NR, NO, α1, β1, α2, β2). Multiple runs are made to determine a portfolio’s expected cost (equation [1.2]) and expected reliability, with the latter defined
20 E r
[ ]
f =1− failures12•Years
[2.19]
where,
rf = monthly reliability against a failure (i.e. St <dt);
Years = number of simulated years (i.e. annual runs).
A reasonable span of monthly reliabilities might range from 0.995 (i.e., one
failure every 16.7 years) to 0.98 (one failure every 4.2 years). A similar factor (rcf) is
used to measure the expected reliability relative to critical failures.
Multiple annual runs also allow for evaluation of the probability of very high
annual costs. Within the electricity and natural gas industries, a common metric used to
describe the risk of high costs is the ‘‘contingent value at risk’’ (CVAR). Given a
distribution of annual costs, the CVAR represents the mean of the annual costs falling
above the 95th percentile. Something akin to the CVAR is likely to play a role in utility decisions, and this metric is used here.
The quantity of water remaining in the city’s possession at year’s end is also
tracked. This remaining water is not assigned any value, a shortcoming that could raise
concerns that a portfolio developed within this annual framework may not bear much
resemblance to the type of portfolio that would minimize costs over a longer time
horizon. For instance, a portfolio that consistently left the city with very little water at
the end of the year could result in very high supply costs the following year (this does not
actually tend to be the case, however). While the development of long-term portfolios is
beyond the scope of this work, these issues will receive some attention in the results
21
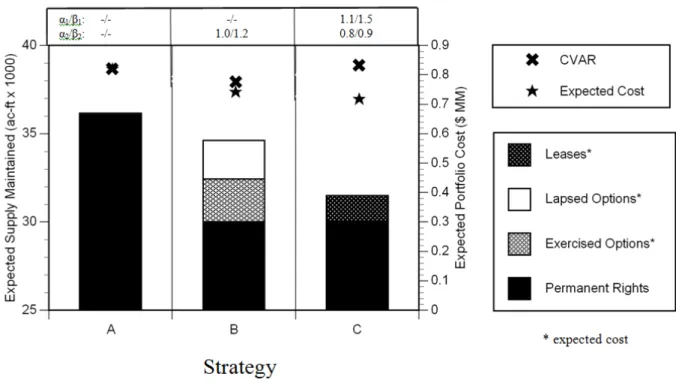
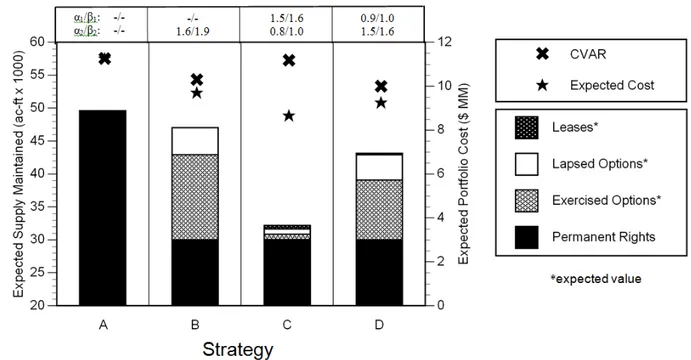
The methodology described above involves a supply strategy that includes rights,
options, and leases (strategy C); however, it is easily modified to explore alternative
strategies that include permanent rights alone (strategy A) and permanent rights and
options (strategy B). In the case of a city relying on strategy A, the number of rights (NR)
becomes the only decision variable. With respect to strategy B, the number of decision
variables increases to four (NR, NO, α2, β2) and the decision framework for acquiring water (i.e., equations [2.12], [2.13], and [2.15]) is similar to that described above, except
that the city acquires additional water via options alone, and only in the exercise month.
Strategy C involves six decision variables (α1, β1 are added) and the entire monthly decision framework described above.
2.2.2 Optimization Framework
The simulation is linked to a search algorithm that identifies optimal values for
the decision variables based on the following formulation (for Strategy C),
NR,NO,α1,β1,α2,β2
Minimize Z = E Annual Cost
[
]
[2.20]Such that:
E r
[ ]
f ≥ monthly reliability threshold, ∈[ ]
0,1 ; [2.21]E r
[ ]
cf ≥ monthly critical reliability threshold, ∈[0,1]. [2.22]Later results also incorporate an additional constraint limiting cost variability, such that
CVAR
22
Figure 2.1 illustrates a section of the optimization landscape describing expected
cost as a function of the number of permanent rights and options (α1, β1α2, β2 held constant). While the surface is relatively smooth when the volume of leases and
exercised options is small (i.e., when a portfolio is mostly rights), as the volume of leases
and exercised options increases so does the “noise”. This can be problematic for many
gradient-based search algorithms as they can become trapped in local minima. The
amplitude of the noise can be reduced by increasing the number of simulated years, but
this comes at a price in terms of computational burden.
Figure 2.1: Expected cost landscape (constant values for α1/β1 and α2/β2)
Implicit filtering is a finite difference search method in which the difference
23
progresses (Kelley 1999). In this way, local minima which are artifacts of low-amplitude
noise do not trap the iteration, and the noise is “implicitly filtered” out. This is in
contrast to methods which explicitly try to filter out high-frequency components of the
objective function (Kostrowicki and Piela 1991; More and Wu 1997); such methods are
designed for problems with high-amplitude high-frequency terms and should be thought
of as global optimization algorithms. Implicit filtering is not a global optimization
method, and is designed to efficiently solve problems, such as those presented in this
paper, which have noisy but not violently oscillatory optimization landscapes (see Figure
2.1). Methods such as steepest descent, which are based on gradients, can be trapped in
the small-scale local minima that noisy surfaces exhibit, and may fail if this results in an
optimization surface that is not differentiable. In this problem, as in many others, the
noise results from using an expected value (cost) as the objective function. The
frequency and amplitude of the noise increases with greater use of leases and exercised
options (probabilistic variables) and decreases with the number of simulated years used to
generate an expected cost estimate of each portfolio. While an infinite number of
simulations for each portfolio would generate a perfectly smooth optimization surface
(which could be optimized using some form of steepest descent approach), implicit
filtering allows for efficient optimization of the problem by allowing the search to
progress while reducing the number of simulated years required to generate expected cost
values during each iteration.
Implicit filtering uses the finite difference gradient (as described by the difference
between points on the finite difference stencil) to compute a search direction for descent.
24
approximation of the negative gradient) is used, implicit filtering uses a quasi-Newton
model of the Hessian to scale the gradient, thereby accelerating convergence in the
terminal phase of the iteration. The theory for implicit filtering (Stoneking, Bilbro et al.
1992; Kelley 1999) and related algorithms (Torczon 1997; Kelley 1999; Audet and
Dennis 2003) explains how such methods overcome low-amplitude noise and also gives
insight into the limitations of these methods. In particular, there is no guarantee that a
global minimum will be found. While implicit filtering cannot ensure convergence to a
global minimum (this can only be proven for methods that undertake exhaustive efforts to
asymptotically sample a dense subset of the design space), there is a rich literature
describing the convergence of this class of methods, generally distinguished by the
‘‘polling’’ of stencil points throughout an iteration (Torczon 1997; Kelley 1999; Audet
and Dennis 2003). This body of work demonstrates that for problems involving a smooth
objective function and inequality constraints, any limit point of an iteration satisfies the
first-order necessary conditions for optimality, which is the typical conclusion in
convergence theorems for iterative methods for optimization. These results have also
been generalized to both nonsmooth (Audet and Dennis 2003; Finkel and Kelley 2004)
and noisy problems (Stoneking, Bilbro et al. 1992; Choi, Eslinger et al. 1999).
In this application, the implementation code, implicit filtering for constrained
optimization (IFFCO), uses the difference gradient stencil for more than computation of
the gradient (Choi, Eslinger et al. 1999). The gradient-based optimization is augmented
with a coordinate search using the stencil points. If the result of the coordinate search is
better than the result from the descent method, IFFCO accepts the coordinate search
25
(for details, see Choi et al. [1999] and Kelley [1999]). IFFCO handles constraints in two
ways. Simple bound constraints on variables (e.g., NO ≥0) are enforced at each iteration
by setting variables that exceed the bounds to the value of the nearest bound. Indirect
constraints (e.g., reliability) are handled by assigning slightly higher values to the
objective function of points where the constraint is violated. These failed points are
always at the edges of the stencil, and they act to steer the search away from the
infeasible region. IFFCO’s combination of stencil-based sampling and gradient- based
optimization is most effective when the function to be minimized is a smooth surface
with low-amplitude perturbations. Such problems are common in a number of
applications, and while implicit filtering has not been applied to water resource
management problems, it has been successfully employed in some related settings,
including the design of groundwater remediation systems (Batterman, Gablonsky et al.
2002; Fowler, Kelley et al. 2004).
The simulation-optimization procedure includes 10,000 annual simulation runs
for each set of decision variables, generating values for expected costs, reliability, critical
reliability, and the CVAR which are generally reproducible to three significant figures.
These parameters, as well as the α and β values, are passed to IFFCO which then guides
the search of the optimization landscape. A search duration of 50 calls to the function
(i.e., simulation) per decision variable was generally found to provide a resolution with
respect to the expected cost and portfolio composition that corresponded to less than 1%
and 200 ac ft, respectively. In some cases, 50 calls were insufficient to reach this
26
approximation) was used as a starting point and the process repeated until changes in the
solution were within these tolerances.
2.2.3 Control Variate Method
Despite the ability of implicit filtering to navigate noisy surfaces, the noise
produced by an objective function (f(x)) is detrimental to the precision and accuracy of
the optimized solution. This noise can be quantified using the standard error of the mean
(s.e.), defined as,
n e
s. .= σ , [2.24]
where σ is the standard deviation of f(x) and n the number of realizations. As the value of
σ is intrinsic to f(x), controlling the noise associated with a MC simulation typically
means controlling the number of realizations performed. However, the square root in the
denominator means that increasing n has decreasing marginal returns in reducing
standard error. An alternative approach to reducing noise would be to reduce the
variance of the function, something that can be achieved through application of the
control variate method.
The control variate (CV) method is a variance reduction technique that utilizes
knowledge of how variation of stochastic input variables affects the value of simulation
output, in this case, the objective function f(x). For example, a city may wish to estimate
the expected cost of transfers through MC simulation. If there exists a known correlation
between the cost of water transferred (simulation output) and the volume of water stored
in the city’s reservoir (stochastic input variable), the reservoir storage volume may be
27
its mean can be used to account for deviations from the estimated mean cost of transfers,
thereby reducing the variance in the transfer costs and improving the precision of cost
estimation. While a more in-depth discussion can be found in the literature (Lavenberg
and Welch 1981; Avramidis and Wilson 1996), a brief description is offered here.
If Z is a random input variable that is sufficiently correlated to model output,
(f(x)), θ can be defined as the variance-reduced value of f(x) such that
( )
c(
Z[ ]
Z)
f x + ⋅ −E
=
θ , [2.25]
where c is a scaling factor and Z is the control variate. Taking the expected value of both
sides of [1.25] produces
[ ]
E[
( )
x]
Eθ = f , [2.26]
such that θ becomes an unbiased estimator of f(x) when c is any real number. If the
variance of both sides of [2.25] is calculated, the following is obtained:
( )
Var(
f( )
x)
2cCov(
f( )
x ,Z)
c Var( )
ZVarθ = − + 2 . [2.27]
It can be shown that if
( )
(
f Z)
c( )
ZcCov x , Var
2 > 2 , [2.28]
then θ has lower variance than f(x). Further, it can be shown that minimum variance
occurs at
( )
(
f Z)
( )
Zc*=Cov x , /Var . [2.29]
The reduction in variance then can be predicted with
( )
(
1)
Var(
( )
x)
Varθ = −ρ2 f , [2.30]
where ρ is the correlation coefficient between f(x) and Z.
The control variate method can be extended to accommodate multiple control
28
( )
c(
Z[ ]
Z)
c(
Z[ ]
Z)
cj(
Zj E[ ]
Zj)
f + ⋅ − + ⋅ − + + ⋅ −
= x 1 1 E 1 2 2 E 2 ...
θ .
[2.31]
Similarly, the variance of θ is minimized through the choice of optimal values for c1, c2,
…, cj.
For the purpose of readability, references to the output variable f(x) in this
discussion will be replaced with expected cost (Cost), the output variable (or objective
function) specific to this work. Likewise, the variance reduced output variable produced
by the CV method, θ, will be replaced with Costvar, such that [2.25] could be rewritten as:
Costvar = Cost + c·(Z – E[Z]). [2.32]
2.2.4 Application of CV Method
Selection of appropriate control variates is guided by the modeler’s understanding
of sources of variability in the objective function. In this case, the objective function is
expected portfolio cost, Cost, and the source of the variability in the portfolio cost arises
from the purchase of leases and exercise of options. More specifically, the variability can
be identified as arising from variability in both the price and the quantity of transfers
acquired, both of which are linked to variability in reservoir inflows and water demand.
Two control variates are used in the one-year simulation. The majority of
transfers occur at two decision points, the beginning of the year (t0) and in May, the
option exercise month (t5). The lease price at t0 is a function of a known distribution with
a known expected value, obtained from water market lease price data (Watermaster's
Office 2004). Because each individual realization begins at t0 with the initial conditions
29
(unless initial conditions at t0 are changed). Thus, controlling for the variability in the
lease price at t0 accounts for all the cost variability that arises from leases purchased then,
and the lease price at t0 is designated as the first control variate, ZpL.
The second control variate accounts for portfolio cost variability arising from
variability in the quantity of transfers acquired in t5. Within the simulation, both the
monthly rate of new reservoir inflows allocated to the city (NR,i) and the city’s monthly
water demand (Di) have known expected values, and the difference between the two is
the monthly net supply. The second control variate, ZNS, is thus defined as the net supply
from the beginning of the year (t0) to t4, the month prior to the option exercise month,
such that
∑
=
−
= 4
0 ,
t
i
i i R
NS N D
Z . [2.33]
Therefore, below average values of ZNS indicate above average lease purchasing or option
exercising activity in t4. Incorporating [2.33] into [2.32], the variance-reduced cost
estimate for the one-year model (Costvar) can be represented as
[ ]
(
Zp E Zp)
c(
ZNS E[
ZNS]
)
c Cost Cost
L
L − + ⋅ −
⋅ +
= 1 2
var . [2.34]
The optimal values of c (c*) in [34] are not known a priori and will change with
different decision variables and initial conditions. Therefore, values for c and 1* c are *2
estimated for each new set of conditions using a pilot study, involving a very limited
number of realizations that produce correlations between the control variates and Cost.
30
to each other. Without the CV method, the optimizer queries the model with an x, a
vector describing all six decision variables, and the model returns Cost. With the CV
method, the primary simulation (within the ‘Main Model’ in Fig. 2.2) immediately passes
x to the pilot study, which performs a small number of realizations, calculates the c* values and returns them to the main model. The main model then performs the primary
simulation and applies [2.34] with the calculated c* values before returning the
variance-reduced cost estimate (Costvar) to the optimizer. While the pilot study represents a computational investment, it is generally a small investment, and one that pays off in a
decrease in the total number of realizations that must be performed.
Figure 2.2. Schematic of optimization algorithm, model, and pilot study.
Implicit Filtering
x x
Main Model Pilot Study
Call Pilot Study
Simulation
Simulation
Estimate c* c*
θ θ
31 2.2.5 Expansion to Multi-Year Model
A multi-year simulation allows temporary transfers, particularly option contracts,
to be evaluated on a time-scale that may be more useful for water supply planners. While
the expanded model can accommodate any number of years, a 10-year planning horizon
is used here.
From an optimization standpoint, the greatest change made to the simulation is
reflected in the objective function, which is now represented in a multi-year form
[
]
[
]
+ + + =∑
∑∑
∑
= = = = 10 1 11 0 , 10 1 , , , 10 1 ˆ k i L k L k X k X k O O R k R kk N T p N p E N p E N t p t
Cost
[2.35]
where k is the simulation year.
The operation of the hydrologic portion of the simulation is similar to the
single-year simulation with some exceptions. The multi-single-year simulation is set up to account for
annual growth (r) by multiplying each demand value by the term (1 + r)k-1. In addition,
the reliability constraint is modified to accommodate multiple simulation years, such that
the reliability for each year within the simulation period is required to meet a minimum
value. The cost variability constraint in the multi-year scenario is also re-defined such
that the average annual ratio of CVAR-to-expected cost must be less than a specified
value.
In addition to exploring how a longer planning horizon alters optimal portfolio
composition, the multi-year model presents opportunities for examining long-term option
32
provisions to accommodate growth. For example, an annual growth factor can be
attached to the volume of options purchased each year. This growth factor can be
calculated to increase in accordance with rising demand. In this case, model input is
changed such that NO refers to just the number of options purchased in the first year, with
subsequent years’ option purchases defined as
k O k E k
E k
O D D N
N , +1 = , +1− , + , . [2.36]
One last point involves the way in which costs are presented. The budgeting
cycle for utilities is typically annual, driven by a desire to recover costs. Consequently,
costs are presented in annual terms. However, some recognition of the likelihood that
some assets’ costs will accrue over multiple time periods is appropriate. The cost of
permanent rights is annualized (over 20 years using a 6 percent discount rate) as would
be consistent with purchases funded by municipal bonds. The costs of leases and options
are incurred only in the year in which they are bought or exercised (lease and option
agreements expire after one year). The total portfolio cost (the sum of 10 annual costs) is
presented in undiscounted terms as a way of representing the growth in annual costs over
time. While these could be provided in discounted terms, this would not be consistent
(outside of the annualized permanent rights costs) with the way in which water utilities
will evaluate their water supply alternatives.
2.2.6 Application of CV Method to Multi-Year Simulation
The expansion of the model to a multi-year simulation requires several changes in
how the CV method is applied. In the single-year simulation, the CV method is applied
multi-33 year simulation the goal is the reduction of var(
∑
=
10
1
k
k
Cost ). This is accomplished by
applying the CV method to each simulation year separately and calculating a
reduced-variance cost (Costvar,k) for each Costk. Thus, the overall variance of each Costvar,k must be sufficiently reduced such that
var(
∑
= 10 1 var, k kCost ) < var(
∑
=
10
1
k
k
Cost ). [2.37]
In the first year of the multi-year simulation, the control variates used to calculate
Costvar,1, the lease price in t0 (ZpL) and the net supply of new water allocations from t0 to
t4 (ZNS), remain identical to those used in the single-year simulation. The lease price
distribution, however, is dependent upon the reservoir level, but the expected reservoir
level at t0 of year k + 1 is dependent upon its observed value at year k, and thus the mean
of L p
Z cannot be calculated for years two through 10. Therefore, L p
Z is excluded as a
control variate from years two through 10.
The net supply control variate (ZNSE,k) is used in years k > 1 to account for the
variability in the number of transfers that occur in the exercise month (t5). However, the
notation for the net supply control variate is changed to ZNSE,1 (where the superscript E
and subscript 1 denote the early months (t0 to t4) and year one, respectively). The second
control variate is used in years two through 10 and adapts the net supply used in ZNSE ,k to
control for cost volatility arising from the variability of the number of leases purchased at
34
purchased at t0 of year k, one examines the net supply that accrues to the city in the latter
portion of year k-1 (months t5 to t11),
∑
= − − − = 11 5 1 , 1 , , , t t i k i k i R L kNS N D
Z . [2.38]
The CV method, as applied to the multi-year model, is
[ ]
(
)
(
[ ]
E)
NS E
NS p
p EZ c Z E Z
Z c Cost Cost
L
L 2,1 ,1 ,1
1 , 1 1 1
var, = + ⋅ − + ⋅ − , [2.39a]
and
[
]
(
)
(
[
L]
)
k NS L k NS k E k NS E k NS k k
k Cost c Z EZ c Z E Z
Costvar, = + 2, ⋅ , − , + 3, ⋅ , − ,
for k = 2, 3, …, 10. [2.39b]
Control variates are summarized in Table 2.1 including an explanation of how each
relates to increases in output variability and the primary factors that influence that
variability.
Table 2.1. Summary of control variates used in multi-year scenarios
Control Variate
Applied
in Year(s) Uses…
… to Account for Volatility Arising from… …Which is Influenced by… L p
Z 1 The lease price at t0 Price variability of leases purchased at the
beginning of the year (t0)
Reservoir storage in t0.
E k NS
Z , 1 – 10 The rate of new water allocation (net supply) from t0 to t4 in year k
Variability in leases purchased and/or options exercised in t5 in year k
Volume of water available to city in t5.
L k NS
Z , 2 – 10 The net supply from months t5 to t11 in year k-1
Variability in quantity of leases purchased in t0 of year k