INSIGHT INTO THE FIDELITY OF ESCHERICHIA COLI RNA POLYMERASE: INVESTIGATION OF MISINCORPORATION DURING TRANSCRIPTION
ELONGATION UTILIZING TRANSIENT STATE KINETICS
by
Candice Kermitta Cunningham
A dissertation submitted to the faculty of the University of North Carolina at Chapel Hill in partial fulfillment of the requirements for the degree of Doctor of Philosophy in the
Department of Chemistry.
Chapel Hill 2007
Approved by:
Advisor: Dr. Dorothy A. Erie
Reader: Dr. Linda L. Spremulli
ABSTRACT
CANDICE K. CUNNINGHAM: Insight into the Fidelity of Escherichia coli RNA Polymerase: Investigation of Misincorporation During Transcription Elongation Utilizing
Transient State Kinetics
(Under the direction of Dr. Dorothy A. Erie)
Concentration-dependent pre-steady state kinetics of correct nucleotide incorporation led to a proposed mechanism for transcription involving multiple conformational states of RNA polymerase (RNAP). Specifically, RNAP can exist in an unactivated state or an activated state. Transition between the two states is driven by conformational changes in RNAP following templated NTP binding to an allosteric site. Further investigation led to a structural model, where the movement of the allosteric site upon NTP binding facilitates translocation of the enzyme via a ratchet motion.
In this work, I use transient state kinetics to investigate the NTP concentration-dependence of misincorporation (UMP for CMP). I demonstrate misincorporation occurs only in the activated state while a subset of complexes enters into a non-productive
unactivated state. Complexes in the non-productive state are “trapped” by an incorrect NTP bound in the catalytic site. I demonstrate the non-productive and “irreversibly” bound NTP is removed from the catalytic site in the presence of the correct NTP. Combining these data with structural analyses, I present a structural model for misincorporation similar to the model for correct incorporation with several key differences. I also characterize the concentration-dependent misincorporation kinetics for ∆-loop RNAP with residues R542-F545 deleted from fork loop 2, the proposed allosteric site. Deletion of the four residues enhances the fidelity of RNAP, suggesting fork loop 2 is an allosteric site responsible for the
fast phase of synthesis during transcription elongation.
Correct and incorrect incorporation kinetic assays using RNAP with mutations in the secondary channel demonstrate that βD675Y (E.coli) RNAP is a low fidelity variant,
significantly increasing the amount of misincorporation when initiated from the promoter. I demonstrate βD765Y RNAP exhibits a higher fidelity from purified complexes, suggesting
that the experimental procedure affects the fidelity of this variant RNAP. I also reveal a zero-order dependence on the apparent rate of misincorporation with a continual increase in the extent of misincorporation for [UTP] < 75µM in βD675Y RNAP. Considering recent
crystal structures of RNAP II and T. Thermophilus RNAP, I posit βD675Y affects the closing
For Logan and Emily, who continually remind me that it’s really the simple things in life that make it worth living…
ACKNOWLEDGEMENTS
First, I would like to thank my advisor, Dorothy Erie, whose enthusiasm for science continually reignites my own passion for the subject. Above all else, by her example she has taught me the importance of integrity as a scientist and in doing so, has taught me about the scientist I want to be. I would like to thank the rest of my committee, Thomas Kunkel, Linda Spremulli, Nancy Thompson, and Dick Wolfenden for continued support through the years. Many thanks go to Shannon Holmes who welcomed me and trained me when I first joined the lab. She has continued to offer her encouragement and insight even after leaving UNC. I thank the lab for always keeping things interesting and for making this experience one I will never forget. In particular, I would like to thank Scott Kennedy for answering all of my seemingly endless questions, for offering helpful feedback when I needed it most, for insightful discussions about life and transcription, and for making me laugh when I didn’t think I could.
seven years. He has always been there to make me laugh when I needed it most. He is also the reason I am blessed to be an aunt to two wonderful children, Logan and Emily, whose laughter can brighten my day even from 500 miles away. Last, but certainly not least, I want to thank my mom and dad who by the example that is the life they live have taught me the importance of hard work and dedication. Through the life and love they share, they have taught me that it is never okay to give up on something you want just because at times it becomes difficult or frustrating. They have continually encouraged me in every endeavor I have undertaken, they were proud of me when I couldn’t be proud of myself, and they have loved me. They are more than my parents. They are my best friends and for this I will forever be grateful.
TABLE OF CONTENTS
LIST OF TABLES ... x
LIST OF FIGURES ... xi
LIST OF ABBREVIATIONS ... xiv
CHAPTER ONE: TRANSCRIPTION ELONGATION ... 1
Introduction... 1
RNA Polymerase Structure... 4
Conformational States of the Elongation Complex ... 10
Bibliography ... 16
CHAPTER TWO: ACTIVE DISPLACEMENT OF NTPS DURING TRANSCRIPTION ELONGATION: A STRUCTURAL MODEL FOR MISINCORPORATION AND RESCUE ... 20
Introduction... 20
Results ... 35
Concentration-Dependence of UMP Incorporation Using Wild Type RNAP ... 36
Chase Reactions from Wild Type RNAP ... 45
Concentration-Dependence of UMP Incorporation Using ∆-loop RNAP ... 49
Chase Reactions from ∆-loop RNAP... 59
Discussion ... 62
Structural Model of Incorrect Nucleotide Incorporation - Activated
State Synthesis... 77
Structural Model of Incorrect Nucleotide Incorporation - Non-Product Binding in the Unactivated State... 81
Active Displacement of Non-Productively Traped NTP by Correct Nucleotide... 84
Experimental Procedures... 85
Sources of protein and DNA... 85
In vitro transcription reactions - misincorporation from promoter initiation.... 86
In vitro transcription reactions - purified stalled elongation complexes... 86
Chase reactions... 87
Rapid quench chase reactions... 88
Quantification and normalization of rate data... 88
Fits of the kinetic data to the mechanism... 89
Bibliography ... 91
CHAPTER THREE: KINETIC INVESTIGATION OF MISINCORPORATION UTILIZING ESCHERICHIA COLI RNA POLYMERASE WITH MUTATIONS IN THE SECONDARY CHANNEL ... 95
Introduction... 95
Results and Discussion... 103
Concentration-Dependence of UMP Incorporation Utilizing βD675Y RNAP ... 103
Recent Crystal Structures Provide Further Structural Insight into βD675Y RNAP ... 121
Future Direction... 125
Acknowledgements ... 127
Experimental Procedures... 127
Sources of protein and DNA... 127
In vitro transcription reactions - misincorporation from promoter initiation.. 127
In vitro transcription reactions - purified stalled elongation complexes... 128
Quantification and normalization of rate data... 129
Fits of the kinetic data to the mechanism... 129
Bibliography ... 131
LIST OF TABLES
Table 1.1 Different conformational states of the elongation complex subject
to synthesis and regulation... 14 Table 2.1 Simulated rates of the non-essential activation mechanism... 75 Table 3.1 Rates of misincorporation simulated using the basic mechanism
shown in Figure 3.7 ... 113
LIST OF FIGURES
Figure 1.1 The transcription cycle... 3 Figure 1.2 Space-filled model of the overall structure of T. Aquaticus
RNAP elongation complex ... 8 Figure 1.3 Model of the bacterial elongation complex based on T. aquaticus
structure... 9 Figure 1.4 Different conformations of key structural elements in S. cerevisiae
RNAP II ... 11 Figure 1.5 Different conformational states of the elongation complex ... 13 Figure 2.1 Original kinetic mechanism deduced from misincorporation
experiments carried out by Erie et al. ... 23 Figure 2.2 The proposed mechanisms of nucleotide addition for transcription
elongation... 26 Figure 2.3 Model of the proposed RNAP allosteric site and the ratchet motion
facilitating translocation... 29 Figure 2.4 Model for NTP addition ... 33 Figure 2.5 Representative denaturing gels showing UMP misincorporation at
position +25 from purified complexes from wild type RNAP stalled at
position +24 in the nascent RNA chain ... 37 Figure 2.6 Plots of percent misincorporated complexes at position +25 versus
time at (A) 5 – 50µM UTP and (B) 50-600µM UTP... 41
Figure 2.7 Plot of rate (kapp, min-1) versus [UTP] (µM)... 43 Figure 2.8 Plot of maximum extent of misincorporation (%) versus [UTP] (µM). ... 44
Figure 2.9 Plot of the disappearance of complexes out of position +24 following the addition of CTP after 10 minutes of misincorporation ... 48 Figure 2.10 Representative denaturing gels showing UMP misincorporation
in ∆-loop RNAP at position +25 initiated from the promoter with
Figure 2.11 Representative denaturing gels showing UMP misincorporation with ∆-loop RNAP at position +25 from purified complexes stalled
at position +24 in the nascent RNA chain. ... 52
Figure 2.12 Plot of percent misincorporated complexes at position +25 versus time at a low (20µM), intermediate (75µM), and high (600µM) concentration of UTP utilizing the ∆-loop RNAP ... 56
Figure 2.13 Rate (kapp, min-1) versus [UTP] (µM) for wild type and ∆-loop mutant RNAP ... 57
Figure 2.14 Plot of maximum extent of misincorporation (%) versus [UTP] (µM) for wild type and ∆-loop mutant RNAP... 58
Figure 2.15 Plot of the disappearance of complexes out of position +24 following the addition of CTP after 10 minutes of misincorporation for wild type and ∆-loop mutant ... 61
Figure 2.16 Mechanism adapted from the original misincorporation mechanism... 66
Figure 2.17 HDAg-stimulated elongation mechanism proposed by Nedialkov et al. ... 67
Figure 2.18 TFIIF-stimulated mechanism proposed by Nedialkov et al. ... 68
Figure 2.19 Ratchet mechanism proposed to describe correct and incorrect nucleotide incorporation in E. coli RNAP ... 70
Figure 2.20 Average kinetic data for UTP concentrations (A) 5-50µM and (B) 50-600µM fit by a single set of rate constants to the non-essential activation mechanism in Figure 2.21... 72
Figure 2.21 Non-essential activation mechanism describing misincorporation by E. coli RNAP... 74
Figure 2.22 An approximate model for activated state incorporation of an incorrect nucleotide into the nascent RNA chain ... 79
Figure 2.23 The open and closed conformations of the trigger loop affect the accessibility of the catalytic site through the secondary channel ... 82
Figure 2.24 An approximate model for a non-productive and “irreversibly” bound NTP in the unactivated state. ... 83
Figure 3.1 Plots of correct incorporation of CMP at position +25 versus time by wild type and RNAP variants with amino acid substitutions in the secondary channel... 97
Figure 3.2 Plot of the disappearance of complexes at position +24 after incorrect nucleotide incorporation of UMP for CMP by wild type and RNAP
variants with amino acid substitutions in the secondary channel ... 99 Figure 3.3 Misincorporation kinetics of wild type, βD675Y, and βD675V RNAPs ... 101
Figure 3.4 Representative denaturing gels showing UMP misincorporation by βD675Y RNAP at position +25 from purified complexes stalled at
position +24 in the nascent RNA chain ... 106 Figure 3.5 Plots of percent misincorporated complexes at position +25 from
βD675Y RNAP versus time at (A) 10 – 50µM UTP and
(B) 50-600µM UTP... 108 Figure 3.6 Plots of percent misincorporated complexes at position +25 versus
time at (A) 10µM UTP and (B) 600µM for wild type RNAP
and D675Y RNAP ... 110 Figure 3.7 Basic branched kinetic pathway used to determine the simulated
rates for misincorporation by wild type and variant RNAPs shown
in Table 3.1 ... 112 Figure 3.8 Plot of maximum extent of misincorporation (%) versus [UTP] (µM)
for wild type enzyme and βD675Y RNAP ... 117
Figure 3.9 Plot of rate (kapp, min-1) versus [UTP] (µM) for the wild type enzyme
and the βD675Y RNAP... 118 Figure 3.10 Potential changes in the trigger loop closing over the catalytic site
LIST OF ABBREVIATIONS
3′ three prime end
5′ five prime end
~ approximately ° degrees
> greater than
< less than
% percent
α alpha
Å angstrom
A adenosine monophosphate
AMP adenosine-5’-monophosphate AMP-CPP α,β-methyleneadenosine 5’-triphosphate ATP adenosine-5’-triphosphate β beta
β′ beta prime
BSA bovine serum albumin
°C degrees Celsius
Ci curie C cysteine
C cytidine monophosphate
CMP cytidine-5’-monophosphate
CTP cytidine-5’-triphosphate
∆ delta (deletion)
D aspartate ddH2O distilled, deionized water
DE dead end
DE13 a specific DNA sequence described in detail in the text
DNA deoxyribonucleic acid
DNAP deoxyribonucleic acid polymerase DTT dithiothreitol
EC elongation complex
E. coli Escherichia coli
EDTA ethylenediaminetetraacetic acid
ES enzyme-substrate complex
et al. and others
F phenylalanine
G guanosine monophosphate
GTP guanosine-5’-triphosphate H histidine
HEPES 4-(2-hydroxyethyl)-1 piperazineethanesulfonic acid his histidine
H. sapiens Homo sapiens
in vivo inside a living system
k rate constant
K dissociation constant
K+ potassium cation
λ lambda
L leucine L liter M molar m milli µ micro µM-1 inverse micromolar
Mg2+ magnesium cation
m milli min minutes
min-1 inverse minutes
mol mole n nano N asparagine
Ni+2 nickel cation
NMP nucleoside 5’-monophosphate
nt nucleotide
NTP nucleoside 5’-triphosphate
ω omega
OH hydroxyl group
p plasmid designation
32
P radioactive phosphorus-32
PR “rightward” promoter
PCR polymerase chain reaction pDE13 plasmid of the DE13 sequence
Pol II RNA polymerase II
PPi pyrophosphate ion
Q antitermination protein factor ν rate
R arginine
RNA ribonucleic acid
RNAP ribonucleic acid polymerase
RNAP II RNA polymerase II S substrate
s-1 per second
S. cerevisiae Saccharomyces cerevisiae
SEC stalled elongation complex sec second
sec-1 per second
σ sigma
T. aquaticus Thermus aquaticus
TEC ternary elongation complex T. thermophilus Thermus thermophilus
UMP uridine-5’-monophosphate UTP uridine-5’-triphosphate V valine
Y tyrosine
CHAPTER 1: TRANSCRIPTION ELONGATION
Introduction
The process of synthesizing RNA from double-stranded DNA is known as
transcription. Transcription is first in a series of events that leads to expression of the genetic information encoded within DNA. The enzyme responsible for carrying out transcription at reasonable rates and with high fidelity is known as RNA polymerase (RNAP). All cellular organisms make use of the multi-subunit RNAP to synthesize nearly all of the RNA in the cell. Escherichia coli RNAP has been well characterized and is similar to other prokaryotic and eukaryotic systems, making E. coli RNAP an ideal enzyme to study (Sweetser et al. 1987; Zhang et al. 1999; Cramer et al. 2001). RNAP core enzyme is approximately 450kDa in size and consists of 5 subunits: 2 α, β, β’, and ω. Another subunit, σ, is required for
promoter recognition to initiate transcription. The σ subunit with the core enzyme constitutes the holoenzyme (Sweetser et al. 1987). Within the active site of the enzyme, there is a Mg2+ cation that directly participates in phosphodiester bond formation, making this ion essential for transcription (Suh et al. 1992).
transcription bubble. Initiation is characterized by the binding of the first nucleotide to the RNAP and pairing with its complement on the template strand of the DNA. The enzyme remains at the promoter during initiation until approximately 6-9 nucleotides have been
added to the growing RNA chain. Following successful synthesis of these 6-9 nucleotides, the σ subunit is released and the RNAP core enzyme escapes the promoter region such that
transcription enters the elongation phase (Lewin 2000). During elongation, the ternary
complex (RNAP, DNA template, nascent RNA chain) is kinetically stable and does not dissociate. As the enzyme moves along the DNA, the DNA is unwound at the front end of the transcription bubble, while the duplex is simultaneously rewound at the back. RNA is
also displaced as a free polynucleotide chain. This process is totally processive, meaning that if the RNAP dissociates from the DNA at any time during transcription, RNAP core enzyme must rebind the σ initiation factor to rebind the promoter region of the DNA and begin
synthesis anew (Landick 1999). Eventually, RNAP will come to the end of the gene being transcribed and enter the termination phase of transcription. During termination, the
transcription bubble collapses as the RNA-DNA hybrid is disrupted. The DNA reforms the duplex state and the core enzyme and RNA are released. The studies presented here are focused on the elongation phase of transcription.
Initiation
Elongation
Termination
Core
Promoter
Transcription
Holoenzyme
Cycles
Sigma Regulatory Factor
Coding Terminator
Figure 1.1: The transcription cycle. The holoenzyme (core plus subunit σ) is shown in
green, the core (subunits α2ββ’ω) is shown in blue, and the sigma subunit (σ) is shown in
red. The four phases of transcription (promoter binding, initiation, elongation, and
Each nucleotide addition to the RNA chain involves a series of steps. First, the NTP to be added to the growing chain binds to the RNA polymerase. After binding, there is a phosphotransfer reaction at the α/β phosphodiester bond of the incoming NTP and the 3’
hydroxyl of the nucleotide at the end of the RNA chain. Following the phosphotransfer
reaction, pyrophosphate is released. Finally, the RNAP active site is translocated relative to the 3’ end of the growing chain (Erie et al. 1992). The state prior to translocation is known
as the pre-translocated state. Similarly, after translocation, the enzyme is said to be in the post-translocated state.
The entire process of melting, synthesizing, annealing, and displacing must occur at a
reasonable rate. In E. coli, this rate on average is approximately 30-100 nucleotides per second during transcription elongation (Mooney et al. 1999). The process must also be
carried out with a high fidelity (a low occurrence of incorrect nucleotide incorporation). Therefore, transcription by E. coli RNAP is one of the most highly regulated systems in the cell. Regulation occurs through the use of accessory proteins that bind the ternary complex,
the DNA template, or the RNA transcript. Elongation is also regulated by particular sequence elements in the DNA or the RNA (e.g. pause sites, etc.) that interact with the
RNAP to modulate the rate and/or fidelity of the enzyme during RNA synthesis.
RNA Polymerase Structure
Understanding of the structure of RNA polymerase has been significantly expanded in the past 10 years with the advent of high-resolution three-dimensional crystal structures
from both prokaryotic and eukaryotic RNAPs. Specifically, several crystal structures of prokaryotic Thermus aquacitcus core (Zhang et al. 1999) and Thermus thermophilus
holoenzyme (Vassylyev et al. 2002) and eukaryotic Saccharomyces cerevisiae RNAP II core (Cramer et al. 2001) and S. cerevisiae RNAP II elongation complexes (Gnatt et al. 2001) have been published. More recently, RNAP II and T. thermophilus RNAP have been solved
with the DNA, the RNA-DNA hybrid, and various NTPs and NTP analogs bound in the catalytic site (Cramer et al. 2001; Gnatt et al. 2001; Kettenberger et al. 2004; Westover et al.
2004; Wang et al. 2006; Vassylyev et al. 2007). These structures have provided tremendous insight into the structure/function relationship of transcription elongation complexes.
The overall structure of RNA polymerase resembles the shape of a crab claw with the two “jaws” of the claw formed by the two largest subunits of the enzyme, β and β’ (Figures
1.2 and 1.3) (Zhang et al. 1999; Cramer et al. 2001). The catalytic site is located at the base of the cleft formed between the β and β’ subunits. A magnesium ion that is required for
synthesis is located in the catalytic site where the ion is chelated by a catalytic triad of three
invariant aspartic acid residues (Zhang et al. 1999). The main channel of the enzyme, spanning the length of the crab claw, is 27Å in width. This channel houses the RNA-DNA
hybrid (Figures 1.2 and 1.3) (Zhang et al. 1999; Gnatt et al. 2001). There are several other important structural elements of the RNAP that are located in the main channel. The bridge helix (F-helix) located in the β’ subunit spans the main channel, abutting the RNA-DNA
hybrid, and is thought to play a role in translocation (Figure 1.3) (Epshtein et al. 2002;
Artsimovitch et al. 2003; Temiakov et al. 2005; Bar-Nahum et al. 2005; Tuske et al. 2005). Another structural element located between the main channel and the secondary channel is
Another structural feature found in all structures of RNA polymerases is the
secondary channel which leads directly into the catalytic site of the enzyme (Figures 1.2 and 1.3). The secondary channel is located on the β’ subunit and is approximately 10-12Å in
diameter at its narrowest point and 45Å in length, which makes the channel large enough to
accommodate one diffusing NTP at a time (Zhang et al. 1999; Korzheva et al. 2000). This pore has been considered the primary means of NTP entry into the catalytic site for
nucleotide binding and incorporation during transcription (Zhang et al. 1999; Korzheva et al. 2000; Cramer et al. 2000; Cramer et al. 2001; Gnatt et al. 2001; Vassylyev et al. 2002;
Batada et al. 2004; Kettenberger et al. 2004; Westover et al. 2004; Armache et al. 2005;
Temiakov et al. 2005). However, the size of the pore could potentially lead to a trafficking problem if all four NTPs must enter the catalytic site through this secondary channel. As
such, other researchers have proposed that the primary pathway for NTP entry into the catalytic site is through the main channel (Nedialkov et al. 2003; Burton et al. 2005; Gong et al. 2005; Zhang et al. 2005). The secondary channel is also believed to play a role in
regulation during transcription elongation. Specifically, the secondary channel is believed to function as an extrusion point of RNA during backtracking (Zhang et al. 1999; Artsimovitch
& Landick 2000; Toulme et al. 2000). Backtracking is the process in which RNAP
translocates backwards along the DNA template displacing the 3’ end of the RNA transcript from the catalytic site (Reeder & Hawley 1996; Komissarova & Kashlev 1997; Nudler et al.
1997). The extrusion of the RNA through the secondary channel provides the substrate for GreA and GreB factor induced cleavage and thereby plays a role in the regulation of RNAP
during transcription elongation (Komissarova & Kashlev 1997; Artsimovitch & Landick 2000; Toulme et al. 2000).
The RNA-DNA hybrid and melted DNA bubble lie in the main channel of the RNA polymerase between the rudder (upstream end) and the bridge helix and catalytic magnesium (downstream end) (Figure 1.3) (Korzheva et al. 2000). The bend angle between the
downstream DNA and upstream duplex DNA is 90° (Figure 1.3) (Korzheva et al. 2000; Gnatt et al. 2001). The rudder is thought to maintain the upstream edge of the RNA-DNA hybrid by separating exiting RNA from the DNA, while fork loop 2 (βD loop I), another
Figure 1.2: Space-filled model of the overall structure of T. aquaticus RNAP elongation complex. The overall structure of RNA polymerase resembles a crab claw shape with the
RNA-DNA hybrid resting in the main channel formed between the two “jaws” of the claw. The β-subunit is shown in cyan, β’-subunit is pink, the two α-subunits and the ω-subunit is
shown in white. The non-template strand of the DNA is shown in yellow, with the template strand of the DNA in red. The RNA is shown in brown and can be seen via the secondary channel located in the β’-subunit (PDB 1I6V).
Figure 1.3: Model of the bacterial elongation complex based on T. aquaticus structure
(Korzheva et al. 2000). The β-subunit is shown in cyan, β’-subunit is pink, the two
α-subunits and the ω-subunit is shown in white. The non-template strand of the DNA is shown
in yellow, with the template strand of the DNA in red. The RNA is shown in gold and can be seen via the secondary channel located in the β’-subunit. Numerous important structural
Conformational States of the Elongation Complex
RNAP has been shown to exist in different states during transcription elongation (Erie et al. 1992; Erie et al. 1993; Matsuzaki et al. 1994; Kubori & Shimamoto 1996; Coulombe &
Burton 1999; Yin et al. 1999; Davenport et al. 2000; Foster et al. 2001; Guthold & Erie 2001; Erie 2002; Tolic-Norrelykke et al. 2004). These different states result from
conformational changes in the enzyme during transcription. Many of the important structural elements mentioned previously have been shown to exist in different conformations. The F-helix is seen in S. cerevisiae in a straight conformation (Cramer et al. 2000; Gnatt et al.
2001) while the F-helix is bent in the T. thermophilus holoenzyme (Vassylyev et al. 2002). The motions of the F-helix between the bent and straight conformations have been suggested
to play a key role in translocation during transcription elongation (Epshtein et al. 2002; Artsimovitch et al. 2003; Temiakov et al. 2005; Bar-Nahum et al. 2005; Tuske et al. 2005). The trigger loop, required for proper catalysis, has also been seen in different conformations
in both S. cerevisiae and T. thermophilus (Figure 1.4). The trigger loop is seen in an open conformation and a closed conformation. In the closed conformation, the trigger loop rests over the catalytic site and blocks access to the catalytic site via the secondary channel
(Vassylyev et al. 2007). Additionally, fork loop 2 is seen in different conformations including an open, partially open and closed configuration (Figure 1.4).
Figure 1.4: Different conformations of key structural elements in S. cerevisiae RNAP II. DNA template strand (grey), non-template strand (dark blue), and RNA (red) are from PDB 1Y77. The bound GTP (light purple) is from 2E2H. The bridge helix (orange) is from
1Y1V. The trigger loop exists in an “open” conformation (green, 1Y1V) and a closed conformation (magenta, 2E2H). Fork loop 2 is shown in three conformations: “open”
RNAP is required to processively synthesize RNA at reasonable rates and with high fidelity. These stringent requirements make transcription by RNA polymerase the most highly regulated processes in gene expression. The different conformational states observed
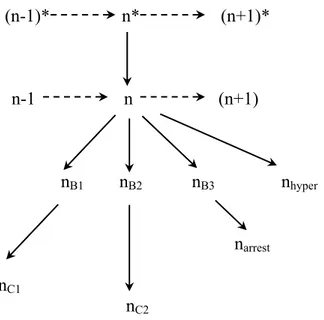
for RNAP elongation complexes play different roles in this regulation of transcription (Erie 2002). The different states of RNAP during transcription elongation are shown in Figure 1.5.
Primarily, RNAP exists in a long-lived activated state (n*). This activated state is characterized by rapid synthesis and low fidelity (Erie et al. 1993). RNAP can also exist in an unactivated state (n). RNAP in this state is capable of incorporating NTPs but synthesis is
much slower than activated state synthesis. As such, the unactivated state is a higher fidelity state and is susceptible to regulation. From the unactivated state, RNAP can decay into states
that are not capable of synthesis. These states, however, function in the regulation of
transcription. In the hypertranslocated state (nhyper), RNAP slips forward along the DNA
template and the 3’-end of the RNA transcript becomes displaced from the catalytic site. In
the backtracked state (nB1, nB2, and nB3), RNAP translocates backwards along the DNA
displacing the 3’ end of the RNA. From the backtracked state, the enzyme can decay into
cleavage states (nC1, and nC2) in which RNAP hydrolyzes the RNA transcript, creating a new
3’-end, or into arrest states (dead-end states) (narrest) in which elongation cannot be resumed
even in the presence of high concentrations of all four NTPs. Table 1.1 summarizes the
different conformational states and the accessory proteins that are capable of recognizing and acting on each of these states. The distribution of complexes between these states is
regulated by many different factors, including the DNA, RNA, and the accessory proteins
(Erie 2002).
(n-1)* n* (n+1)*
n-1 n (n+1)
nB1 nB2 nB3 nhyper
narrest
nC1
nC2
Figure 1.5: Different conformational states of the elongation complex (Erie 2002). n* is
the activated state. After entering the unactivated state (n), complexes can undergo further
conformational changes to backtracked states (nB), cleavage states (nC), arrest states (narrest),
or hypertranslocated states (nhyper). n* and n are synthesis states. n, nB, and narrest are all
regulatory states. nC is a rescue state. The transitions between states are shown with single
State Conformation Synthesis/ Cleavage
Accessory proteins acting on state Activated
[fast] (n*) Poised for catalysis Synthesis T4 alc termination protein
Unactivated [slow] (n)
Suboptimal conformation for catalysis
Synthesis GreA, GreB, rho
NusA, NusG, Gfh1 Backtracked
(nB)
RNAP reverse translocated on DNA, 3’ end of RNA extruded from 2° channel
Cleavage (nC)
GreA, GreB, Gfh1, NusG
Hypertranslocated (nhyper)
Active site slipped forward relative to 3’ end
No synthesis/ no cleavage
NusA
Arrested (dead end) (narrest)
Similar to back tracked state but no synthesis
No synthesis/ no cleavage
Reactivated by GreB cleavage
Table 1.1: Different conformational states of the elongation complex subject to synthesis
and regulation (Erie 2002). The table summarizes the specific conformation of each state
and whether or not it is a synthesis-competent state. Accessory proteins recognizing the
different conformational states of the enzyme are also displayed.
A significant amount of the biochemical and structural information available for transcription elongation by RNAP was obtained through experiments examining the correct incorporation of a nucleotide into the growing RNA chain. This study returns the focus to
misincorporation. Misincorporation, incorporation of an incorrect nucleotide, has been shown to occur at rates slower than that of correct incorporation (Erie et al. 1993).
Capitalizing upon these slower rates may make it possible to investigate conformational states of elongation complexes that cannot be observed during correct incorporation. These conformational states are believed to be poorly populated during rapid synthesis but may still
be physiologically important in regulation (Erie et al. 1993). Determining the rate limiting steps through the use of misincorporation studies should allow for the determination of the
steps subjected to regulation. Specifically, we can use transient state kinetics to determine the steps in the incorrect nucleotide addition cycle. Determining the steps in
misincorporation taken together with correct incorporation data and recently published
Bibliography
Armache, K.J., Mitterweger, S., Meinhart, A. and Cramer, P. (2005). “Structures of complete RNA polymerase II and its subcomplex, Rpb4/7.” J.Biol.Chem. 280(8): 7131-7134.
Artsimovitch, I., Chu, C., Lynch, A.S. and Landick, R. (2003). "A new class of bacterial RNA polymerase inhibitor affects nucleotide addition." Science 302(5645): 650-654.
Artsimovitch, I. and Landick, R. (2000). "Pausing by bacterial RNA polymerase is mediated by mechanistically distinct classes of signals." Proc.Natl.Acad.Sci.U.S.A. 97(13): 7090-7095.
Bar-Nahum, G., Epshtein, V., Ruckenstein, A.E., Rafikov, R., Mustaev, A. and Nudler, E. (2005). "A ratchet mechanism of transcription elongation and its control." Cell 120(2): 183-193.
Batada, N.N., Westover, K.D., Bushnell, D.A., Levitt, M. and Kornberg, R.D. (2004). “Diffusion of nucleoside triphosphates and role of the entry site to the RNA polymerase II active center.” Proc.Natl.Acad.Sci.U.S.A. 101(50): 17361-17364.
Burton, Z.F., Feig, M., Gong, X.Q., Zhang, C., Nedialkov, Y.A. and Xiong, Y. (2005). “NTP-driven translocation and regulation of downstream template opening by multi-subunit RNA polymerases.” Biochem.Cell.Biol. 83(4): 486-496.
Coulombe, B. and Burton, Z.F. (1999). "DNA bending and wrapping around RNA polymerase: a "revolutionary" model describing transcriptional mechanisms." Microbiol.Mol.Biol.Rev. 63(2): 457-478.
Cramer, P., Bushnell, D.A. and Kornberg, R.D. (2001). "Structural basis of transcription: RNA polymerase II at 2.8Å resolution." Science 292(5523): 1863-1876.
Cramer, P., Bushnell, D.A., Fu, J., Gnatt, A.L., Maier-Davis, B., Thompson, N.E., Burgess, R.R., Edwards, A.M., David, P.R. and Kornberg, R.D. (2000). “Architecture of RNA polymerase II and implications for the transcription mechanism.” Science 288(5466): 640-649.
Davenport, R.J., Wuite, G.J., Landick, R. and Bustamante, C. (2000). "Single-molecule study of transcriptional pausing and arrest by E. coli RNA polymerase." Science 87(5462): 2497-2500.
Epshtein, V., Mustaev, A., Markovtsov, V., Bereshchenko, O., Nikiforov, V. and Goldfarb, A. (2002). "Swing-gate model of nucleotide entry into the RNA polymerase active center." Mol.Cell 10(3): 623-634.
Erie, D.A. (2002). "The many conformational states of RNA polymerase elongation
complexes and their roles in the regulation of transcription." Biochim.Biophys.Acta. 1577(2): 224-39.
Erie, D.A., Hajiseyedjavadi, O., Young, M.C. and von Hippel, P.H. (1993). "Multiple RNA polymerase conformations and GreA: control of the fidelity of transcription." Science 262(5135): 867-873.
Erie, D.A., Yager, T.D. and von Hippel, P.H. (1992). "The single-nucleotide addition cycle in transcription: a biophysical and biochemical perspective."
Annu.Rev.Biophys.Biomol.Struct. 21: 379-415.
Foster, J.E., Holmes, S.F. and Erie, D.A. (2001). "Allosteric binding of nucleoside
triphosphates to RNA polymerase regulates transcription elongation." Cell 106(2): 243-252.
Gnatt, A.L., Cramer, P., Fu, J., Bushnell, D.A. and Kornberg, R.D. (2001). "Structural basis of transcription: an RNA polymerase II elongation complex at 3.3Å resolution." Science 292(5523): 1876-1882.
Gong, X.Q., Zhang, C., Feig, M. and Burton, Z.F. (2005). “Dynamic error correction and regulation of downstream bubble opening by human RNA polymerase II.” Mol.Cell. 18(4): 461-470.
Guthold, M. and Erie, D.A. (2001). "Single-molecule study reveals a complex E. coli RNA polymerase." Chembiochem. 2(3): 167-70.
Kettenberger, H., Armache, K.J. and Cramer, P. (2004). "Complete RNA polymerase II elongation complex structure and its interactions with NTP and TFIIS." Mol.Cell. 16(6): 955-965.
Komissarova, N. and Kashlev, M. (1997). "RNA polymerase switches between inactivated and activated states by translocating back and forth along the DNA and the RNA." J.Biol.Chem. 272(24): 15329-15338.
Korzheva, N., Mustaev, A., Kozlov, M., Malhotra, A., Nikiforov, V., Goldfarb, A. and Darst, S.A. (2000). "A structural model of transcription elongation." Science 289(5479): 619-625.
Kubori, T. and Shimamoto, N. (1996). "A branched pathway in the early stage of transcription by Escherichia coli RNA polymerase." J.Mol.Biol. 256(3): 449-57.
Landick, R. (1999). “Shifting RNA polymerase into overdrive.” Science 584(5414): 598- 599.
Matsuzaki, H., Kassavetis, G.A. and Geiduschek, E.P. (1994). "Analysis of RNA chain elongation and termination by Saccharomyces cerevisiae RNA polymerase III." J.Mol.Biol. 235(4): 1173-1192.
Mooney, R.A., Artsimovitch, I. and Landick, R. (1998). “Information processing by RNA polymerase: Recognition of regulatory signals during RNA chain elongation.” J.Bacteriol. 180(13):3265-75.
Nedialkov, Y.A., Gong, X.Q., Hovde, S.L., Yamaguchi, Y., Handa, H., Geiger, J.H., Yan, H. and Burton, Z.F. (2003). "NTP-driven translocation by human RNA polymerase II." J.Biol.Chem. 278(20): 18303-18312.
Nudler, E., Mustaev, A., Lukhtanov, E. and Goldfarb, A. (1997). "The RNA-DNA hybrid maintains the register of transcription by preventing backtracking of RNA
polymerase." Cell 89(1): 33-41.
Reeder, T.C. and Hawley, D.K. (1996). "Promoter proximal sequences modulate RNA polymerase II elongation by a novel mechanism." Cell 87(4): 767-777.
Suh, W.C., Leirmo, S. and Record, M.T. Jr. (1992). “Roles of Mg2+ in the mechanism of formation and dissociation of open complexes between Escherichia coli RNA polymerase and the λPR promoter: Kinetic evidence for a second open complex requiring Mg2+.” Biochemistry 31: 7815-7825.
Sweetser, D., Nonet, M. and Young, R.A. (1987). "Prokaryotic and eukaryotic RNA polymerases have homologous core subunits." Proc.Natl.Acad.Sci.U.S.A. 84(5): 1192-6.
Temiakov, D., Zenkin, N., Vassylyeva, M.N., Perederina, A., Tahirov, T.H., Kashkina, E., Savkina, M., Zorov, S., Nikiforov, V., Igarashi, N., Matsugaki, N., Wakatsuki, S., Severinov, K. and Vassylyev, D.G. (2005). “Structural basis of transcription inhibition by antibiotic streptolydigin.” Mol.Cell. 19(5): 655-666.
Tolić-Nørrelykke, S.F., Engh, A.M., Landick, R. and Gelles, J. (2004). "Diversity in the rates of transcript elongation by single RNA polymerase molecules." J.Biol.Chem. 279(5): 3292-3299.
Toulme, F., Mosrin-Huaman, C., Sparkowski, J., Das, A., Leng, M. and Rahmouni, A.R. (2000). "GreA and GreB proteins revive backtracked RNA polymerase in vivo by promoting transcript trimming." EMBO.J. 19(24): 6853-9.
Tuske, S., Sarafianos, S.G., Wang, X., Hudson, B., Sineva, E., Mukhopadhyay, J., Birktoft, J.J., Leroy, O., Ismail, S., Clark, A.D. Jr., Dharia, C., Napoli, A., Laptenko, O., Lee, J., Borukhov, S., Ebright, R.H. and Arnold, E. (2005). "Inhibition of bacterial RNA polymerase by streptolydigin: Stabilization of a straight-bridge-helix active-center conformation." Cell 122(4): 541-552.
Vassylyev, D.G., Vassylyeva, M.N., Zhang, J., Palangat, M., Artsimovitch, I. and Landick, R. (2007). "Structural basis for substrate loading in bacterial RNA polymerase." Nature 448(7150): 163-168.
Vassylyev, D.G., Vassylyeva, M.N., Perederina, A., Tahirov, T.H. and Artsimovitch, I. (2007). "Structural basis for transcription elongation by bacterial RNA polymerase." Nature 448(7150): 157.
Vassylyev, D.G., Sekine, S., Laptenko, O., Lee, J., Vassylyeva, M.N., Borukhov, S. and Yokoyama, S. (2002). "Crystal structure of a bacterial RNA polymerase holoenzyme at 2.6Å resolution." Nature 417(6890): 712-9.
Wang, D., Bushnell, D.A., Westover, K.D., Kaplan, C.D. and Kornberg, R.D. (2006). "Structural basis of transcription: Role of the trigger loop in substrate specificity and catalysis." Cell 127(5): 941-954.
Westover, K.D., Bushnell, D.A. and Kornberg, R.D. (2004). “Structural basis of transcription: separation of RNA from DNA by RNA polymerase II.” Science 303(5660): 1014-1016.
Westover, K.D., Bushnell, D.A. and Kornberg, R.D. (2004). “Structural basis of transcription: nucleotide selection by rotation in the RNA polymerase II active center.” Cell 119(4): 481-489.
Yin, H., Artsimovitch, I., Landick, R. and Gelles, J. (1999). "Nonequilibrium mechanism of transcription termination from observations of single RNA polymerase molecules." Proc.Natl.Acad.Sci.U.S.A 96(23): 13124-13129.
Zhang, C., Zobeck, K.L. and Burton, Z.F. (2005). “Human RNA polymerase II
elongation in slow motion: role of the TFIIF RAP74 alpha1 helix in nucleoside triphosphate-driven translocation.” Mol.Cell.Biol. 25(9): 3583-3595.
CHAPTER 2: ACTIVE DISPLACEMENT OF NTPS DURING TRANSCRIPTION ELONGATION: A STRUCTURAL MODEL FOR MISINCORPORATION AND
RESCUE
Introduction
Transcription, the processive DNA-directed synthesis of RNA, is catalyzed by RNA polymerase (RNAP) and is the first step in a chain of events that leads to gene expression in the cell. RNAP must catalyze the incorporation of an NMP into the growing RNA chain at reasonable rates and with high fidelity (low occurrence of incorrect NTP addition) to maintain the requirements of the cell. RNAP has been shown to exist in different states or conformations. These varying conformations are thought to play a role in the regulation of transcription, and hence the regulation of gene expression. Specifically, in both prokaryotes and eukaryotes, there is evidence that the enzyme can exist in an activated state of
fidelity of the transcription reaction (Mooney et al. 1998).
The reported error rate for transcription in both prokaryotes and eukaryotes is 1 to 10
errors per 105 synthesized nucleotides (Libby & Gallant, 1991; Shaw et al. 2002). This rate
is significantly higher than the genomic mutation rate of 1 in 109 errors reported for DNA
polymerases (Echols & Goodman 1991; Kunkel & Bebenek 2000). Increased error during
transcription can lead to deterioration of translation products, which can ultimately lead to functional instability and cell death (Taddei et al. 1997). As such, it is important to understand the machinery used in transcription to better understand the fidelity of RNAP.
Despite its importance to the survival of the cell, the fidelity (ratio of correct incorporation to incorrect incorporation) of RNAP has not been well characterized (Alic et al. 2007). Here,
we focus on the NTP concentration-dependent kinetics of misincorporation in an effort to better understand the fidelity of E. coli RNAP.
Addition of an incorrect nucleotide into the growing RNA chain during transcription
is known as misincorporation. Erie et al. (1993) used in vitro misincorporation experiments to determine the initial branched mechanism of transcription elongation (Figure 2.1). This mechanism suggests that synthesis involves an activated (n*) and unactivated (n) enzyme
complex. The transition from the unactivated to the activated state is characterized by conformational changes in the RNAP. The activated state (n*) is long-lived with synthesis
occurring rapidly following NTP binding. Complexes can also decay off of the activated pathway and be trapped in the productive unactivated state (n). A fraction of these non-productive complexes can undergo further conformational changes into a dead-end state
concentrations of NTPs (Erie et al. 1993). Similar results have been seen with eukaryotic RNA polymerase II during misincorporation (Thomas et al. 1998).
Figure 2.1: Original kinetic mechanism deduced from misincorporation experiments carried out by Erie et al. The n indicates the transcript position with the unactivated and
activated state designated by n and n* respectively. The subscript “DE” represents
complexes in the dead-end state of synthesis. The mechanism demonstrates the
Further characterization of the kinetic mechanism using correct incorporation studies suggests that the transition from the unactivated to the activated state is achieved by
nucleotide binding to a separate allosteric site on the RNA polymerase. Foster et al. (2001)
performed experiments where a downstream templated, non-incorporatable NTP analog was added to the transcription reaction in the presence of the correct NTP for the n+1 (+26,
pDE13) and n+ 2 (+27, pDE13) template positions. An increase in the rate of synthesis at the downstream position was observed in the presence of the non-incorporatable analog. This result suggested that there is an allosteric binding site on the enzyme. In the absence of an
allosteric site, an inhibition of downstream NTP addition would have been observed in the presence of the analog (Foster et al. 2001). Synthesizing together kinetic data obtained for
correct single nucleotide addition and the presence of an allosteric site, two kinetically indistinguishable non-essential activation mechanisms for correct incorporation are proposed (Holmes & Erie 2003).
Mechanism one (Figure 2.2A) assumes that the pre- and post-translocated states of the enzyme are in rapid equilibrium. In this model, an NTP binding first to the allosteric site causes a conformational change such that the enzyme enters the activated state of
transcription [(n-1)*:NTPA]. After activation, the NTP to be incorporated enters the catalytic
site [(n-1)*:NTPA:NTP] and pyrophosphate is released (n*:NTPA:PPi) as synthesis occurs.
However, if an NTP binds first to the catalytic site [(n-1):NTP], the enzyme remains in the unactivated state where catalysis can also occur (n:PPi) but at a slower rate (Holmes & Erie 2003).
The second proposed mechanism (Figure 2.2B) is similar to the first proposed
mechanism with the exception of one key difference: the pre- and post-translocated states are
no longer assumed to be in rapid equilibrium. The system exists with the equilibrium favoring the pre-translocated state [(n-1)] until binding of an NTP to the allosteric site
facilitates translocation [(n-1):NTPA]. The NTP in the allosteric site can transfer into the
catalytic site [(n-1):NTPC], in which case the enzyme enters the same unactivated state of
synthesis shown in Figure 2.2A. Alternatively, with an NTP bound to the putative allosteric
site, a second NTP can bind to the catalytic site [(n-1):NTPA:NTPC] allowing for rapid
Figure 2.2: The proposed mechanisms of nucleotide addition during transcription elongation. (A) Mechanism one assuming that the pre- and post-translocated states of the
enzyme are in rapid equilibrium. (B) A second kinetically indistinguishable mechanism in
which the system exists pre-dominantly in the pre-translocated state of synthesis. The grey box represents the pre-translocated state (B). The green and blue boxes are the RNAP in the
unactivated and activated states respectively. The magenta box represents the allosteric site, while the red box indicates the catalytic site. The product-terminus binding site is shown in
the peach box. The red and pink lines indicate the growing RNA chain. NTPC represents
substrate bound to the catalytic site while NTPA represents substrate bound to the allosteric
After examining the crystal structures of RNAPs from T. thermophilus, T. aquaticus and S. cerevisiae, Holmes and Erie (2003) proposed a location for the allosteric site (Figure 2.3). This site has many of the characteristics of a NTP binding site. Specifically, the region contains the flexible fork loop 2 (βD-loop I) that is surrounded by a β-sheet on one side and
α-helices on the other. In both prokaryotes and eukaryotes, this loop is glycine-rich, a
characteristic of “P-loops” which are responsible for binding NTPs (Walker et al. 1982; Kull et al. 1998; Via et al. 2000; Leipe et al. 2002). Furthermore, a totally conserved Walker B
motif, an amino acid sequence that indirectly interacts with the γ-phosphate of NTPs through
chelation of a Mg2+ ion, is located at the rear of the loop (Walker et al. 1982; Via et al.
2000). Taken together with the current non-essential activation mechanism (Figure 2.2),
Holmes and Erie (2003) proposed a ratchet model for translocation (Figure 2.3). The model suggests that an NTP binds to fork loop 2, allosterically changing the conformation of the loop. This change in conformation of fork loop 2 begins a concerted movement which shifts
the area of the protein directly contacting the DNA-RNA hybrid, moving the DNA-RNA hybrid via a ratchet motion, and thereby facilitating translocation (Holmes & Erie 2003).
Figure 2.3: Model of the proposed RNAP allosteric site and the ratchet motion facilitating
translocation (Holmes & Erie 2003). DNA template strand is shown in yellow with the
nascent RNA chain shown in red. The F-helix is cyan, while fork loop 2 (βD loop I, the
proposed allosteric binding site) is shown in orange. The flanking β-sheet and α-helices are
shown in light green and pink, respectively. The rifampicin binding regions directly
interacting with the DNA-RNA hybrid are purple and blue. A modeled in UTP molecule is shown bound to the allosteric site (green, space filled) and at 5-6Å distance from the DNA,
To further support the presence of an allosteric site at fork loop 2, Kennedy studied the effect of pre-incubation and simultaneous addition of the downstream NTP (n+2) on correct incorporation for wild type RNAP as well as a ∆-loop RNAP where residues
R542-F545 in the fork loop 2 region of the enzyme were removed. In wild type RNAP,
simultaneous addition of n+2 (ATP) with n+1 (CTP) had little effect on the incorporation of n+1; however, pre-incubation of n+2 followed by addition of n+1 increased the rate in which
n+1 incorporated into the RNA. Significantly, in both simultaneous and pre-incubation experiments there was a dramatic increase in the rate of n+2 being incorporated when n+2 was present in the wild type enzyme experiments. In fact, the rate of n+2 incorporation was
limited only by the rate at which n+1 incorporated even at 10 fold higher concentrations than n+2. The enhanced rate of incorporation at n+2 suggests that there is, in fact, a second NTP
binding site in RNAP that is acting allosterically (Kennedy & Erie, manuscript in
preparation). The data for wild type RNAP exhibited biphasic kinetics, consisting of a slow phase and a fast phase of synthesis as seen previously (Foster et al. 2001; Holmes & Erie
2003).
Pre-incubation and simultaneous addition of n+2 with n+1 in the ∆-loop RNAP had
little effect on the rate of n+1 incorporation compared to wild type. However, the rate of
n+2 in the presence of n+2 for both pre-incubation and simultaneous addition was dramatically decreased in the ∆-loop mutant. This result is in stark contrast to the results
seen for wild type RNAP where the rate of n+2 was enhanced by the presence of n+2,
suggesting that fork loop 2 is in fact acting as the second NTP binding site in RNAP. Also in contrast to wild type RNAP, during simultaneous addition of n+2 with n+1 in the ∆-loop
RNAP only a single slow phase of synthesis was observed. This phase was relatively
unaffected compared to wild type enzyme but the previously observed fast phase of synthesis was completely eliminated. This result suggests that there is a fast phase of synthesis that is utilizing the fork loop 2 (a.k.a., the allosteric site) while there is also a slow phase of
synthesis that is independent of fork loop 2 (Kennedy & Erie, manuscript in preparation). These data, taken together with recent crystal structures where another important
structural element known as the trigger loop was shown to interact with fork loop 2 and an NTP in the catalytic site, led to the model of nucleotide incorporation shown in Figure 2.4 (Toulokhonov et al. 2007; Vassylyev et al. 2007; Kennedy & Erie, manuscript in
preparation). This model expands upon the model previously proposed by Holmes and Erie (2003) shown in Figure 2.2B. RNAP is shown first in the pre-translocated state (n). The
previously added nucleotide is locked into the catalytic site by the trigger loop, shown to close down over the catalytic site for synthesis during transcription and preventing NTP entry into the catalytic site via the secondary channel (Toulokhonov et al. 2007; Vassylyev et al.
2007). An allosteric NTP binds to fork loop 2 via the main channel (1), and this binding of an NTP to the allosteric site weakens the trigger loop’s affinity for the catalytic site. The trigger loop adapts an open conformation which opens access to the catalytic site (2). In the
open conformation, the trigger loop interacts with the allosteric NTP and the NTP acts as a latch to hold the trigger loop in the open conformation. Following translocation, a second
NTP can then enter into the catalytic site through the secondary channel (3a). When the NTP binds to the catalytic site, the trigger loop loses its affinity for the allosteric NTP and the trigger loop is again able to close down on the catalytic NTP for synthesis (4). A second
mechanism to transfer the allosteric NTP into the catalytic site. The allosteric NTP becomes the catalytic NTP and the trigger loop is able to close down over the catalytic site for
chemistry (3b, 4) (Kennedy & Erie, manuscript in preparation).
Figure 2.4: Model for NTP addition. The DNA template strand is shown in blue with the
non-template strand shown in pink. The RNA chain is red. The allosteric NTP is orange. Fork loop 2 is black, the bridge helix (F-helix) is yellow, and the trigger loop is shown in
green (Kennedy & Erie, manuscript in preparation). This model structurally expands upon the model previously proposed by Holmes & Erie (2003).
In this study, we focus on determining the rate of misincorporation and compare these data to the available data on correct incorporation to gain a greater understanding of the fidelity of E. coli RNAP. We have studied the NTP concentration-dependent kinetics of
misincorporation for wild type E. coli RNAP and determined that misincorporation can be described by a non-essential activation mechanism where synthesis can only occur in the
activated state while a subset of complexes are “trapped” in the unactivated state. Furthermore, NTP concentration-dependent kinetic studies of misincorporation were
performed utilizing the ∆-loop RNAP. The results indicate that this mutant is a high fidelity
mutant with a decreased rate and extent of misincorporation. We also reveal an active
displacement of the incorrect NTP in the presence of the correct nucleotide in both wild type and ∆-loop RNAP and propose a structural model for misincorporation similar to the model
proposed by Kennedy & Erie (manuscript in preparation).
Results
All experiments were performed using the pDE13 DNA template where the first CMP to be incorporated in the RNA chain is at position +25 (Erie et al. 1993). This template is biotinylated at the 5’ end and attached to streptavidin-coated magnetic beads. Elongation
complexes were formed by adding E. coli RNAP, DNA, UTP, ATP, and [α-32P] GTP and
stalled at position +24 by omitting CTP. The complexes were then placed next to a magnet and purified by washing with buffer (See Methods.) We then monitored the
misincorporation of UMP for CMP at position +25 as a function of time. Because
Concentration-Dependence of UMP Incorporation Using Wild Type RNAP
Figure 2.5A and 2.5B shows gels of misincorporation of UMP for CMP at position +25 in the nascent RNA chain as a function of time represented at a low (5µM) and high
concentration (600µM) of UTP, respectively. Inspection of these images reveals an increase
in the rate (appearance of complexes at position +25) and an increase in the extent (total percent of complexes at position +25) of misincorporation with increasing concentration of UTP. Specifically, there is a burst of misincorporation and then no further misincorporation
is observed. Notably, at lower UTP concentrations, less than 100% of the complexes
misincorporate UTP in place of CTP even after 40 minutes (Figure 2.5A). A subset of these
complexes is still competent for correct incorporation (chased complexes – complexes added to the presence of all four NTPs) and the remaining complexes have entered an inactive dead-end state (Figure 2.5A, chases).
Unlike DNAP, which will misincorporate most bases to 100% given sufficient time (Wong et al. 1991), only a subset of the RNA complexes misincorporate UMP at lower
concentrations. The fact that we do not see 100% misincorporation with RNAP at all concentrations of UTP indicates that a subset of complexes are decaying from productive synthesis into a non-productive synthesis path in an NTP concentration dependent manner.
This observation is consistent with the original misincorporation experiments where misincorporation was thought to occur only along an activated path with complexes falling off pathway into a non-productive unactivated state (Erie et al. 1993).
Figure 2.5: Representative denaturing gels showing UMP misincorporation at position
+25 at (A) 5
µ
M UTP and (B) 600µ
M UTP added to purified complexes stalled at position+24 in the nascent RNA chain. The rate of misincorporation at position +25 increases with
an increase in UTP concentration. Also, the percent of complexes misincorporated at
position +25 increases with increasing UTP concentration. Time = 0 (prior to NTP addition), 0.12, 0.24, 0.35, 0.47, 0.59, 0.7, 0.82, 0.94, 1.05, 1.17, 1.5, 2, 2.5, 3, 5, 10, 20, and 40
minutes. Chase reactions = 0, 4, 14, 24, and 39 minutes.
To quantitatively analyze these data, the percent of total complexes 25 nucleotides and longer were quantified and plotted as a function of time. Figure 2.6 shows kinetic data for misincorporation of UMP for CMP at eight different UTP concentrations. Inspection of
the data in Figure 2.6 reveals quantitatively that both the rates and extents of
misincorporation increase with increasing UTP concentration. To determine the
pseudo-first-order-rate constant (kapp) and the maximum extents of misincorporation (plateau values)
the data for all UTP concentrations were fit to single exponentials [y=Aexp(-kappt)+C]
(Figure 2.6).
To examine the concentration dependence of the rate of UMP misincorporation, the apparent rate constants obtained from the single exponential fits were plotted versus UTP
concentration (Figure 2.7). Given our current model for NTP addition, we would expect to
see a sigmoidal plot of kapp versus [UTP]. A sigmoidal substrate saturation curve would
indicate a quadratic dependence of the rate of UMP incorporation on UTP concentration and
suggest that there are two NTP binding sites serving the purpose of misincorporation in RNAP (Segel 1975; Schulz 1994). However, the rate of misincorporation versus UTP concentration increases approximately linearly with UTP concentration (Figure 2.7). This
linear result is similar to that seen with DNAPs and indicates NTP binding sites have not reached saturation at 600µM UTP (Wong et al. 1991). This lack of saturation has also been
observed for RNA polymerase III for concentrations up to 600µM (Alic et al. 2007).
To further examine the misincorporation reaction, the maximum extents of
misincorporation (total percent complexes at position +25) were plotted versus UTP concentration (Figure 2.8). The plot of percent extent versus [UTP] shows the increase in
extent of misincorporation versus UTP concentration fits well to Michaelis-Menten kinetics
and a Km of 6µM was obtained. Typically for Michaelis-Menten kinetics, the plot of initial
velocity (ν) versus substrate concentration ([S]) is used to determine the kinetic variables
where Km represents the concentration of substrate at which the enzyme reaches
half-maximum velocity (½Vmax) (Segel 1975; Schulz 1994). However, Figure 2.8 demonstrates
an extent of misincorporation that is dependent on substrate concentration and binding, and
therefore Km is similar to the constant of half saturation of an NTP binding site on the RNAP.
Figure 2.6: Plots of percent misincorporated complexes at position +25 versus time at (A) 5
– 50
µ
M UTP and (B) 50-600µ
M UTP. These data are fit to single exponentials to obtain theapparent rate constant (kapp) and maximum extent of misincorporation (plateau value) for
each concentration of UTP. Error bars represent the standard deviation for three to five sets
of data for each concentration of UTP.
Figure 2.7: Plot of rate (kapp, min-1) versus [UTP] (
µ
M). The rate of misincorporationincreases approximately linearly with increasing UTP concentration, indicating that RNAP has not reached substrate saturation at 600µM UTP. Error bars represent standard deviation
Figure 2.8: Plot ofmaximumextent of misincorporation (%) versus [UTP] (
µ
M). Datawere fit to Michaelis-Menten kinetics (extent misincorporation =
] [
] [ * max
UTP K
UTP V
m+
) with a Km
value of 6µM.
Chase Reactions from Wild Type RNAP
At designated times during the in vitro misincorporation reactions, a sample of the purified elongation complexes was added to the presence of all four NTPs (1mM) to extend
the transcript to full length and ensure that the complexes were still active (Chase Reaction, See Methods). As previously noted, misincorporation does not go to 100% completion at lower concentrations of UTP (<75µM) suggesting that a subset of the complexes are falling
off pathway into a non-productive synthesis state. The chase reactions show that a significant portion of the complexes that do not misincorporate U for C at +25 are still competent for synthesis and are not dead-end (inactive) complexes (represented in Figure
2.5A and 2.5B, final five lanes). These data suggest that, in the presence of the correct NTP, the previously non-productively bound incorrect nucleotide could be displaced so that the
complexes could incorporate the correct nucleotide and continue on to a complete (100%) reaction. The complexes that do not chase are dead-end complexes and remain inactive regardless of the concentration of all four NTPs present.
To further investigate the observation of non-productively bound nucleotide being displaced in the presence of all four NTPs, we posited that the presence of the correct NTP
alone would be sufficient to displace the non-productively bound nucleotide and allow for continued synthesis of the RNA chain. To test this hypothesis, the misincorporation reaction with purified elongation complexes was performed with the addition of 20µM UTP. The
misincorporation reaction was carried out for 10 minutes before CTP was added to the
To determine the exact time scale of the addition of the correct NTP following misincorporation, similar chase experiments were performed using rapid quench kinetic techniques (See Methods). These rapid quench chase reactions show that CTP displaces the
previously non-productively bound NTP, and incorporates CMP on the same time scale as correct single nucleotide addition with no prior misincorporation (0.1-0.2 seconds: Foster et
al. 2001; Holmes & Erie 2003; Kennedy & Erie, manuscript in preparation). This rapid
incorporation demonstrates that these non-productive complexes are not dead-end and that the complexes are not in a backtracked state. In a backtracked state, the RNAP has
translocated backwards along the DNA while extruding the 3’ end of the RNA such that regulatory proteins can act on the misincorporated base (Reeder & Hawley 1996,
Komissarova & Kashlev 1997; Nudler et al. 1997; Zhang et al. 1999; Artsimovitch & Landick 2000; Toulme et al. 2000). It has been shown that recovery from the backtracked state is slow; therefore, if the complexes were in a backtracked state, the addition of the
correct nucleotide would cause the complexes to progress slowly out of this state. We also investigated the possibility that the incorrect base added after misincorporation could chase the complexes out of the non-productive state. The
misincorporation reaction with purified elongation complexes was performed with the
addition of 20µM UTP. The misincorporation reaction was carried out for 10 minutes before
complexes were washed again to remove any unreacted UTP. We attempted to restart the misincorporation reaction by adding 20µM UTP back to these complexes (See Methods.)
The addition of low concentrations of UTP after the misincorporation reaction yielded no change in the extent of complexes at position +25 over the course of 10 minutes and
Figure 2.9: Plot of thedisappearance of complexes out of position +24 following the
addition of CTP after 10 minutes of misincorporation. The chase reaction of CTP into
position +25 occurs within the first seven seconds of CTP addition following the misincorporation reaction.
Concentration-Dependence of UMP Incorporation using ∆-loop RNAP
Pre-incubation and simultaneous addition experiments performed by Kennedy with wild type RNAP and ∆-loop RNAP, where four residues (R542-F545) of fork loop 2 were
deleted, support the existence of a second NTP binding site in RNAP and demonstrate that
fork loop 2 is likely to be the area of the protein where the second NTP is binding to act allosterically during transcription elongation (manuscript in preparation). To better understand the role of the allosteric site in misincorporation, we continued our misincorporation studies using the ∆-loop RNAP.
Initially, we performed running start experiments with ∆-loop RNAP where
misincorporation was initiated from the promoter with 15µM UTP in the presence of 20µM
ATP and 20µM GTP (See Methods). Inspection of the gels in Figure 2.10 reveals that the
∆-loop mutant (Figure 2.10B) exhibits a decreased rate (appearance of complexes at position
+25) and decreased extent (total percent of complexes at position +25) of misincorporation compared to that of wild type (Figure 2.10A). Kennedy and Erie demonstrated that correct incorporation of CTP at position +25 with ∆-loop mutant is only modestly affected by the
deletion of the four residues in fork loop 2 (manuscript in preparation). The decreased rate and extent of misincorporation observed in the ∆-loop RNAP, therefore, suggest that the


![Figure 2.7: Plot of rate (k app , min -1 ) versus [UTP] ( µ M). The rate of misincorporation increases approximately linearly with increasing UTP concentration, indicating that RNAP has not reached substrate saturation at 600µM UTP](https://thumb-us.123doks.com/thumbv2/123dok_us/8232919.2182449/61.918.157.780.114.625/misincorporation-increases-approximately-increasing-concentration-indicating-substrate-saturation.webp)
![Figure 2.8: Plot of maximum extent of misincorporation (%) versus [UTP] ( µ M). Data](https://thumb-us.123doks.com/thumbv2/123dok_us/8232919.2182449/62.918.178.766.111.602/figure-plot-maximum-extent-misincorporation-versus-utp-data.webp)
