Effect of Macromolecular Crowding on the Structure and Function
of a Riboswitch Aptamer in Cells and in Vitro
Jillian Tyrrell
A dissertation submitted to the faculty of the University of North Carolina at Chapel Hill in the partial fulfillment of the requirements for the degree of Doctor of
Philosophy in the Department of Chemistry.
Chapel Hill 2013
Approved by:
Gary J. Pielak, Ph.D.
Kevin M. Weeks, Ph.D.
Christopher J. Fecko, Ph.D.
Linda L. Spremulli, Ph.D.
i Abstract
JILLIAN TYRRELL: Effect of Macromolecular Crowding on the Structure and Function of a Riboswitch Aptamer in Cells and in Vitro
(Under the direction of Gary J. Pielak, Ph.D.)
There are large differences between the cellular environment and the
conditions widely used to study RNA structure and function in vitro, but until recently
no technologies allowed nucleotide-resolution analyses of RNA structure inside
cells. We have now examined the structure, dynamics, and ligand-binding function of
the adenine riboswitch aptamer domain in healthy, growing Escherichia coli cells at
single-nucleotide resolution using SHAPE. We compared the in-cell RNA structure
with that obtained in aqueous buffer containing 1 mM Mg2+, approximately the
concentration that we directly measured inside cells. The fully folded ligand-bound
aptamer formed essentially the same structure in cells as in buffer. In contrast, the
unbound RNA aptamer in cells was much more highly structured than the ligand-free
state in vitro. Even high in vitro concentrations of Mg2+ did not yield the degree of structural organization observed for the free aptamer in cells. The crowded cellular
environment thus stabilizes, or pre-organizes, otherwise dynamic RNA
conformations significantly more than does Mg2+ alone, demonstrating a profound
ii
To deduce how the structural effects observed in cells may be induced in vitro
and how the aptamer ligand binding affinity is affected by crowding, studies in the
presence of total cellular RNA, and the synthetic polymer, polyethylene glycol
(PEG), were employed. These studies showed that RNA-RNA interactions and PEG
had varying effects on aptamer structure. The structure of the aptamer in the
presence of both cellular RNA and large PEGs agreed better with the structure
observed in cells. However, specific characteristics observed for the aptamer in cells
were not observed in vitro under either condition. Crowding the aptamer with PEG
had little effect on ligand binding affinity, even when large structural effects were
observed. These results suggest that the complex cellular environment is difficult to
mimic in vitro,and to do so, may require a combination of crowding agents having
different chemical properties. Finally, the observed minimal effects on ligand binding
affinity for the aptamer in the presence of PEG, suggests that while RNA structure is
iii
“Go then, there are other worlds than these.”
iv
Acknowledgements
Special thanks to Gary J. Pielak for being an outstanding mentor and advisor.
Gary has always been available and supportive, and I am grateful to have been part
of his lab through this process. Thanks to my fellow Pielak group members for their
support and friendship.
Many thanks to Kevin M. Weeks, our collaborator on this project, who has
always been very helpful and a great mentor to me as well. Also, I would like to
thank Kevin and the Weeks lab members for allowing me to be a pseudo Weeks lab
member, and including me in their group meetings and other lab functions.
It has been a long road pursuing my goals and I would like to thank my son,
Bradly, and my husband, Josh, for their love and support. My son has grown up
watching me work very hard for my achievements. He was 5 years old when I
started on my undergraduate degree, and now he is 16, a wonderful young man,
and ready to begin his own journey soon. I hope he has learned the value of
education, but more importantly, that if he works hard, he can achieve anything he
v
Table of Contents
List of Figures ... ix
List of Abbreviations and Symbols ... xi
Chapter 1: Introduction ... 1
1.1 Significance of macromolecular crowding ... 1
1.2 Riboswitches exemplify the relationship between RNA structure and function... 2
1.2.1 add A riboswitch ... 3
1.3 SHAPE Chemistry ... 3
1.4 Overview: effects of crowding on RNA structure and function ... 5
1.4.1 Effects of the cellular environment on add A aptamer structure ... 6
1.4.2 Effects of crowding on add A aptamer ligand binding in vitro ... 7
1.5 Future Directions ... 7
1.6 Figures ... 9
Chapter 2: Pre-Organization of RNA Structure in Living Cells ... 12
2.1 Introduction ... 12
2.2 Results ... 14
2.2.1 Intracellular Mg2+ concentration ... 14
2.2.2 In-cell structure of the adenine aptamer domain in E. coli ... 15
2.2.3 The ligand-free aptamer is more highly organized in cells than in buffered solution ... 17
vi
2.2.5 Pre-organization of the free aptamer in cells is not due
To binding by pre-existing ligand ... 19
2.2.6 High Mg2+ concentration does not induce the pre-organization observed in cells ... 20
2.3 Discussion ... 21
2.4 Materials and methods ... 23
2.4.1 Concentration of Mg2+ in E. coli ... 23
2.4.2 Vector construction ... 25
2.4.3 RNA expression ... 25
2.4.4 In-cell SHAPE ... 26
2.4.5 In vitro SHAPE ... 27
2.4.6 SHAPE data analysis ... 28
2.4.7 Calculations for ΔR values shown in Figure 2.12 ... 28
2.5 Figures ... 30
Chapter 3: Effects of crowding on the structure and ligand binding affinity in vitro ... 46
3.1 Introduction ... 46
3.2 Results ... 49
3.2.1 Structural effects of RNA-RNA interactions on the ligand- free aptamer ... 49
3.2.2 Structural effects of PEG ... 50
3.2.2.1 Effect of PEG on the ligand-free aptamer ... 50
3.2.2.2 Effect of PEG on the ligand-bound aptamer ... 52
vii
3.2.3.1 Affinity for 2AP in buffer with 1 mM Mg2+
(KDapp, dilute) ... 53
3.2.3.2 Size-dependent effects of PEG on aptamer binding affinity ... 53
3.3 Discussion ... 54
3.4 Materials and methods ... 56
3.4.1 Large-scale preparation of the add A aptamer ... 56
3.4.2 In vitro SHAPE with synthetic crowding agents or total cellular RNA ... 56
3.4.3 Measuring KD using 2AP fluorescence ... 57
3.5 Figures ... 59
Chapter 4: Pitfalls and future directions ... 65
4.1 Determining KD in cells using SHAPE ... 65
4.1.1 Measuring 2-aminopurine concentration in cells ... 66
4.1.1.1 Mass spectrometry to measure 2-aminopurine concentration in cells ... 67
4.1.2. Controlling aptamer expression for in-cell KD measurements ... 67
4.1.2.1 Quantifying and optimizing low-level (≤ 10-9 M) aptamer expression ... 68
4.2 Production of 19F RNA for in vitro and in-cell NMR ... 69
4.2.1 19F-labeled aptamer construct cannot be detected by in-cell NMR ... 70
viii
4.3 Time-resolved SHAPE to measure crowding effects on RNA folding ... 72
ix
List of Figures
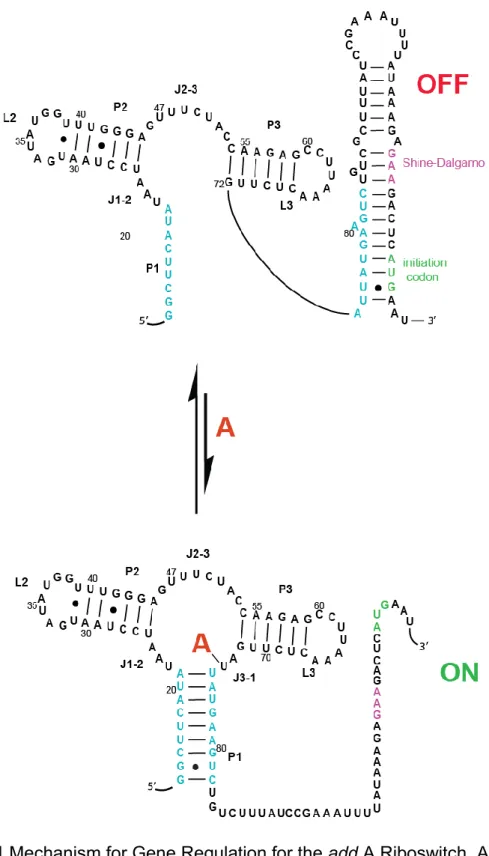
Figure 1.1 Mechanism for gene regulation for the add A riboswitch ... 9
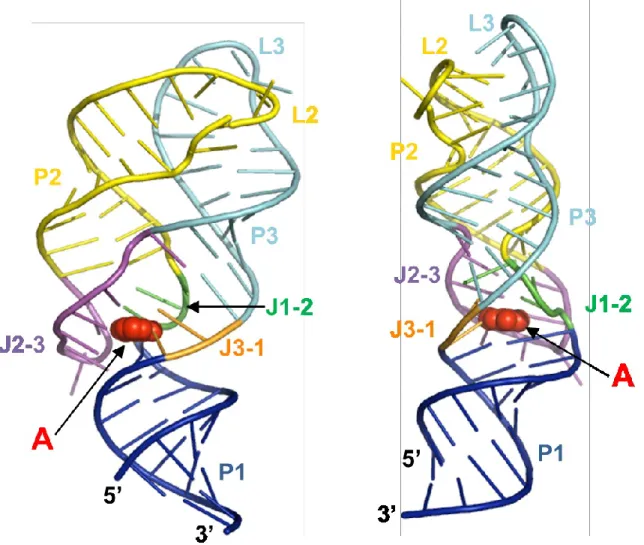
Figure 1.2 Cartoon representations of the add A riboswitch aptamer-adenine complex (PDB Y126) ... 10
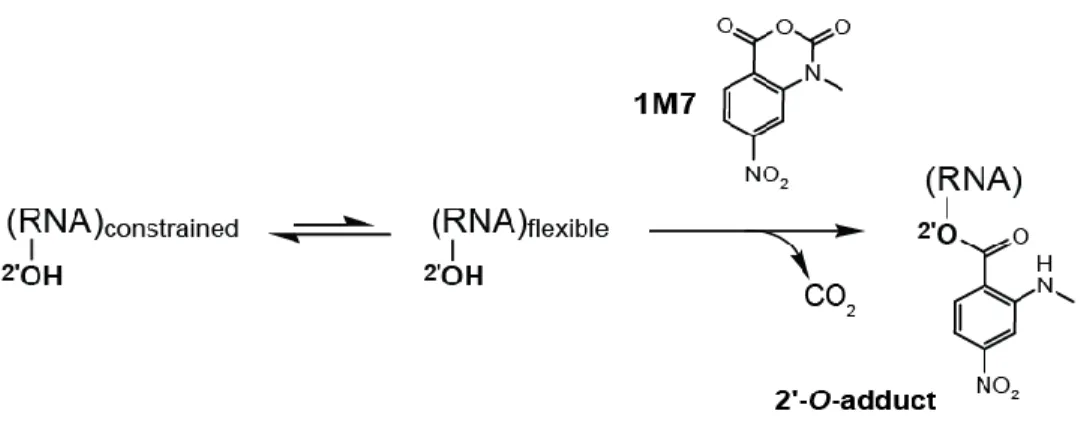
Figure 1.3 SHAPE mechanism ... 11
Figure 2.1 Adenine aptamer domain expressed in E. coli ... 30
Figure 2.2 Free Mg2+ concentration in E. coli cells ... 31
Figure 2.3 Pseudo-first order hydrolysis of 1M7 in LB ... 32
Figure 2.4 Electropherograms from SHAPE analysis of the adenine aptamer in buffer with 1 mM Mg2+ and in cells ... 33
Figure 2.5 SHAPE reactivity profiles of the adenine aptamer domain in cells and in buffer at a near-physiological Mg2+ (1 mM) concentration .. 34
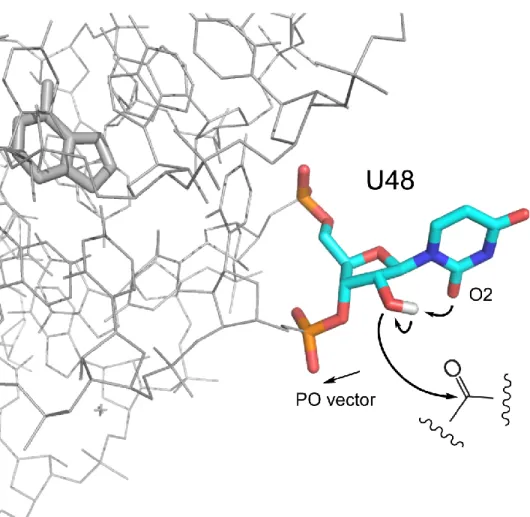
Figure 2.6 Mechanism of SHAPE hyper-reactivity at nucleotide U48 ... 35
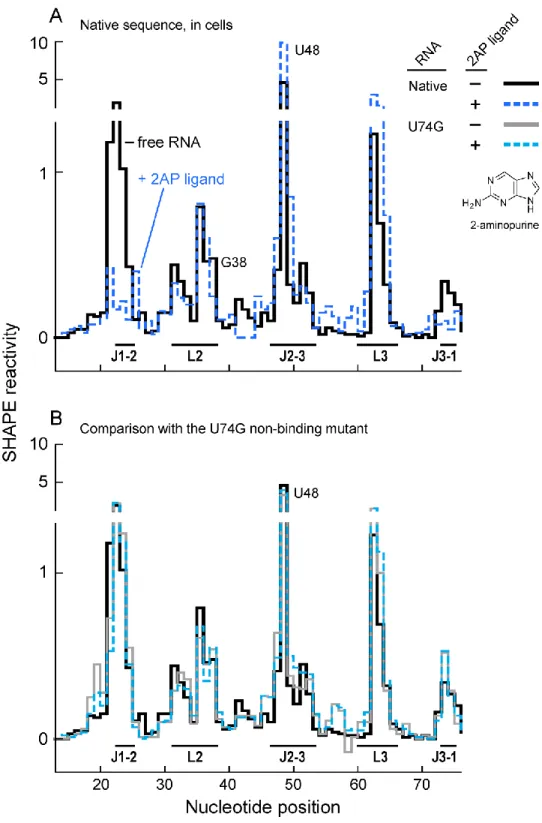
Figure 2.7 In-cell SHAPE reactivity and ligand binding by the native sequence adenine aptamer and the non-binding U74G mutant ... 36
Figure 2.8 In vitro, the aptamer undergoes a substantial conformational change upon adding the 2AP ligand ... 37
Figure 2.9 In cells the aptamer binds 2,6-diaminopurine (DAP) but not N6,N6-dimethyl-adenine (DMA) ligands ... 38
Figure 2.10 U74G mutant does not bind ligand in vitro ... 39
Figure 2.11 Correlation between in-cell and in vitro SHAPE reactivities for the ligand-free aptamer domain RNA as a function of Mg2+ concentration ... 40
x
Figure 2.13 Free intracellular Mg2+ concentration in E. coli cells measured
ratiometrically using mag-fura 2 is <1 mM ... 42
Figure 2.14 Determination of the KD of the mag-fura 2- Mg2+ complex ... 43
Figure 2.15 Chimeric tRNA-aptamer domain vector design and expression ... 44
Figure 2.16 Effect of DMSO on E. coli growth rate ... 45
Figure 3.1 SHAPE profiles for the ligand-free aptamer with total cellular RNA ... 59
Figure 3.2 SHAPE reactivities for the free aptamer in cells, in buffer with 1 mM Mg2+, and in buffer with 1 mM Mg2+ and PEG 100 g/L superimposed on the aptamer secondary structure ... 60
Figure 3.3 Pearson correlation between the in-cell SHAPE profile and profiles obtained in vitro in the presence of PEG ... 61
Figure 3.4 SHAPE reactivities for the ligand-bound aptamer in cells, and in buffer with EG superimposed on the crystal structure for the adenine-bound aptamer ... 62
Figure 3.5 Determining KDapp, dilute ... 63
Figure 3.6 KDapp, crowd measured as a function of PEG size ... 64
Figure 4.1 Ligand binding can be detected in cells using SHAPE... 74
Figure 4.2 Aptamer construct cannot be detected in cells or in lysate using 19F NMR ... 75
xi
List of Abbreviations and Symbols
°C degree Celcius
µL microliter
µM micromolar
1M7 1-methyl-7-nitroisatoic anhydride
2AP 2-aminopurine
2PEF two-photon excitation fluorescence
3PEF three-photon excitation fluorescence
5-FAM 5-carboxyfluorescein
6-HEX 6 - carboxy - 2',4,4',5',7,7' - hexachlorofluorescein
A adenine
AM acetoxymethyl
BzCN benzoyl cyanide
cDNA single-stranded, complementary deoxyribonucleic acid, product
of reverse transcription
C cytosine
DAP diaminopurine
ddATP dideoxyadenosine triphosphate
dNTP deoxynucleotide triphosphate
DMAP dimethylaminopurine
DMSO dimethyl sulfoxide
DNA deoxyribonucleic acid
xii
FPLC fast performance liquid chromatography
g gram
x g times gravity
G guanine
h hour
HEPES N-2-hydroxyethylpiperazine-N’-ethanesulfonic acid
In vitro Latin for experiments performed in a test tube
In vivo Latin for experiments performed in living organisms
IPTG isopropyl β-D-1-thiogalactopyranoside
J1-2, J2-3, J3-1 junctions between helices in the adenine riboswitch aptamer
kDa kilodalton
KD equilibrium dissociation constant
L liter
L2, L3 loop regions 1 or 2 in the adenine riboswitch aptamer
LNA locked nucleic acid
LB Luria broth
lys lysine
M molar
mg milligram
Mg2+ magnesium ion
MgCl2 magnesium chloride
min minute
xiii
MPEF multi-photon excitation fluorescence
mRNA messenger RNA
NaCl sodium chloride
nm nanometers
nM nanomolar
NMR nuclear magnetic resonance spectroscopy
OD600 optical density at 600 nanometers
P(1-3) helix 1, 2, or 3 in the adenine riboswitch aptamer
PAGE polyacrylamide gel electrophoresis
PEG polyethylene glycol
PVP polyvinylpyrrolidone
R Pearson’s Correlation Coefficient
RNA ribonucleic acid
RT reverse transcription
s second
SDS sodium dodecyl sulfate
SHAPE Selective 2’-Hydroxyl Acylation analyzed by Primer Extension
tRNA transfer ribonucleic acid
U uracil
vol volume
Chapter 1: Introduction
1.1 Significance of Macromolecular Crowding
Many cellular RNA functions require formation of sophisticated secondary and
tertiary structures. Extensive work, largely performed under simplified conditions,
has shown that higher-order RNA structure is exquisitely sensitive to the surrounding
solution environment. Most in vitro explorations of RNA molecules are carried out in
dilute buffer with minimal components. However, the environment in cells, where
RNA molecules function, is extraordinarily complex and contains concentrations of
macromolecules upwards of 300 g/L.1 Crowding effects can arise from two
phenomena: hard-core repulsions and non-specific chemical interactions. Hard-core
repulsions arise from volume exclusion or charge repulsion and result in reduced
conformational space, which favors compaction.2,3 In contrast, non-specific chemical
interactions, such as attractive charge-charge interactions, can destabilize compact,
folded states. In cells, it is likely that both forces affect the structure and function of
RNA.
While the effects of crowding on proteins have been studied extensively,4,5 effects on RNA are only recently being investigated.6,7 It is plausible that
macromolecular crowding may have a substantial effect on RNA structure and
function. First, unlike most proteins, RNA carries a high negative charge resulting
2
by either repulsive or attractive charge-charge interactions. Additionally, many
functional RNA’s have highly dynamic regions that sample multiple conformations;8 hard-core repulsions will favor the more compact members of this ensemble.
Since it is difficult to mimic the cellular environment, studies on the effects of
crowding on RNA have been limited to synthetic crowding agents, such as
polyethylene glycol (PEG), and trimethylamine oxide (TMAO).6,7,9,10 Most of these
studies focus only on global effects on RNA structure, such as the radius of gyration,
and there are few studies that give insight into crowding effects on function. To fully
understand RNA molecules and their structure and function relationships, functional
assays, and studies under physiological conditions at nucleotide resolution, are
required.
1.2 Riboswitches exemplify the relationship between RNA structure and function
Riboswitches are regulatory genetic elements located in the 5’-untranslated
region of several prokaryotic mRNAs.11 Typically, riboswitches comprise an aptamer
domain and an expression platform. The aptamer domain secondary structure is
highly conserved and undergoes a conformational change in response to specific
ligand binding. This conformational change results in gene expression control by
either formation or disruption of transcription terminators or hairpins that contain
transcription or translation initiation signals in the expression platform. Thus,
3 1.2.1 add A riboswitch
Purine riboswitches are highly conserved between organisms and have been
well characterized.12-14 The purine class includes riboswitches that recognize and bind guanine or adenine. Distinctly, discrimination between guanine and adenine for
each riboswitch depends on a single-nucleotide, located in the binding pocket of the
aptamer domain. One member of the purine riboswitch class, the add adenine
riboswitch, acts as an ‘on’ switch for the expression of adenine deaminase.
Specifically, when cellular adenine concentrations reach a threshold, adenine
binding to the aptamer causes a conformational change that turns ‘on’ transcription
of the gene encoding adenine deaminase by exposing Shine-Delgarno sequence
(Figure 1.1).
The add A riboswitch aptamer binds adenine and analogs 2-aminopurine and
2, 6-diaminopurine with high affinity (KD~ 60 nM, 117 nM, and 2 nM,
respectively).13,15 The ligand-bound aptamer is a highly organized structure where long-range tertiary interactions between loops 2 and 3 (L2 and L3) are intact and the
ligand is completely encapsulated and involved in extensive tertiary interactions
within the binding pocket (Figure 1.2).12,13,16 In contrast, the ligand-free aptamer is dynamic, having a disordered binding pocket and only transient interactions between
L2 and L3.16
1.3 SHAPE Chemistry
Few methods allow exploration of intracellular RNA structure. The most
4
(DMS). Studies using DMS have yielded significant insights to the intracellular
structure of several RNAs.17,18 However, DMS reacts with only a few functional groups on RNA, primarily adenosine (N1) and, to a lesser extent, cytosine (N3). In
vivo DMS probing studies are therefore best coupled with information from other
techniques.18
An alternative chemical probing method, selective 2’-hydroxyl acylation
analyzed by primer extension (SHAPE) employs electrophilic reagents that react at
the 2’-hydroxyl group of conformationally flexible nucleotides to form 2'-O-adducts
(Figure 1.3) and yields quantitative information on the degree to which a nucleotide
is constrained by base pairing, or other interactions. SHAPE has been widely used
to develop secondary structure models and detect complex conformational changes
of RNA in vitro.19-23 Here, we explore the use of SHAPE to probe RNA structure in healthy, growing E. coli cells and compare our results directly with in vitro SHAPE
experiments
The 1-methyl-7-nitroisatoic anhydride (1M7) SHAPE reagent provides a
straightforward approach for probing RNA structure in living cells on a minute
timescale. The results presented here are not compatible with a recent report
suggesting that 1M7 does not perform well in cells and that slowly reacting reagents
are required for in-cell probing. 24 SHAPE reagents that react rapidly with RNA, as is the case with 1M7,12 versus the recently described reagents that react slowly,24 likely probe different features of RNA structure. In general, fast reacting reagents do a
better job of quantifying intrinsic RNA structure, while slow reagents are sensitive to
5
reactivity of slow reacting reagents appears to highly sensitive to the specific in vitro
ion concentrations, which will complicate understanding differences between in-cell
versus in vitro measurements. A fast reacting reagent is thus especially important
when examining the effects of the cellular environment on RNA structure.
In this method, I add 1M7 to Escherichia coli cells expressing the add A
aptamer or to purified aptamer, in vitro. We locate positions of 2’-hydroxyl
modifications by first using sequence-specific, fluorescent primers to reverse
transcribe the modified RNA. The enzyme used, reverse transcriptase, will stop at
modified nucleotides. Thus, the reverse transcription (RT) reaction yields a pool of
cDNA of different lengths corresponding to the location of modified nucleotides.
Each experiment includes an RT reaction with unmodified RNA to determine
background stops. Second, we apply capillary electrophoresis to quantify cDNA
products. The electropherograms are aligned with results from a dideoxynucleotide
sequencing reaction to determine peak positions. Peak intensities are integrated and
corrected for background and signal decay to yield a SHAPE profile.
My results show that 1M7 readily traverses the complex multi-layered cell wall
structure of E. coli to yield nucleotide-resolution structural and ligand-binding
information for the add A riboswitch aptamer domain.
1.4 Overview: effects of crowding on RNA structure and function
In this dissertation, I focus on determining the consequences of
macromolecular crowding in cells and in vitro on the structure of the add A
6
ligand-free and ligand-bound aptamer structure in healthy, growing E. coli. I apply
aptamer ligand binding assays and SHAPE in vitro in the presence of synthetic
crowding agents in Chapter 3, to help tease apart the consequences of hard-core
repulsions and non-specific interactions on RNA structure and function. The results
give insight into the consequences of the crowded cellular environment on RNA
structure and function.
1.4.1 Effects of the cellular environment on add A aptamer structure
RNA forms complex secondary and tertiary structures that are essential for
cellular function. I set out to determine if the crowded cellular environment had an
effect on the structure of the free and ligand-bound aptamer. The ligand-bound
aptamer structure, observed crystallographically, is compact and highly organized13
and therefore not expected to be perturbed by macromolecular crowding forces. In
contrast, the free aptamer in the presence of physiologically relevant Mg2+
concentration has a disordered binding pocket, and is lacking stable loop-loop
interactions.16,26 If hard-core repulsions dominate in cells, a more ordered, and compact state will be observed for the aptamer in cells compared to in buffer.
Alternatively, if non-specific attractive interactions dominate, I will observe a
structure more disordered than that observed in buffer with physiological Mg2+.
My results for the ligand-bound aptamer were as expected: the cellular
environment had little effect on the structure. In contrast, SHAPE profiles for the free
aptamer show that the cellular environment indeed has a significant effect on the
adenine aptamer structure. The impact of the cellular environment on individual
7
hard-core repulsions play a role in the structural effects. However, the overall
structure is more compact and organized in cells. Thus, hard-core repulsions are the
dominant force responsible for the differences in aptamer structure in cells
compared to in buffer. These results underscore the importance of examining the
consequences of the complex cellular environment on RNA structure and function in
cells.
1.4.2 Effects of crowding on add A aptamer ligand binding in vitro
Riboswitches harness structural changes induced by ligand binding to control
genes. Crowding effects on structure would alter the equilibrium between the free
and bound states, thereby affecting the equilibrium binding constant (KD). Currently,
there are no methods to measure KD directly in cells. For these studies, I employed
synthetic polymers to measure the consequences of crowding on KD for the add A
riboswitch aptamer:2AP complex.
These studies show that while crowding has very little effect on KD for the
aptamer:2AP complex, crowding agents of different size, geometry, and chemical
composition have varying effects. Understanding the nature of the interactions
between crowder and aptamer shed light on how hard-core repulsions and attractive
chemical interactions may affect the thermodynamics for RNA ligand binding and
suggest that the in-cell KD may not agree with that measured in vitro.
1.5 Future Directions
The goal of this work is to understand the structure and behavior of RNA in its
8
conformation of the add A riboswitch aptamer in cells differs from that observed in
vitro. A significant contribution to understanding RNA biophysics would be to
establish conditions in vitro that can induce the conformation observed in cells. Such
knowledge would not only further our understanding of the specific contributions the
cytoplasm has on RNA structure, but also allow RNA to be studied under
‘physiological like’ conditions in vitro. This ability would permit studies of much larger
RNA’s that cannot effectively be studied in cells.
Additionally, this work provides insight into how hard-core repulsions and
chemical interactions affect the ligand-binding thermodynamics of the add A
riboswitch aptamer. With this knowledge, we could deduce how RNA ligand binding
thermodynamics is affected in cells. Finally, the ultimate goal would be to develop a
9 1.6 Figures
10
11
Chapter 2- Pre-Organization of RNA Structure in Living Cells
The material in this chapter is from:
Tyrrell J, McGinnis JL, Weeks KM, Pielak GJ, Effects of the Cellular Environment on Adenine Riboswitch RNA Structure, 2013.
(J.T., J.L.M., K.M.W, and G.J.P. designed research; J.T. and J.L.M performed research; J.T., J.L.M., K.M.W, and G.J.P. analyzed data; J.T., K.M.W, and G.J.P. wrote the paper.)
2.1 Introduction
The cellular environment is vastly different from that employed in most in vitro
explorations of biological macromolecules. In bacterial cells, macromolecules reach
concentrations of 300 g/L and occupy up to 30% of the total volume.1 This crowding leads to two types of interactions between macromolecules: hard-core repulsions
and chemical interactions. Hard-core repulsions reflect the impenetrable nature of
atoms and reduce conformational space, ultimately favoring more compact states.2,3 Chemical interactions can be attractive or repulsive. Repulsions arise from
interactions between like charges, reinforcing the hard-core effect. Attractive
interactions, including hydrogen-bonding and juxtaposition of complementary
charged species, are expected to destabilize the folded state because they are
favored by exposing the local structures that mediate these interactions.27 Biological molecules are likely impacted by both phenomena in cells; however, the extent of
13
environment is difficult to mimic in vitro. Studies of biological molecules in realistic
cellular environments are essential for fully understanding the impact of complex
cellular contributions to macromolecular structure and function.28
RNA molecules are responsible for diverse cellular functions, many governed
by precise features of their three-dimensional structure. In vitro studies show that
crowding induced by synthetic polymers has dramatic consequences for RNA
folding.6,7,10 In addition, the negatively charged backbone of RNA makes folding exquisitely sensitive to cation concentrations.29 Despite these considerations, most
in vitro explorations of RNA structure and function employ purified RNAs and simple
buffered solutions at Mg2+ concentrationsthat are significantly higher than occur physiologically.
To probe the effect of the cellular environment on RNA structure, we
expressed a riboswitch aptamer domain in E. coli cells using a tRNA scaffold.30,31
We compared the reactivity of virtually all nucleotides in the aptamer using SHAPE
chemistry in healthy, growing cells and in buffer. SHAPE yields quantitative
information on the degree to which a nucleotide is constrained by base pairing or
other interactions and has been widely used to develop secondary structure models
and detect complex conformational changes in RNA in vitro.19,20,32,33 Application of
SHAPE to living cells promises to significantly improve our ability to understand how
the cellular environment affects RNA structure at the level of individual nucleotides.
Riboswitch RNAs regulate gene expression by undergoing ligand-induced
conformational changes that ultimately enhance or inhibit expression of a linked
14
ligand, the aptamer domain has a disordered binding pocket; upon ligand binding,
stable tertiary interactions form (Figure 2.1A).12,16,34 Using a fast-acting SHAPE reagent,35 we found that the ligand-free aptamer has a more compact and more highly ordered structure in the cellular environment than does the purified RNA in
buffer at physiological Mg2+ concentrations. Moreover, the conformation that predominates in cells could not be achieved in vitro, even in buffers containing 30
times the concentration of Mg2+ directly measured in cells. Our results indicate that macromolecular crowding stabilizes, or pre-organizes, tertiary interactions and
emphasize the importance of studying RNA structure in cells.
2.2 Results
2.2.1 Intracellular Mg2+ concentration.
RNA tertiary structure is highly dependent on the Mg2+ concentration.26,29 To
ensure accurate comparison of the effect of this ion on RNA structure, we measured
the free Mg2+ concentration in E. coli cells using a ratiometric Mg2+-selective fluorophore.36 Cells were grown to late-log phase and intracellular Mg2+
concentration was measured as a function of external Mg2+ concentration in physiological buffer [10 mM HEPES-KOH (pH 7.4), 200 mM potassium acetate, 5
mM NaCl]. At an external concentration corresponding to that in standard LB
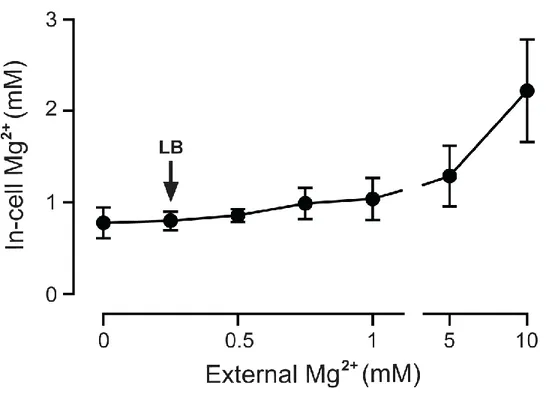
medium [0.3 mM, calculated from the Mg2+ content of tryptone and yeast extract37] the intracellular Mg2+ concentration was 0.8 ± 0.2 mM (Fig. 2.2, arrow). The
15
above 1 mM until the extracellular concentration was 5 mM (1.3 ± 0.3 mM) and
reached 2.2 ± 0.5 mM at an external concentration of 10 mM. The in-cell Mg2+ concentration measured here for E. coli (0.8 ± 0.2 mM) is consistent with
measurements obtained for other cell types.38-41
2.2.2 In-cell structure of the adenine aptamer domain in E. coli.
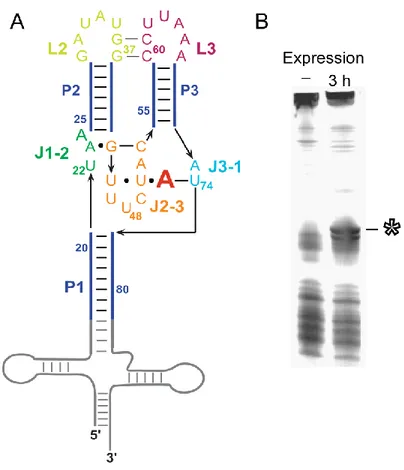
To study the aptamer domain in E. coli cells, we expressed the RNA as a
chimera in which the aptamer domain was inserted into the anticodon loop of tRNAlys (Figures 2.1A). These chimeric RNAs fold stably in cells, are processed like normal
tRNAs, and yield an intact and monodisperse product.30,31 The RNA containing the aptamer was processed into a product of approximately 143 nucleotides, indicating
that the tRNA domain folds correctly in cells (Figure 2.1B).
In-cell SHAPE probing was achieved by adding 1-methyl-7-nitroisatoic
anhydride (1M7) in dimethyl sulfoxide (DMSO) to late log-phase cells, under
conditions that are fully compatible with normal cell growth and viability.
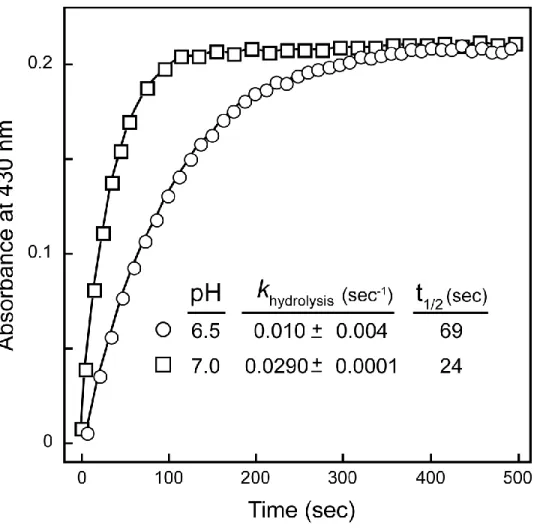
Measurements of 1M7 hydrolysis in LB at 37 °C and pH 7.0, corresponding to
culture media at late log phase, showed that 1M7 has a half-life of 0.2 min (Figure
2.3); thus, SHAPE probing yields a profile of cellular RNA structures over an
approximately 2-min interval. We have consistently found that 1M7 is straightforward
to use in vivo, including in bacterial cells. Our experience is not compatible with a
recent report suggesting that 1M7 performs poorly in cells and that slowly reacting
SHAPE reagents are required for in cell probing.24 In general, prior work indicates
that slowly reacting reagents are likely to be poor choices for in vivo studies.
16
different structural features in RNA. In general, fast reacting reagents provide
quantitative measurements of intrinsic RNA structure, whereas slow reagents are
sensitive to slow dynamic features of an RNA.25,42,43 A critical consequence of this difference is that slow reacting reagents are highly sensitive to in vitro ion
concentrations,35 whereas fast reacting reagents are not. Thus, the use of a fast reacting reagent makes possible direct comparison of in-cell and in vitro
measurements without need for corrections based on ion sensitivity.
After modification, total cellular RNA was isolated, and sites of aptamer
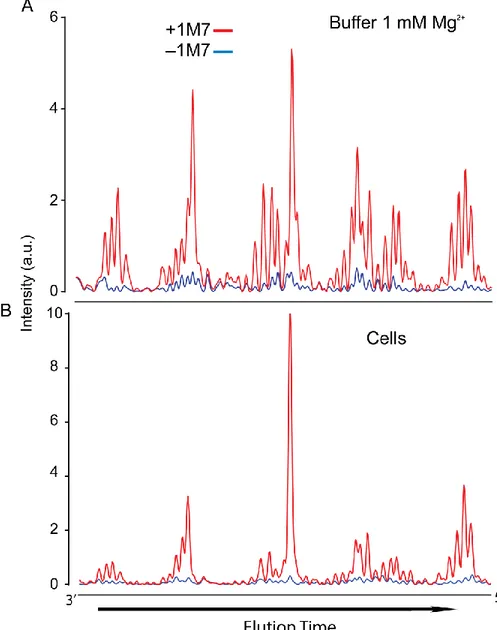
modification were determined after primer extension by capillary electrophoresis.32 SHAPE probing with 1M7 yielded electropherograms comparable or better in quality
to those obtained from in vitro experiments (Figure 2.4). Little or no degradation of
the adenine riboswitch RNA was observed in the cells or in RNA treated in vitro with
DMSO. Thus, signals were due to reactivity of the RNA with 1M7, and the 1M7
reagent readily diffuses across the double walled membrane of the Gram-negative
E. coli bacterium.
We first evaluated the SHAPE reactivity profile in cells with no added ligand.
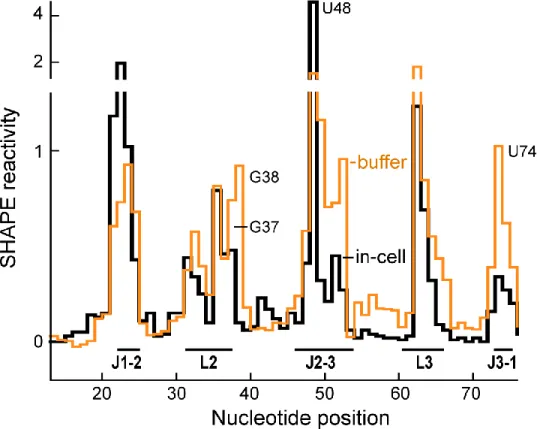
In-cell In the SHAPE reactivity profile of the free aptamer (Figure 2.5, black trace),
nucleotides expected to form helices P1, P2, and P3 (Figure 2.1A) had low reactivity,
consistent with stable base pairing. Most nucleotides that form the ligand binding
pocket (J1-2, J2-3, J3-1) were moderately (≥0.4) or highly (>0.8) reactive as were
nucleotides in the loop regions L2 and L3. Nucleotide U48 was hyper-reactive. The
17
helices are formed and that the ligand-binding pocket is relatively flexible and
partially disordered.
2.2.3 Ligand-free aptamer is more highly organized in cells than in buffer.
We observed large differences when we compared the in-cell riboswitch
unliganded aptamer structure to that in buffered solution at 1 mM Mg2+in vitro
(Figure 2.5, compare orange and black). Most nucleotides in the adenine binding
pocket (regions J2-3 and J3-1) were less reactive in cells than in vitro, consistent
with formation of stacking and base pairing interactions in these regions in the cell
and the lack of these interactions in buffer. Interestingly, the J1-2 region was more
reactive in cells than in buffered solution. This higher reactivity may arise from
increased solvent accessibility due to tertiary collapse and ordering of J2-3 and J3-1
and/or to attractive chemical interactions with other cellular components. Finally,
nucleotide U48 was hyper-reactive in cells but showed only high reactivity in buffer.
In the ligand-bound RNA in the crystal structure, U48 is flipped into the solvent 13 and is constrained in one of the (relatively rare) conformations that activates the
ribose 2'-hydroxyl group for SHAPE chemistry (Figure 2.6).44 Nucleotides G37 and
G38 in L2 were also significantly more reactive in vitro than in cells, suggesting that
tertiary interactions involving loops L2 and L313,26 are largely absent in buffered
solution but are at least partially formed in cells. Overall, these data show that the
aptamer is more structured and has a more highly organized binding pocket in cells
18 2.2.4 Ligand binding to RNA in cells.
The add A riboswitch recognizes 2-aminopurine (2AP) and adenine with
similar affinities [Kd ~ 117 nM and 60 nM, respectively,15,45,46], and both ligands
induce large conformational changes in the riboswitch RNA.12,15,46 2AP, however, is
not found in detectable quantities in E. coli, and the expression level of our RNA
construct is ~100 times (see Methods and materials) the intracellular concentration
of adenine (~10-6 µM).47 Thus, using 2AP, it is possible to examine the in-cell consequences of ligand binding without interference by endogenous cellular
metabolites.
When 2AP was added to growth medium, we observed a substantial change
in SHAPE reactivities (Figure 2.7A). The changes were consistent with
ligand-mediated conformational changes in the RNA and formation of the intricate network
of base-pairing (Figure 2.1A) and stacking interactions observed by crystallography13
and NMR.16 Specifically, reactivities of nucleotides in the binding pocket decreased significantly (Figure 2.7A, regions J1-2 and J3-1). The J1-2 region, which is highly
reactive in the free state, became almost completely unreactive. The reactivity of
U48 increased two fold, consistent with the ligand-bound RNA crystallographic
structure in which this position is constrained in a conformation that facilitates
SHAPE reactivity (Figure 2.6).13,44 Reactivity decreased at G38 in L2, which pairs with C61 in L3. Reactivity also increased at U62 and U63, consistent with the crystal
structure, which shows that these nucleotides are unpaired and likely dynamic in the
19
With the exception of nucleotides in the J2-3 region, which were more
reactive in cells, the SHAPE profiles of ligand-bound RNA in cells and in buffer are
very similar (compare Figure 2.7A and 2.8). Thus, the ligand-bound structure is not
as strongly affected by the cellular environment as the ligand-free aptamer. Two
additional ligand controls were performed to assess the specificity of the
conformational changes induced by 2AP. The nucleotide 2,6-diaminopurine binds
the aptamer with high affinity (KD 2 nM)15 and, as expected, induced large changes
in the in-cell aptamer SHAPE reactivity profile, comparable to those induced by 2AP
(Figure 2.9). N6, N6-Dimethyl-adenine does not bind the aptamer (KD > 300 μM)12
and the in-cell SHAPE profile obtained from cells grown in the presence of this
molecule was similar to that of the free aptamer (Figure 2.9). These results
emphasize that conformational changes induced by 2AP reflect specific binding in
the ligand binding pocket of the riboswitch.
2.2.5 Pre-organization of the free aptamer in cells is not due to binding by
pre-existing ligand.
To confirm that differences observed between in-cell and in vitro SHAPE
reactivity profiles of the free aptamer were not due to endogenous adenine binding,
we investigated a non-binding mutant. Nucleotide U74 forms a canonical base pair
with the adenine ligand and is critical for ligand affinity and specificity.12,46 Therefore,
the U74G mutation should disrupt binding to adenine, 2AP, and related molecules.
The SHAPE profiles of the U74G mutant in buffer at 1 mM Mg2+ both in the absence
and presence of 2AP were essentially identical (Figure 2.10). Thus, the ligand-free
20
In-cell analysis of the U74G mutant in the absence and presence of added
2AP in the cell media also yielded nearly identical SHAPE profiles (Figure 2.7B),
indicating that the mutant does not bind ligand in cells. Critically, the in-cell pattern
and magnitude of SHAPE reactivities for the binding pocket and loop regions were
also nearly identical to those of the native sequence RNA. Thus, the non-binding
mutant possesses the same partially organized state in cells observed for the native
sequence in the absence of ligand. Therefore, the structure of the unliganded
native-sequence aptamer in cells does not arise from endogenous adenine ligand binding,
but instead indicates a definitive role of the cellular environment in pre-organizing
the RNA.
2.2.6 High Mg2+ concentrations do not induce the pre-organization observed in cells.
In vitro experiments performed at Mg2+ concentrations comparable to those
measured in E. coli (Figure 2.2) indicated that the adenine riboswitch aptamer
domain was notably less structured than in cells than in vitro. We therefore
attempted to induce the highly ordered in-cell conformation by increasing the Mg2+ concentration in vitro. We probed the aptamer structure as a function of Mg2+
concentration and calculated the Pearson correlation coefficient (R) between in-cell
and in vitro SHAPE reactivities (Figure 2.11). The correlation between the in-cell
reactivities and those measured in buffer at 1 mM Mg2+ was low (0.55, inset in
Figure 2.11), consistent with large differences in RNA structure under these two
conditions. Increasing the Mg2+ concentration to 2 mM, increased the correlation to
0.69, and increasing the ion concentration to 30 mM yielded a correlation of 0.78
21
stabilized by the cellular environment, and this contribution cannot be recapitulated
in simple buffers by increasing the concentration of Mg2+.
2.3 Discussion
The adenine riboswitch allows bacterial cells to control gene expression in the
adenine biosynthesis pathway in response to purine levels in the environment. Like
the functions of many non-coding RNAs, riboswitch function is mediated by its
higher-order structure. The crowded and unique ion environment in cells is likely to
have a large impact on RNA structure-function relationships, but these effects
remain poorly understood. Using in-cell SHAPE, performed in 2-min structural
snapshots (Figure 2.3), we found that the cellular environment induces a collapsed
conformation in the unbound adenine riboswitch aptamer RNA that is different from
the ligand-bound structure and from the structure in vitro, even when the buffer
included high Mg2+ concentrations.
We visualized the overall effects of the cellular environment on the level of
structural organization of the RNA aptamer using a scale based on differences in
SHAPE reactivities. Values between zero and one provide a metric of structural
organization in individual RNA motifs relative to the fully folded and highly organized,
ligand-bound state. SHAPE reactivities for nucleotides involved in the long-range
loop-loop interaction and for the three motifs that comprise the ligand-binding pocket
are diagnostic of the overall structure (Figure 2.12, right). Binding by the
2-aminopurine ligand induced a highly structured RNA state both in buffer and in cells
as indicated by structural organization values near 1 for both the tertiary and
22
in cells than in vitro; whereas, tertiary interactions in L2 and in binding pocket
regions J1-2 and J3-1 were slightly more constrained in cells. The in-cell
ligand-bound structure thus appears to be slightly more stable than that formed in vitro.
In cells, the ligand-free aptamer was much more highly structured than was
the free RNA in buffered solution in vitro (Figure 2.12, compare open stars and open
rectangles). In cells, with the exception of nucleotides in J1-2, the free RNA was
almost as structured as the 2AP-bound state (structural organization values were
0.8). When the Mg2+ concentration was increased to 10 mM for in vitro experiments
(Figure 2.12, open circles), long-range tertiary contacts involving the L2 loop were
stabilized, but the effect on the ligand binding pocket was small. The non-binding
U74G mutant (Figure 2.7B) had the same highly ordered structure as the ligand-free
native sequence aptamer, emphasizing that in-cell stability does not arise from
endogenous ligand binding. The cellular environment thus significantly stabilizes
tertiary interactions and the binding pocket in the ligand-free aptamer in a way that is
not replicated by high Mg2+ concentrations in vitro.
In summary, we have used SHAPE chemistry with the well-understood 1M7
reagent35,44,48 to study the structure of the adenine riboswitch aptamer RNA in living cells at single-nucleotide resolution. We found that the cellular environment
‘pre-organizes’ the riboswitch RNA for ligand binding. The high level of organization
specifically observed in the ligand-binding pocket (Figure 2.12) for the free aptamer
in cells suggests that the free energy difference between the free and
ligand-bound conformations is less inside the cell than in buffered solution. In principle,
23
attractive chemical interactions. Our observation that the aptamer RNA is highly
structured in cells suggests that hard-core and charge-charge repulsions dominate.
Many RNAs show low levels of function under physiological Mg2+ concentrations in vitro but are more functional at high ion concentrations. As we observe here,
however, the structure stabilized in vitro by high Mg2+ concentrations may not fully recapitulate the functional structure in cells.
2.4 Materials and Methods
2.4.1 Concentration of Mg2+ in E. coli.
Free Mg2+ was measured using the intracellular chelator, mag-fura-2,
acetoxymethyl (AM) (Figure 2.13). The free Mg2+ concentration is obtained from the
ratio of the fluorescence intensities of the free and complexed dyes at 510 nm
measured using excitation 380 nm and 340 nm, respectively. Methods were adapted
from those described.41
E. coli BL21(DE3) cells were grown in LB media at 37 °C, with shaking, until
the optical density at 600 nm (OD600) reached ~1. Aliquots (12 mL) were centrifuged
at room temperature for 15 min at 1500 × g, washed once, and resuspended in 1.5
mL Mg2+-free buffer [10 mM HEPES-KOH (pH 7.4), 200 mM potassium acetate, 5
mM NaCl]. Cells were incubated with shaking at 37 °C for 10 min, then 500 µl of dye
mixture containing 20 µM mag-fura-2 AM and 60 µM Pluronic F-127 (Molecular
Probes). Dyes were prepared in Mg2+-free buffer from mag-fura-2 AM (5 mM, in
anhydrous DMSO) and Pluronic F-127 [20% (w/v) in DMSO] stocks. After dye
24
washed, resuspended in 2 mL of Mg2+-free buffer, and incubated for 30 min to
ensure hydrolysis of the intracellular dye. Cells were then washed twice and
resuspended in Mg2+-free buffer to yield an OD600 ~0.5 (~2 × 10⁸ cells/mL). Cell
viability was determined by plating serial dilutions of cell suspensions on LB-agar
plates containing 1 mg/mL ampicillin.
The fluorescence of cell suspensions (2.4 mL in a stirred 3 mL cuvette) was
measured at 37 °C using a Varian Cary Eclipse fluorimeter. Excitation at 340 nm and
380 nm was alternated at 1 s intervals, and emission was measured 510 nm. To
quantify Mg2+-dependent changes in fluorescence, Mg2+ was added to cells at 100 s intervals (Figure 2.13A). The intensities and 340 nm/380 nm ratios were used to
calculate the internal Mg2+ concentration.36
[Mg2+] = KD (F0/FS) (RMg2+ – Rmin)/(Rmax – RMg2+) (1)
where KD is the dissociation constant of the mag-fura-2/Mg2+ complex (2.5 mM, see
below), F0/FS is the ratio of intensities with 380 nm excitation for 0 mM added Mg2+
and saturating Mg2+, RMg2+ is the ratio of 510 nm emission from excitation at 340 nm
and 380 nm at a given external Mg2+ concentration, and Rmin and Rmax are the
minimum and maximum ratios determined at 0 mM and saturating Mg2+,
respectively. Rmin and Rmax were obtained at the end of each experiment by adding
Mg2+ to a final concentration of 30 mM, then adding SDS [to 0.1% (w/v) final] to lyse
25
of 60 mM to chelate Mg2+ and achieve a free Mg2+ measurement.
The KD was determined by recording Mg2+-dependent fluorescence changes
for hydrolyzed mag-fura-2 (0.4 µM) in buffer and fitting the 510 nm intensities from
340 nm excitation to a one-site binding curve (Figure 2.14).
Emission from cells in Mg2+-free buffer was constant over time (Figure 2.13A). Intensities were corrected for autofluorescence, which was also constant and lower
than that of dye-loaded cells by a factor of 13 for excitation at 340 nm and a factor of
20 for excitation at 380 nm (Figure 2.13B, inset). Serial dilution and plating of cells
confirmed that ~90% of the dye-loaded cells were viable.
2.4.2 Vector construction.
The sequence encoding the adenine riboswitch aptamer domain was inserted
between the TΨC and D stem-loops of human tRNAlys3 as a synthetic gene in a pIDTSMART vector (IDT). The gene was inserted into pET21a(+) using Hind III (5')
and Xba I (3') cloning sites for expression under the control of a T7 promoter (Figure
2.15). The transcript is a chimeric tRNA in which the anti-codon stem is replaced by
the aptamer domain.30,31
2.4.3 RNA expression.
The aptamer-tRNA construct (Figure 2.1B) was expressed in BL21(DE3) E.
coli cells in LB medium at 37 °C. When the OD600 reached 0.6, RNA expression was
induced by addition of isopropyl β-D-1-thiogalactopyranoside (1 mM). Expression
was allowed to proceed for 30 min, at which time aliquots were removed and added
to 2-aminopurine, 2,6-diaminopurine, or 3-methyladenine dissolved in LB (final
26
cell aliquots were subjected to either in-cell or in vitro SHAPE.
To measure the concentration of aptamer construct in the cellular RNA,
aliquots of total RNA and serial dilutions of purified construct were analyzed by
denaturing urea polyacrylamide gel electrophoresis. Gels were stained with SYBR
Gold (Invitrogen) and a standard curve was constructed using the band intensities of
samples corresponding to the purified construct. The standard curve was used to
determine the concentration of the aptamer construct in the total RNA samples. The
aptamer construct (~7 g/L) was determined to represent ~7% of the total RNA
concentration (100 g/L determined using NanoDrop 1000 Spectrophotometer). To
estimate the concentration of construct in cells, we took 7% to the total RNA
concentration in E. coli (75-120 g/L49) to correspond to the aptamer construct. From
the molecular weight of the construct (43.4 kD), the concentration of construct in
cells is 120-190 µM.
2.4.4 In-cell SHAPE.
The aptamer construct was expressed in the presence or absence of ligand
as described above. Following RNA expression, cellular RNA was modified by
adding aliquots of cells (1 mL) to 20 μL of 300 mM 1M7 in DMSO or to neat DMSO
(2% vol/vol final co-solvent, conditions consistent with normal cell growth, Figure
2.16). The samples were incubated with shaking for 3 min at 37 °C. Total cellular
RNA was recovered from protoplasts and isolated as described.32 RNA was precipitated with ethanol, washed three times with 70% (vol/vol) aqueous ethanol,
and resuspended in 15 μL of deionized H2O.
sequence-27
specific primers, containing locked nucleic acid (LNA) nucleotides, and 5’ fluorescent
labels. Specifically, a 12-nt DNA primer (Exiqon) complementary to the 5' end of the
acceptor stem and containing three locked nucleic acid (LNA) nucleotides
(5'-TGGCGCCCGAAC-3', where the italic font indicates LNA nucleotides) was used.
The primer was labeled with either a 5' 6-FAM or 5-HEX fluorescent dye. The 6-FAM
labeled primer was used for the (+) or (–) 1M7 channels; the 5-HEX was used for the
sequencing channel. RNA (1.5 μg) and primer (2 pmol) were mixed and diluted to 13
μL with H2O. The sample was then incubated for 5 min at 65 °C and then on ice for 3
min. The reaction mixture contained 4 μL of 5 SuperScript first-strand buffer, 1 μL
0.1 M dithiothreitol, 1 μL dNTPs (10 mM each), and 1 U SuperScript III (Invitrogen).
cDNA products were resolved by capillary electrophoresis.
For sequence analysis, the reactions were prepared as described above,
except the RNA was not treated with 1M7 or DMSO, the RNA-primer mixture was
diluted to 12 μL, and 1 μL of 10 mM ddATP was added prior to adding SuperScript
III. Reactions were incubated at 55 °C for 60 min, and then at 70 °C for 15 min.
cDNA was recovered by ethanol precipitation and washed three times with 70% (v/v)
aqueous ethanol. Pellets were dried under vacuum and resuspended in 10 μL of
deionized formamide. The products were resolved by capillary electrophoresis on an
Applied Biosystems 3500 DNA capillary electrophoresis sequencer.
2.4.5 In vitro SHAPE.
Following expression, RNA was recovered from protoplasts and isolated as
28
was purified by anion exchange, fast performance liquid chromatography. Ligand (1
mM) was added after folding and incubation was continued for 10 min. The aptamer
construct (8 pmol) was then added to 1/50 volume 300 mM 1M7 in DMSO or to neat
DMSO. The samples were incubated at 37 °C for 3 min. RNA was precipitated with
ethanol, washed three times with 70% (vol/vol) aqueous ethanol, and resuspended
in 15 μL deionized H2O.32 Primer extension and capillary electrophoresis were used
to determine sites of adduct formation, as described for in-cell SHAPE.
2.4.6 SHAPE data analysis.
Electropherograms were analyzed with QuShape software (Figure 2.4).50 After baseline and mobility shift corrections, peaks in the (+) and (–) 1M7 channels
were aligned, and Gaussian integration was used to quantify peaks areas. The
SHAPE reactivity is reported as the area of the (+) 1M7 peaks minus the area of the
no-reagent background peaks. For correlation analyses (Figure 2.11), we monitored
the following single-stranded and terminal base paired nucleotides: A21-U25,
U31-U39, A45-C54, G59-C67, and G72-U75.
2.4.7 Calculations for ΔR values shown in Figure 2.12.
Values for long-range tertiary contacts and for nucleotides within the ligand
binding pocket represent the average difference in reactivity.
First, the absolute value of the differences ( R) were calculated using buffer
with 1 mM Mg2+ as the initial condition:
R0 = |Rbuffer+1mM Mg2+ – Rbuffer+1mM Mg2+|
Rcomplete change in buffer = |Rbuffer+2AP+1 mM Mg2+ – Rbuffer+1 mM Mg2+|
29
Rcells+2AP = |Rcells+2AP – Rbuffer+1 mM Mg2+|
Rbuffer+10 mM Mg2+ = |Rbuffer+10 mM Mg2+ – Rbuffer+1mM Mg2+|
R values were not calculated for binding pocket nucleotides A24, G46, and C53 or
for long-range contacts C60 and C61 because these nucleotides have low SHAPE
reactivities under all conditions, such that the R values were less than the standard
deviation from three trials of the free aptamer in buffer plus 1 mM Mg2+.
R values for each nucleotidewere then normalized to a scale where 0 is
defined as the value for the free aptamer in buffer at 1 mM Mg2+ and 1.0 represents
the 2AP-bound state in buffer at 1 mM Mg2+. The normalized values were then grouped by region and averaged. The average value for each region is a measure of
organization relative to the fully folded, ligand-bound state in buffer at 1 mM Mg2+.
Region J1-2 in the free aptamer in cells is unique because values of Rcells –
Rbuffer+1mM Mg2+ are opposite in sign to Rbuffer+2AP+1 mM Mg2+ – Rbuffer+1 mM Mg2+. This
situation arises because the reactivity of nucleotides in J1-2 increase in cells relative
to reactivities in buffer with 1 mM Mg2+(Figure 2.5), but decreases with ligand binding
(Figure 2.7A). Therefore, we multiplied these values by -1 to reflect that R is
30 2.5 Figures
Figure 2.1 Adenine aptamer domain expressed in E. coli using a tRNA scaffold. (A) Structure of the aptamer-tRNA construct. The adenine ligand is shown as a red “A”. Numbering corresponds to the add aptamer domain.13 (B) Denaturing
polyacrylamide gel electrophoresis of total cellular RNA 3 h after induction of
31
Figure 2.2 Free Mg2+ concentration in E. coli cells. Free Mg2+ was measured using
32
Figure 2.3 Pseudo-first order hydrolysis of 1M7 in LB at 37 °C at pH values of 6.5 and 7.0, which correspond to that of the culture media at the beginning and in the late-log phases of cell growth. Reagent hydrolysis was measured in a cuvette at 37
33
Figure 2.4 Electropherograms from SHAPE analysis of the adenine aptamer (A) in buffer with 1 mM Mg2+ and (B) in cells. Signal decay and baseline corrections were
34
35
Figure 2.6 Mechanism of SHAPE hyper-reactivity at nucleotide U48. The
conformation encompasses two features that facilitate SHAPE reactivity. First, the anionic 3'-phosphate diester is directed away from the reactive 2'-hydroxyl group (illustrated as the PO vector). Second, the 2-keto group of the uracil moiety is positioned to function as a general base and lower the pKa of the attacking 2'-OH
36
37
38
39
40
Figure 2.11 Correlation between in-cell and in vitro SHAPE reactivities for the
ligand-free aptamer domain RNA as a function of Mg2+ concentration. Data are from single-stranded and terminal base-paired nucleotides. Inset: In vitro SHAPE
41
Figure 2.12 The adenine aptamer is pre-organized in cells. Relative levels of
organization were calculated for nucleotides in each of four structural elements using a scale in which the reactivity of the nucleotide in the free aptamer is defined as 0.0 and that of the nucleotide in the 2AP ligand-bound aptamer in buffer at 1 mM Mg2+ is
42
Figure 2.13 Free intracellular Mg2+ concentration in E. coli cells measured
ratiometrically using mag-fura 2 is <1 mM. (A) Fluorescence intensities at 510 nm with excitation at 340 nm (red) and 380 nm (blue), corresponding to the bound and free dye, respectively, were measured as a function of added Mg2+. The ratios (black) are used in Eqn. 1 to obtain the concentration of free Mg2+ in cells.36 (B) Ratio of 510 nm emission intensities from 340 nm and 380 nm excitation for a
complete experiment. Initial portion of the ratio plot (black) is the Mg2+ titration shown in (A). Rmax was measured by adding SDS (0.1% m/v final concentration) and
additional Mg2+ (30 mM final concentration) to the cells. Rmin was measured by
adding excess EDTA to chelate the Mg2+. Rmin and Rmax were consistent across all
43
Figure 2.14 Determination of the KD of the mag-fura 2- Mg2+ complex. Normalized
44
45
Figure 2.16 Effect of DMSO on E. coli growth rate. DMSO concentrations below 4% (v/v) do not significantly perturb cell viability. A final DMSO concentration of 2% (v/v) was using for in-cell SHAPE in this work.DH5 cells (500 mL) were grown in LB to an OD600 of 0.3 starting from 5 mL of an overnight culture. Cell aliquots (10 mL)
were then added to 90 mL of LB containing 0–10% (v/v) DMSO. Samples were withdrawn at intervals, and the OD600 was measured to assess cell growth. The
resulting growth curves showed that E. coli cells are fully viable at DMSO
Chapter 3: Effects of crowding on structure and ligand binding affinity in vitro
3.1 Introduction
RNA molecules function in cells where the concentration of macromolecules
reaches up to 400 g/L, resulting in at least 40% of the cell volume being occupied.1
Most studies of RNA structure and function, however, are carried out in dilute buffer.
It has been shown that macromolecular crowding in vitro can have significant effects
on RNA structure.6,7,9,10 For many biological RNAs, structure is intimately linked to function, which suggests that crowding may affect many biological functions. To fully
understand structure and function relationships, it may be important to consider the
effects that the crowded intracellular environment may have on RNA.
In this dissertation, I have reported a nucleotide-level analysis of the add A
riboswitch aptamer domain in healthy, growing E. coli cells (Chapter 2). The add A
riboswitch aptamer is highly conserved and its function depends on a conformational
change upon specific recognition of adenine in cells, making it a good candidate for
RNA structure function studies (Figure 1.1).12,13 Ultimately, I have shown that the conformation of the free aptamer in cells is different than that observed in dilute
buffer with physiologically relevant Mg2+ concentration (Figure 2.2), and these effects are not due to endogenous ligand binding (Figures 2.7 and 2.11). On the
47
aptamer, which is highly organized and compact both in cells and in dilute buffer, in
agreement with NMR analysis16 and the x-ray crystal structure13 of the ligand-bound aptamer.
Crowding effects can arise from two phenomena: hard-core repulsions and
non-specific chemical interactions.2,3 Hard-core repulsions arise from excluded volume and reduce conformational space, therefore favoring compaction.
Non-specific chemical interactions include repulsive or attractive charge interactions.27,28 Repulsive interactions arise from interactions between like charges and reinforce the
hard-core effect, favoring compact states. Attractive interactions include
hydrogen-bonding, juxtaposed complementary charges, and hydrophobic contacts. Attractive
interactions that expose more interacting surface to the crowding molecules
destabilize folded, compact states.27
The observed conformation of the aptamer in cells was more compact than in
dilute buffer, indicated by the stabilization of L2 and L3 interactions.26 This observation suggests that, overall, the hard-core effect and/or repulsive charge
interactions may dominate in cells. However, region J1-2 was destabilized in cells,
suggesting that attractive chemical interactions may also play a role in effecting the
in-cell aptamer structure. Elucidating the specific effects of crowding in the cellular
environment may help to establish in vitro conditions to study RNA that are more
physiologically relevant than dilute buffer with high Mg2+.
In this chapter, I investigate the effects of non-specific RNA-RNA interactions
on the free aptamer structure in vitro using SHAPE. It was expected that crowding
48
charged backbone, and attractive interactions, arising from the potential for
inter-molecular base-paring. Observed structural effects on the free aptamer crowded by
high concentrations of cellular RNA, suggest that repulsions dominate. The SHAPE
profile for the aptamer in this mixture, however, indicates that the binding pocket is
not affected by RNA-RNA interactions in the same way as it is by the cellular
environment.
The effects of the commonly used synthetic crowding agent, polyethylene
glycol (PEG), on both the ligand-free and ligand bound aptamer, were also
investigated. Previous results show that favorable interactions between PEG and
DNA increase with decreasing PEG size,51 suggesting that crowding with PEG may present an opportunity to separate effects of non-specific attractive interactions and
hard-core repulsion on aptamer structure. Similar results were obtained with low
molecular weight PEGs (> 3350 Da) as observed with RNA-RNA interactions, in that
SHAPE profiles correlated with the in-cell profile better that obtained in dilute buffer,
but the reactivity of the ligand-binding pocket was unlike that observed in cells. For
small molecular weight PEGs, the results suggest that the aptamer structure is
strongly affected by favorable interactions, in agreement with observations involving
DNA.51 For ethylene glycol (EG), favorable interactions also affected the ligand
bound aptamer. However, no significant differences were observed for the
ligand-bound aptamer in the presence of PEG > 3350 Da. Binding studies for the aptamer
in the presence PEG were also performed. The results showed that the structural
effects observed for the aptamer in PEG had little effect on binding affinity, however
hard-49
core repulsions induce a structure more like the in-cell structure for the free aptamer,
the effects of the cellular environment are more complex than can be mimicked by a
simple crowded solution. Additionally, binding studies suggest that the binding affinity
is not strongly affected by structural changes induced by PEG.
3.2 Results
3.2.1 Effect of RNA-RNA interactions on ligand-free aptamer structure
To examine whether non-specific RNA-RNA interactions can explain the
differences between the purified aptamer in vitro (1 mM Mg2+) and the in-cell results
(Chapter 2) I probed the structure of the aptamer construct in the presence of total
cellular RNA (Figure 3.1). The SHAPE profile for the ligand-free aptamer in the
presence of total E. coli RNA (400 ng/µL) had high or moderate reactivity in the
single-stranded binding pocket regions, and low reactivity in helices, consistent with
previous observations in which the ligand-free aptamer has a disordered binding
pocket and fully intact helices.12,16,26,34 SHAPE profiles for the pure aptamer in the absence and presence of total RNA correlated with an R-value of 0.7 (Figure 3.1A).
Effects of total cellular RNA on aptamer SHAPE profiles were not significantly
different when the concentration was reduced to 100 ng/µL (R=0.7, data not shown).
For the aptamer with added cellular RNA, nucleotides in L3 and J2-3 exhibited small
decreases in reactivity, and G38 in L2, which is highly reactive for the pure aptamer,
was unreactive. These observations would suggest stabilization of tertiary structure,
particularly due to interactions between L2 and L3. However, G37, which pairs with
50
This is inconsistent with significant stabilization of the L2-L3 interaction. Taken
together, these observations suggest that while there is modest tertiary stabilization,
likely reflecting inter-RNA repulsion involving negatively-charged RNA backbones,
favorable intermolecular interactions may play a role.
The aptamer structure effected by RNA-RNA interactions in vitro is more
similar to that observed in cells for the aptamer (data from Chapter 2) compared to
the pure aptamer (R=0.8, Figure 3.1B). The increased correlation can be attributed
to better agreement with the in-cell profile in regions J2-3 and L3 compared to pure
aptamer. However, for the aptamer with added RNA, J3-1 is significantly higher in
reactivity and J2-1 is lower in reactivity compared to cells. Additionally, the aptamer
structure induced by RNA-RNA interactions has low reactivity for nucleotide G38 but
exhibits high reactivity for nucleotide G37, while the in-cell structure has low
reactivity for both, suggesting that L2-L3 interactions are significantly more stable in
cells. In conclusion, the conformation of the aptamer induced by RNA-RNA
interactions agrees better with that observed in cells compared to the purified
aptamer. However, this treatment fails to fully recapitulate the in-cell state.
3.2.2 Structural effects of PEG
3.2.2.1 Effect of PEG on the ligand-free aptamer
The effects of PEG on aptamer structure were examined using SHAPE. The
aptamer was probed in the presence of ethylene glycol (EG), PEG 3350, 12k, and
35k at 100 g/L. Compared to the ligand-free aptamer in dilute buffer, nucleotide
reactivities in the binding pocket are significantly reduced in the presence of EG