GASTROINTESTINAL, HEPATOBILIARY, AND PANCREATIC PATHOLOGY
Fas Regulates Macrophage Polarization and
Fibrogenic Phenotype in a Model of Chronic
Ethanol-Induced Hepatocellular Injury
Fuyumi Isayama,*Sherri Moore,yIan N. Hines,*yand Michael D. Wheeler*y
From the Center for Alcohol Studies,* University of North Carolina, Chapel Hill, North Carolina; and the Department of Nutrition Science,yCollege of Allied Health, East Carolina University, Greenville, North Carolina
Accepted for publication February 4, 2016.
Address correspondence to Michael D. Wheeler, Ph.D., Department of Nutrition Sci-ence, College of Allied Health, East Carolina University, AHS Bldg. 4165, Greenville, NC 27858. E-mail:wheelerm@ ecu.edu.
The role of Fas-mediated apoptosis and its effect on proinflammatory cytokine production in early alcoholic liver disease has not been addressed. Wild-type mice (C57Bl/6) or mice with a functional mutation in the Fas ligand (B6.gld) were given either high-fat control diet or ethanol diet by intragastric cannulation for 2 or 4 weeks. Liver injury, hepatic lipid accumulation, and proinflammatory cytokine production associated with chronic ethanol consumption were largely prevented in B6.gldmice compared with wild-type mice. Conversely, B6.gldmice given ethanol exhibited increases in collagen deposition, hepatic collagen gene expression, and profibrogenic cytokines (eg, transforming growth factor-band IL-13) and alterations in matrix remodeling proteins (eg, matrix metalloproteinases and tissue inhibitor of metalloproteinases) compared with wild-type mice. Hepatic F4/80þmacrophage populations were increased significantly in B6.gldmice compared with wild-type mice; hepatic CD3þcell populations were not significantly different. Importantly, a shift toward the expression of M2/Th2 cytokines (eg, IL-4 and IL-13) after ethanol exposure was observed in B6.gldmice compared with classical M1 cytokine expression in wild-type mice under similar conditions. In isolated macrophages, stimulation of Fas receptor minimally enhances lipopolysaccharide-induced M1 cytokine production and significantly limits M2 cytokine production. These data support the hypothesis that Fas-mediated signaling is important for an early ethanol-induced proinflammatory response but limits the profibrogenic response, regulating collagen production in response to chronic ethanol.(Am J Pathol 2016, 186: 1524e1536;http://dx.doi.org/10.1016/j.ajpath.2016.02.006)
Liver fibrosis is regarded as the turning point in the pathologic evolution of alcoholic liver disease that often leads to cirrhosis and hepatic carcinoma.1As such, a large number of studies have sought to delineate the mecha-nisms involved in the development of alcohol-induced hepatic fibrosis.2 With the use of a number of distinct models and data derived from clinical studies, the general mechanisms for the accumulation of collagen were determined. Central to this mechanism is the activation of hepatic stellate cells, expression of the contractile protein
a-smooth muscle actin (a-SMA), and production of excessive quantities of extracellular matrix proteins, pri-marily collagen.3,4 Importantly, mechanisms involved in the initial activation of these cells in alcoholic liver dis-ease is not clear. However, it is becoming clear that the hepatic immune response and the expression of certain
cytokines and chemokines is an integral component of the
fibrogenic response. The regulation of the cytokine milieu that is observed in early ethanol-induced liver pathogenesis is also a critical gap in our understanding.
An intriguing hypothesis put forward by Gores and colleagues5,6 is that hepatocellular damage, in particular apoptosis, is an inducer of thefibrotic response. Their work indicated the importance of hepatocellular apoptosis in the development of cholestasis-induced hepatic fibrosis. Broad-spectrum inhibition of caspase activity significantly ameliorates the cholestasis-induced stellate cell activation
Supported in part by the National Institute on Alcohol Abuse and Alcoholism grants AA14243 (F.I., I.N.H., and M.D.W.), AA13667 (M.D.W.), AA11605 (F.I., I.N.H., and M.D.W.), and AA019559 (S.M.M, I.N.H., M.D.W.).
Disclosures: None declared.
and collagen production.7Indeed, the data are convincing that hepatocellular damage and death initiates an orches-trated pathway of wound healing, including replacement of dying hepatocytes with extracellular matrix components.
The evidence for the role of cytokines in the fibrotic response is most compelling. Increasing evidence suggests that certain proinflammatory cytokines, namely, tumor necrosis factor (TNF)-a and transforming growth factor (TGF)-b, may play an early role in the activation of stellate cells. In other models of liver disease, the fibrotic process seems to be highly connected to the production of type 2 cytokines and to TGF-b, yet the role of type 2 cytokines in the regulation of extracellular matrix remodeling genes remains largely unknown. Investigations have focused on the role of these distinct classes of cytokines, specifically type 2 cytokines such as IL-4, IL-5, and IL-13, on regulating a chronic inflammatory response but also dictating a sus-tained wound-healing response in liver.8e12
Fas is a cell-surface receptor whose binding with Fas ligand (FasL) mediates apoptosis in various types of cells.13,14Mice with the naturally occurring mutation in the FasL (gld) have severe lymphoproliferation disease because of the inability of lymphocytes to undergo apoptosis.13Livers ofgldmutant mice have a modest increase in the numbers of both CD4 and CD8 lymphocytes but a significant increase in the number of F4/80þ macrophages.15,16Several studies suggest that Fas-FasL interactions regulate lymphocyte pop-ulations but also play a larger role in myeloid cell homeo-stasis and macrophage cytokine response.17
Here, the role of Fas-mediated apoptosis in ethanol-induced liver injury will be assessed with the use of gld
mutant (B6.gld) mice in a model of intragastric ethanol feeding. Described in this study is thefinding thatgldmutant mice are resistant to ethanol-induced hepatitis, yet they exhibit a cytokine response in liver that favors collagen production and tissue remodeling profile after chronic ethanol exposure. It is also shown that the fibrogenic response coincides with an apparent increase in type 2 cytokines, supporting the hypothesis that Fas-mediated apoptosis is important for ethanol-induced pathogenesis and maintenance and regulation of hepatic immune cells.
Materials and Methods
Animals
Male wild-type C57Bl6/J mice and mice with a naturally occurring mutation in the FasL (B6Smn.C3-Tnfsf6gld/J; 22 to 25 g; The Jackson Laboratory, Bar Harbor, ME) were fed the high-fat control diet or the diet that contained ethanol (approximately 24 g/kg per day) by intragastric cannulation as described by Tsukamoto et al18 and originally modified for mice as described by Yin et al.19 All mice were housed in pathogen-free barrier facilities accredited by the Association for Assessment and Accreditation of Laboratory Animal Care, and procedures used were approved by the local Institutional
Animal Care and Use Committee. Gastric cannulation in mice was performed with aseptic surgical techniques detailed else-where.20,21 After surgery, mice were placed in individual sterile metabolic cages, and the gastric cannulae were con-nected to an infusion pump. All mice had free access to water and cellulose pellets (Harlan, Madison, WI) as a source offiber during enteral feeding. Diets were initiated 1 week after surgery to allow for full recovery. A liquid diet described by Thompson and Reitz,22 supplemented with lipotropes as detailed by Morimoto et al,23was prepared daily. Mice were randomly divided into two experimental groups and fed either the high-fat control or the ethanol-containing diet continuously for 4 weeks. Diet was infused at a rate of 0.4 mL/g per day with an infusion pump (Harvard Apparatus, Natic, MA). The de-gree of alcohol intoxication was assessed regularly to evaluate development of tolerance so that ethanol delivery could be increased. The amount of ethanol in the diet was increased over the course of the study from 5% to 8% to obtain optimal delivery of calories without compromising growth or survival. Ethanol concentration in urine, which is representative of blood alcohol concentrations, was measured daily. Mice were housed in metabolic cages that separated urine from feces, and urine was collected over 24 hours in bottles that contained mineral oil to prevent evaporation. Each day at 9 AM, urine collection bottles were changed, and a sample was stored at
20C for later analysis. Ethanol concentration was deter-mined by measuring absorbance at 366 nm, resulting from the reduction of NADþ to NADH by alcohol dehydrogenase. Averages from individual mice over the course of the study were pooled to determine group means.
Blood Collection and Transaminase Determinations
After 4 weeks of enteral feeding, mice were anesthetized with sodium pentobarbital 75 mg/kg i.p., and blood was collected from the vena cava and centrifuged. Serum was stored at 80C until it was assayed for alanine amino-transferase (ALT) by standard enzymatic procedures.
Pathologic Evaluation
After 4 weeks of ethanol treatment, livers were
formalin-fixed, embedded in paraffin, and stained with hematoxylin and eosin to assess steatosis, inflammation, and necrosis. Liver pathology was scored in a blinded manner as described by Nanji24 and Nanji et al25 as follows: steatosis (the percentage of liver cells containing fat):<25%Z1þ,
<50% Z 2þ,<75% Z 3þ, 75%>Z 4þ; inflammation and necrosis: 1 focus per low-powerfieldZ1þ; 2 or more fociZ2þ. Sections were stained with saturated picric acid that contained 0.1% Sirius Red and 0.1% Fast Green.
Immunohistochemistry and TUNEL
protocols and were incubated with specific primary anti-bodies. Fora-SMA (Dako InVision Inc., Carpenteria, CA), antibody was diluted 1:200 in 1% bovine serum albumin and applied to sections for 2 hours before secondary stain-ing. For CD3 (anti-CD3; Santa Cruz Biotechnology, Santa Cruz, CA) and F4/80 (anti-F4/80; eBioscience, San Diego, CA) staining, antibodies were diluted 1:100 in 1% bovine serum albumin and applied overnight at 4C. Staining was visualized with the horseradish peroxidase-conjugated Dako staining system (Dako InVision Inc.). Sections stained for F4/80 were independently assessed by a blinded reviewer (I.N.H. and M.D.W.) to count the number of F4/80þcells per20field.
For terminal deoxynucleotidyl transferase-mediated dUTP nick-end labeling (TUNEL), livers were fixed in
4% buffered formalin, embedded in paraffin, and stained with hematoxylin and eosin to assess steatosis, infl amma-tion, and necrosis. To assess liver cell death, deparaffinized sections were stained for DNA fragmentation with the use of a commercially available Cell Death Detection Kit (Roche, Mannheim, Germany) according to the manufac-turer’s recommendations.
RNase Protection Assay
Total RNA was isolated from liver tissue with the use of TriZol (Invitrogen, Carlsbad, CA). RNase protection assays were performed with the RiboQuant multiprobe assay sys-tem (BD PharMingen, San Diego, CA). Briefly, [32P] RNA probes were transcribed with T7 polymerase, using the multiprobe template set APO-1. RNA (20 mg) was hybrid-ized with 4105cpm of probe overnight at 56C. Samples were then digested with RNase, followed by proteinase K treatment, phenol/chloroform extraction, and ethanol precipitation. Samples were resolved on a 5% acrylamide-bisacrylamide (19:1) urea gel. After drying, the gel was visualized by autoradiography.
Western Blot Analysis and Zymography
Total protein extracts from liver tissue was isolated by mechanical digestion in RIPA buffer. For Western blot analyses, 10mg of lysates were separated by 12% to 16% SDS-PAGE, transferred to nitrocellulose, and blotted with antibodies against total caspase 8 (dilution 1:1000; no. 8592; Cell Signaling Technology Inc., Danvers, MA), activated/cleaved caspase 3 (dilution 1:1000; no. 9664; Cell Signaling Technology Inc.), a-SMA (dilution 1:1000; Sigma-Aldrich, St. Louis, MO), Timp1 (dilution 1:1000; Santa Cruz Biotechnology, Santa Cruz, CA), and
b-actin (dilution 1:2000; Sigma-Aldrich). Immunoblots were visualized with horseradish peroxidase secondary antibodies.
For zymography, 50 mg of lysates was separated on 10% Zymogram gelatin gels (Novex Life Technologies, Carls-bad, CA). After separation, proteins were renatured to allow substrate degradation. Gels were stained with Coomasie Blue to reveal areas of protease activity.
Quantitative PCR
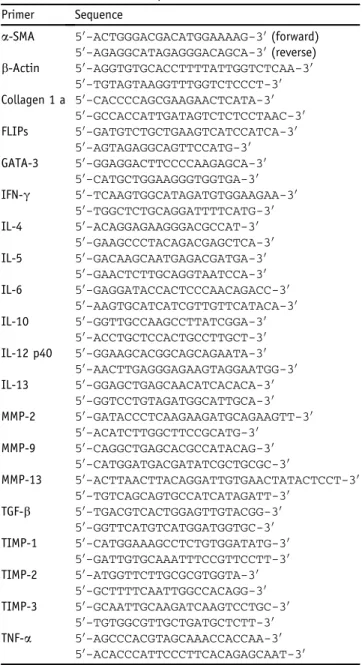
Total RNA was isolated from whole liver with the use of Trizol reagent (Invitrogen). Reverse transcription was performed with high-capacity murine leukemia virus reverse transcription (Life Technologies, Inc., Carlsbad, CA). PCRs were performed on an Eppendorf Master-cycler Realplex (Eppendorf, Hamburg, Germany) with the use of the Fermentas SYBR Green PCR Kit (Thermo Fisher, Pittsburgh, PA). The data are presented as means SEM. The sequences of the used primers are listed inTable 1.
Table 1 RT-PCR Primer Sequences
Primer Sequence
a-SMA 50-ACTGGGACGACATGGAAAAG-30 (forward)
50-AGAGGCATAGAGGGACAGCA-30 (reverse) b-Actin 50-AGGTGTGCACCTTTTATTGGTCTCAA-30
50-TGTAGTAAGGTTTGGTCTCCCT-30
Collagen 1 a 50-CACCCCAGCGAAGAACTCATA-30
50-GCCACCATTGATAGTCTCTCCTAAC-30
FLIPs 50-GATGTCTGCTGAAGTCATCCATCA-30
50-AGTAGAGGCAGTTCCATG-30
GATA-3 50-GGAGGACTTCCCCAAGAGCA-30
50-CATGCTGGAAGGGTGGTGA-30
IFN-g 50-TCAAGTGGCATAGATGTGGAAGAA-30
50-TGGCTCTGCAGGATTTTCATG-30
IL-4 50-ACAGGAGAAGGGACGCCAT-30
50-GAAGCCCTACAGACGAGCTCA-30
IL-5 50-GACAAGCAATGAGACGATGA-30
50-GAACTCTTGCAGGTAATCCA-30
IL-6 50-GAGGATACCACTCCCAACAGACC-30
50-AAGTGCATCATCGTTGTTCATACA-30
IL-10 50-GGTTGCCAAGCCTTATCGGA-30
50-ACCTGCTCCACTGCCTTGCT-30
IL-12 p40 50-GGAAGCACGGCAGCAGAATA-30
50-AACTTGAGGGAGAAGTAGGAATGG-30
IL-13 50-GGAGCTGAGCAACATCACACA-30
50-GGTCCTGTAGATGGCATTGCA-30
MMP-2 50-GATACCCTCAAGAAGATGCAGAAGTT-30
50-ACATCTTGGCTTCCGCATG-30
MMP-9 50-CAGGCTGAGCACGCCATACAG-30
50-CATGGATGACGATATCGCTGCGC-30
MMP-13 50-ACTTAACTTACAGGATTGTGAACTATACTCCT-30
50-TGTCAGCAGTGCCATCATAGATT-30
TGF-b 50-TGACGTCACTGGAGTTGTACGG-30
50-GGTTCATGTCATGGATGGTGC-30
TIMP-1 50-CATGGAAAGCCTCTGTGGATATG-30
50-GATTGTGCAAATTTCCGTTCCTT-30
TIMP-2 50-ATGGTTCTTGCGCGTGGTA-30
50-GCTTTTCAATTGGCCACAGG-30
TIMP-3 50-GCAATTGCAAGATCAAGTCCTGC-30
50-TGTGGCGTTGCTGATGCTCTT-30
TNF-a 50-AGCCCACGTAGCAAACCACCAA-30
50-ACACCCATTCCCTTCACAGAGCAAT-30
Cell Isolations
For liver nonparenchymal cells, approximately 300 mg of fresh liver tissue was pressed through a 200-gauge stainless steel mesh. For lymphocytes, the resulting cell suspension was suspended in ice-cold RPMI 1640 media, followed by centrifugation at 50gfor 5 minutes to pellet parenchymal cells. Nonparenchymal mononuclear cells were subse-quently separated through Ficoll Isopaque gradient. For liver macrophages, 300 mg of fresh liver tissue was digested for 30 minutes at 37C in 5 mL of Hanks’ balanced salt solution that contained 0.02% collagenase. The digested suspension was centrifuged 3 times at 50gfor 5 minutes to remove parenchymal cells. The resulting nonparenchymal cells in the supernatantfluid were purified by Percoll density centrifugation as described elsewhere.26Liver macrophages were cultured in RPMI 1640 media for 24 hours before use. Bone marrow-derived macrophages (BMDMs) were generated as described elsewhere.27Briefly, BM cells from wild-type and B6.gldmice were harvested from femur and tibia. These BM cells were cultured in cell-culture media supplemented with 10 ng/mL mouse recombinant macro-phage colony-stimulating factor 1 (PeproTech, Rock Hill, NJ) for 7 days.
For Annexin V labeling, enriched mononuclear cell liver cell suspensions were stained against phosphatidyl serine and labeled with propidium iodide to ensure cell membrane integrity with the use of a live/dead cell detection kit obtained from Molecular Probes (Invitrogen Detection Technologies, Carlsbad, CA). Labeled cells were subject toflow cytometry (Becton Dickinson, Palo Alto, CA), and data were analyzed by Summit version 4.2 (DakoCytomation, Fort Collins, CO).
Results
Early Ethanol-Induced Liver Injury Is Blunted in FasL
Mutant Mice
Chronic ethanol exposure was found to induce hepatocellular apoptosis; however, the overall contribution of apoptosis to ethanol-induced liver injury has not been fully addressed. To test the hypothesis that Fas-FasLemediated apoptosis plays a role in ethanol-induced liver injury, mice with a naturally occurring mutation in the FasL (B6.gld) were given the diet that contained ethanol intragastrically for 4 weeks.
Routine variables such as body weight gain, daily urine alcohol concentration, and liver-to-body weight ratio were determined. Although fluctuations in body weight were observed in all groups, the changes in body weight were within the standard growth rate changes for both wild-type and B6.gldmice on either the control or ethanol-containing diet (Figure 1A). Average urine alcohol concentrations were nearly identical for both strains (Figure 1B). The reported 5-to 7-day peak-5-to-trough cycle of daily urine alcohol concentration was also observed in both strains as well. Liver-to-body weight ratio was increased in wild-type mice
at 2 and 4 weeks of the ethanol diet compared with wild-type mice on the control diet (Figure 1C). Interestingly, the ethanol-induced increase in liver weight was not observed in B6.gldmice to the extent of that seen in wild-type mice. The increase in cyp2e1 expression because of ethanol was similar in both strains (Figure 1D).
Liver injury was also assessed by serum ALT concen-trations. The changes in liver pathology in wild-type and B6.gldmice corresponded with serum ALT concentrations (Figure 1E). Wild-type mice and B6.gld mice given the ethanol diet for 2 weeks had only mildly elevated serum ALT concentrations. However, after 4 weeks of ethanol exposure, serum ALT concentrations were elevated to 224 31 U/mL in wild-type mice. Serum ALT concen-trations in B6.gld mice were significantly blunted by 60% after 4 weeks of ethanol exposure. These data clearly sup-port a role for Fas-FasL in ethanol-induced liver injury.
Both wild-type mice and B6.gld mice on the high-fat control diet for 4 weeks showed little pathologic changes in liver (Figure 1F). After 4 weeks of the ethanol diet, livers from wild-type mice had a significant amount of hepato-cellular fat accumulation, mild inflammatory cell accumu-lation, and necrosis. Interestingly, livers from B6.gld mice under these conditions on the ethanol diet had only mild fat accumulation. Ethanol-induced liver pathology was nearly completely prevented in B6.gldmice.
Hepatocellular Apoptosis Is Blunted in FasL Mutant
Mice after Chronic Ethanol Exposure
The extent of hepatocellular apoptosis was determined by TUNEL staining in liver sections of both wild-type and B6.gld
Because apoptosis is strongly regulated by the post-translational cleavage of caspases, whole-liver extracts from wild-type and B6.gldmice were evaluated by Western blot analysis with the use of antibodies against the full-length and cleaved isoforms of caspase 8 and 3. Although the level of total or full-length caspase 8 did not significantly change after chronic ethanol exposure in either strain; the level of cleaved caspase 8 and 3 was slightly increased in wild-type mice exposed to ethanol. The increase in cleaved caspase was not observed in B6.gldmouse liver.
Ethanol-Induced Collagen Gene Expression Is
Increased in FasL Mutant Mice
Liver sections from both wild-type and B6.gld mice on either the control diet or ethanol-containing diet were stained with Sirius Red to evaluate the extent of liver
fibrosis. No fibrosis was observed in either wild-type or B6.gld livers from mice fed the control diet (Figure 3A). Little Sirius Red staining was observed in livers from wild-type mice after 4 weeks of the ethanol diet. However, a significant increase was found in the extent of Sirius Red staining in livers of B6.gldmice after 4 weeks of intragastric ethanol exposure.
Image analysis was performed on Sirius Red histochemical-stained sections to quantify the expression of collagen induced by ethanol in wild-type and B6.gldmice (Figure 3B). In wild-type mice, a twofold increase in Sirius Red staining was observed. However, in B6.gldmice, ethanol caused nearly afivefold increase in Sirius Red staining.
Liver sections were also stained immunohistochemically with antibodies againsta-SMA as a marker of liverfibrosis (Figure 3C). Similar to the pattern of Sirius Red staining,
a-SMA expression was not observed in wild-type mice given either the high-fat control diet or ethanol-containing diet. Importantly, a-SMA was dramatically expressed in livers from B6.gld mice after chronic ethanol exposure. Although the extent of liver fibrosis was not as dramatic as that seen in other rodent models of liverfibrosis, this is the
first report that we are aware of to showfibrosis caused by chronic ethanol in mice.
Collagen and Extracellular Matrix Remodeling Protein
Expression Is Altered in FasL Mutant Mice after Chronic
Ethanol Exposure
To further characterize the fibrotic response to ethanol in B6.gld mice, liver mRNA from wild-type and B6.gldmice
Figure 1 Routine variables associated with chronic EtOH-induced liver injury. WT and B6.gld
mutant mice were fed either the control diet or diet that contained EtOH intragastrically for 2 or 4 weeks. A: Initial and weekly body weights. B:
Urine was collected daily, and UAC was determined as described inMaterials and Methods. The average UAC was also determined.C: Percentage of liver weight relative to total body weight was deter-mined after sacrifice at either 2 or 4 weeks.D:The expression of cyp2e1 was assessed by real-time quantitative PCR from whole liver mRNA isolated from WT and B6.gldmice fed either the control diet or EtOH diet with the use of the primer sets described inTable 1.E:Serum ALT was determined in WT and B6.gldmutant mice after 2 and 4 weeks of either the control or EtOH-containing diet.F:
on either the control diet or diet that contained ethanol was isolated, and the expression of a number of collagen- and extracellular matrix-related genes were analyzed by real-time quantitative PCR (Figure 3D). Collagen Ia1 gene expression was slightly elevated by ethanol in wild-type mice compared with wild-type mice given the control diet. However, the increase in collagen caused by ethanol administration was greater in B6.gldmice than in wild-type mice. Interestingly, a-SMA expression under control con-ditions and after 4 weeks of ethanol administration was elevated in B6.gldmice compared with wild-type mice.
Collagen deposition is tightly regulated by synthesis but is countered by the process of degradation through matrix
metalloproteinases (MMPs). The expression of MMP-2 was not significantly different among any of the groups, although it was slightly elevated in both wild-type and B6.gldmice after ethanol exposure (Figure 3D). MMP-13 was significantly increased in both strains after chronic ethanol administration. These data suggest that ethanol is a potent inducer of MMP-13 expression in liver but do not address thefibrogenic difference between wild-type mice and B6.gldmutant mice.
MMP activity is inhibited by a family of proteins called tissue inhibitors of metalloproteinases (TIMPs). Neither TIMP-1 nor TIMP-2 expression was different between wild-type and B6.gldmice on the control diet. The ethanol diet led to a significant but minimal increase in TIMP-1
Figure 2 Hepatocellular apoptosis. WT and B6.gldmutant mice were fed either the control diet or diet that contained EtOH intragastrically for 4 weeks.A:Liver sections (6mm) were labeled with the use of in situcell death detection assay (ie, TUNEL) as described inMaterials and Methods.B:
Image densitometry for TUNEL immunohistochem-ical staining from replicates for this measurement and each tissue section was pooled to determine means.C:Liver mRNA was isolated from WT and B6.gldmutant mice that were fed either the con-trol diet or diet that contained EtOH intragastri-cally for 4 weeks. RNase protection assays were performed as described in Materials and Methods
expression, but it had no effect on TIMP-2 expression in wild-type mice (Figure 3D). However, both TIMP-1 and TIMP-2 expression were significantly increased in B6.gld
mice fed ethanol for 4 weeks compared with wild-type mice
that received ethanol. The increase in TIMP-1 and TIMP-2 expression in B6.gld mice given ethanol is consistent with the increase in collagen (ie, Sirius Red staining) under these conditions.
Figure 3 Histologic analysis offibrosis and expression ofa-SMA, collagen, and collagen-related genes.A:WT and B6.gldmutant mice were given the control diet or EtOH diet intragastrically for 4 weeks. Liver sections were collected and stained with the use of Sirius Red as described inMaterials and Methods. Representative photomicrographs of Sirius Red staining and higher magnification of EtOH-treated mice.B:Image densitometry for Sirius Red staining from replicates for this measurement and each tissue section were pooled to determine means.C:Liver sections were collected and stained with antibodies against a-SMA (dilution 1:200; Dako Invision Inc.) as described inMaterials and Methods.D:Liver mRNA was isolated from WT and B6.gldmutant mice that were fed either the control diet or diet that contained EtOH intragastrically for 4 weeks. Real-time quantitative PCR was performed for collagen I,a-SMA, MMP-2, MMP-13, TIMP-1, and TIMP-2 as described inMaterials and Methodswith the use of the primer sets described inTable 1.E:Whole-liver lysates were used to assess MMP activity with the use of gelatin zymography (top panel) and expressiona-SMA, TIMP-1, andb-actin with the use of Western blot analysis. Expression ofb-actin was used as a control. Data are expressed as meansSEM.nZ4 replicates (B);nZ10fields per section (B);nZ3 experiments in each group (E). *P<0.05 versus mice fed the control diet;yP<0.05 versus wild-type mice after EtOH administration. Original magnification:20 (A,
MMP activity was assessed through zymography in liver extracts from wild-type and B6.gld mutant mice fed the control or ethanol diet (Figure 3E). An increase in pro-MMP activity was observed in wild-type mice after ethanol exposure. Ethanol-induced MMP activity was blunted in B6.gld mice compared with wild-type mice exposed to the ethanol diet. The changes in MMP activity were consistent with increased expression ina-SMA and TIMP-1 observed in wild-type and B6.gldmice fed the ethanol diet.
Hepatic Macrophage Populations Are Increased in FasL
Mutant Mice
The gld mutant mice have a lymphoproliferative disorder that leads to excessive accumulation of CD3þlymphocytes, primarily in spleen. Tofirst investigate whether B6.gldmice accumulated CD3þ lymphocytes in liver and second to determine whether chronic ethanol led to a change in CD3þ recruitment to the liver, sections were stained immunohis-tochemically for CD3þ cells (Figure 4A). Liver sections from both wild-type and B6.gldmice showed little presence of CD3þ lymphocytes, suggesting that the Fas receptor (FasR) mutation did not alter lymphocyte accumulation in hepatic tissue. Chronic ethanol exposure led to a measurable
increase in CD3 lymphocyte infiltration in liver, but this was not significantly different between the wild-type and B6.gld
strains (Figure 4B). The increase in CD3þcells in liver after ethanol exposure is consistent with earlier reports.15,16
To investigate the hepatic macrophage population, sec-tions were stained immunohistochemically for F4/80 (Figure 4C), and hepatic F4/80þmacrophages were
quanti-fied (Figure 4D). Wild-type mice exhibited a slight decrease in the number of hepatic F4/80þmacrophages after chronic ethanol exposure. Interestingly, B6.gldmice under the con-trol fed conditions and after chronic ethanol exposure had a significant increase in F4/80 macrophages compared with wild-type mice.
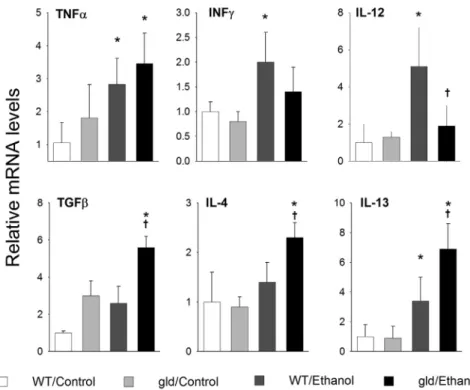
Hepatic Cytokine Expression Favors Fibrogenic Response
in FasL Mutant Mice after Chronic Ethanol Exposure
Cytokine expression was determined by real-time quanti-tative PCR with the use of mRNA isolated from livers of wild-type and B6.gld mice fed either the high-fat control diet or the diet that contained ethanol for 4 weeks (Figure 5). TNF-a mRNA was increased in response to ethanol in both wild-type and B6.gld mouse liver. Like-wise, the ethanol-induced increase in TGF-b observed in
Figure 4 Immunohistochemistry of liver CD3þ and F4/80þ cell infiltration. A: WT and B6.gld
mutant mice were given the control diet or ethanol diet intragastrically for 4 weeks. Liver sections were collected and stained with antibodies against T lymphocyte marker CD3 (dilution 1:100; Santa Cruz Biotechnology) as described in Materials and Methods. Representative photomicrographs of CD3 immunohistochemical staining and higher magnifi -cation of ethanol-treated mice. B: Image densi-tometry for CD3 immunohistochemical staining from replicates for this measurement and each tis-sue section were pooled to determine means.
C: Liver sections were collected and stained with antibodies against macrophage marker F4/80 (dilution 1:100; eBiosource) as described in
Materials and Methods. Representative photomicro-graphs of F4/80 immunohistochemical staining.D:
Image densitometry for F4/80 immunohistochem-ical staining from replicates for this measurement and each tissue section were pooled to determine means. Data are expressed as meansSEM.nZ3 to 4 replicates (B);nZ10fields per section (Band
wild-type mice was also observed in B6.gldmice. Several proinflammatory type 1 cytokines, including IL-12 and interferon (IFN)-g were increased in livers of wild-type mice given ethanol. This increase was, however, blunted in B6.gld mice. This observation is consistent with the differences seen in pathology between wild-type and B6.gldmice fed ethanol.
Ethanol caused a significant increase in the expression of type 2 cytokines IL-4, IL-5, and IL-13 in wild-type mice. Interestingly, the expression of IL-4, IL-13, and IL-5 was significantly elevated in B6.gldlivers after ethanol as well. These data suggest that the role of FasL in ethanol-induced hepatitis depends on proinflammatory cytokine expression. Moreover, these data suggest that Fas-FasL pathways are important for the regulation of cytokine phenotype (type 1 versus type 2). The increase in type 2 cytokines in B6.gld
mice may underlie the profibrotic response observed in B6.gldmice. Importantly, a clear role for type 2 cytokines in
fibrogenesis was reported.
Stimulation of FasR Regulates Cytokine Production in
Isolated Macrophages
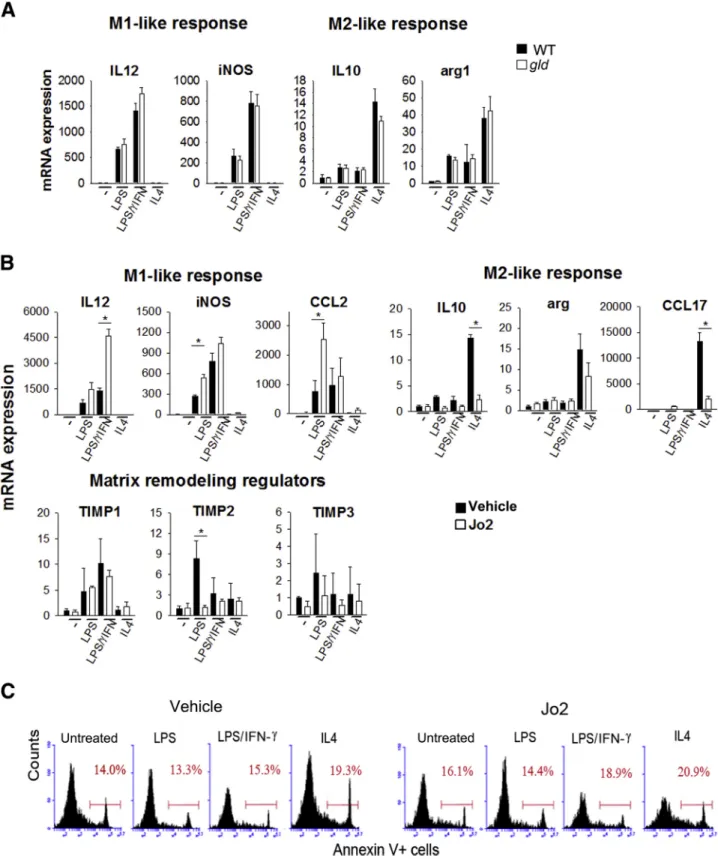
Naive BMDMs were stimulated with lipopolysaccharide (LPS) alone, LPS plus IFN-g, or IL-4 alone. LPS combined with IFN-g induces a strong proinflammatory M1-like response in isolated macrophages; whereas IL-4 is a potent inducer of an anti-inflammatory/regulatory M2 response. LPS and LPS combined with IFN-g increased cytokines and chemokines that are associated with an M1 proinflammatory response; whereas IL-4 induced a marked increase in arginase and M2-associated cytokines and che-mokines (Figure 6A). BMDMs from wild-type and B6.gld
mice did not significantly differ in their response to LPS, LPS/IFN-g, or IL-4, suggesting that loss of FasL does not intrinsically alter macrophage signaling pathways.
To assess the role of FasR stimulation on macrophage response, wild-type BMDMs were stimulated with LPS, LPS/IFN-g, and IL-4 in the presence of FasR agonist, anti-CD95 antibody Jo2 antibody (0.1mg/mL; BD PharMingen). The presence of Jo2 antibody had a significant effect on LPS- and LPS/INF-geinduced M1 cytokine and chemokine response. Both IL-12 and chemokine ligand 2 expression was significantly enhanced by Jo2 in response to LPS and LPS/INF-g (Figure 6B). Inducible nitric oxide synthase expression was only minimally affected by FasR engagement with Jo2. Conversely, IL-4estimulated M2-like cytokines arginase, IL-10, and chemokine ligand 17 expression was significantly blunted by Jo2. These findings support the hypothesis that FasR engagement regulates macrophage cytokine response in favor of an M1-like proinflammatory response but limits M2 response in vitro. These data are consistent with the in vivo findings in which loss of FasL shifts ethanol-induced proinflammatory cytokine production toward morefibrogenic conditions.
Apoptosis of BMDMs under similar conditions as those in the previous paragraph was assessed byflow cytometry of Annexin V labeling. Cells were treated with LPS, LPS/ INF-g, or IL-4 in the presence or absence of anti-CD95 antibody Jo2 for 24 hours. Cell survival was not affected by LPS or LPS/IFN-gtreatment; however, the number of apoptotic macrophages was slightly increased by IL-4 treatment (Figure 6C). Importantly, the stimulation of macrophages with anti-CD95 antibody Jo2, either alone or in the presence of LPS/IFN-g, or IL4, had no effect on cell survival.
Figure 6 Polarization of BMDMsin vitro. Naive BMDMs from WT mice were obtained as described inMaterials and Methods.A:BMDMs from WT and B6.gld
These experiments were repeated in hepatic macrophages (ie, Kupffer cells) isolated from wild-type mice (Figure 7). Kupffer cells were stimulated by LPS, LPS/IFN-g, and IL-4. Under these conditions, Kupffer cells responded in similar fashion to BMDMs with the exception of their response to LPS/IFN-g, which had minimal effect on Kupffer cells
in vitro. LPS induced an increase in IL-12, iNOS, and chemokine C-C motif ligand 2 in Kupffer cells. This in-crease was minimally exacerbated in the presence of Jo2 antibody. LPS/IFN-gdid not induce a response in isolated Kupffer cells either in the absence or presence of Jo2. Finally, the increase in IL-10, arginase, and chemokine ligand 17 by IL-4 in Kupffer cells was nearly completely blunted in the presence of Jo2. These datafirst indicate that naive Kupffer cells can exhibit both M1 proinflammatory and M2-like characteristics in vitro. Moreover, these data further support the hypothesis that FasR engagement regu-lates M1/M2 responses in macrophages by limiting the M2 cytokine and chemokine production.
Discussion
Several groups have shown that apoptosis was a predomi-nant feature of alcoholic hepatitis5,6,28,29; however, the role of Fas-mediated apoptosis in alcoholic liver disease had not been directly addressed. Canbay et al28,30 found that FasR (lpr) was important in the development of hepatocellular injury andfibrosis in an experimental model of cholestasis. Here, it is found that the deletion of Fas-mediated apoptosis through a naturally occurring FasL mutation (gld mutant mice) significantly blunted early ethanol-induced hepatitis, suggesting that not only is TNF-aeinduced necrosis an important component of alcoholic liver injury but so is Fas-mediated apoptosis. Although early proinflammatory cytokine (ie, TNF-a) expression was not substantially different
between the strains in this model, it seems that Fas-FasL may be critical effectors of hepatocellular injury that was indicated by the release of ALT and decrease in fat accumulation.
Apoptosis of hepatocytes plays an important role in the initiation of liver injury.24,31 Furthermore, hepatocyte apoptosis is significantly increased in patients with alcoholic hepatitis and correlates with disease severity and hepatic
fibrosis.29 In other models of liver disease, however, Fas-mediated apoptosis is necessary for fibrosis. Data here are consistent with the hypothesis that apoptosis is a component of ethanol-induced liver injury, and it fits with some observations that Fas-mediated apoptosis is necessary for liver fibrosis. The question is why increased fibrosis is observed in B6.gldmice given chronic ethanol, yetfibrosis is blunted in Fas mutant (lpr) mice after bile duct ligation.30 Although our data affirm a significant relation between Fas-mediated apoptosis and liver fibrogenesis, these data highlight the important mechanistic differences in the path-ogenesis between the various rodent liverfibrosis models. A fundamental difference is that carbon tetrachloride and bile duct ligation-induced fibrosis is subsequent to overt hepato-cellular damage. The ethanol diet induces a mild, chronic inflammatory response in comparison; thus, as a result it has a more balanced proinflammatory/wound healing response.
In the current rodent models of alcoholic liver disease,
fibrosis is hardly an observable feature of the pathology. The thinking was that hepatocellular injury has not been sufficient enough to favor the transition to hepatic fi bro-genesis and that ethanol-inducedfibrogenesis was both time and dose dependent, two variables difficult to overcome in current models. It is found here that ethanol exposure through intragastric cannulation produced measurable
fibrosis in mice. Importantly, thisfibrogenic effect was only observed in B6.gld mice, despite a decrease in ethanol-induce hepatocellular injury in these same mice. Fibrosis is a dynamic process in which an imbalance between matrix
production and degradation exists. In another sense, it can be the negative consequence of an unregulated wound healing response.32,33 Degradation of matrix proteins is regulated by a family of MMPs, which in turn are regulated by several activated forms by TIMPs.4,34e36Here, we show an increase of collagen deposition and a-SMA production with a concomitant decrease in matrix degradation in gld
mutant mice compared with wild-type mice fed ethanol. MMP expression was not different between the strains; however, in B6.gld mice, the inhibitors of MMP TIMP-1 and -2 were significantly elevated after ethanol exposure. These data fit nicely with the observation that blocking TIMP with antibodies blocked carbon tetrachloride-induced liver fibrosis.37,38 The source and function of matrix remodeling proteins infibrotic liver is of question, but it is clear that both MMP and TIMP expressions are finely regulated to a large degree by the microenvironmental milieu of cytokines and immune cell-derived growth factors. The role of macrophage FasR response has not been heavily studied. Two important observations were made about the effect of FasR signaling on macrophage func-tion. First, B6.gld mice had a significant increase in liver F4/80þ cells; second, FasR engagement had dramatic effects on cytokine response from isolated macrophages
in vitro. Macrophages were found to exhibit more of an M2 polarization state in different pathologic situations associated with fibrosis.39 IL-4 and IL-13, which can be produced by macrophages and can stimulate TGF-b pro-duction, have strong profibrotic activity. In short,fibrosis is driven by the development and sustainment of an M2/Th2-like response in many fibrosis models; whereas, M1/Th1 factors (ie, IFN-g and IL-12) may actually antagonize the fibrotic response.40,41 Data presented here clearly indicate a shift of type 2 cytokine production in B6.gld mutant mice. This report is the first to find that FasR stimulation inhibits macrophage polarization toward the M2 phenotype in vitro. Because FasR engagement limits the anti-inflammatory/wound repair response in macrophages suggests a larger role of Fas-FasL in regu-lating a sustained proinflammatory response. FasR on macrophages may serve as a key microenvironmental sensor that fine-tunes tissue macrophage response to injury. How macrophages become resistant to Fas-mediated apoptosis and how FasR signaling regulates macrophage polarization at the cellular level are of inter-est. It was shown that FLICE-like inhibitory protein, a suppressor of Fas-mediated apoptosis, is highly expressed in macrophages and is necessary for macrophage differ-entiation.42,43 Conversely, macrophages deficient in Fas-associated death domain exhibit elevated inflammatory cytokines.44 These data further the mounting body of evidence of the relation between the mechanisms of apoptosis and immune cell signaling.
These data here support the proposed relation between apoptosis and development of fibrosis. Another intriguing question is whether the apoptosis of inflammatory cells or
hepatic stellate cells is a key regulator of the fibrotic response. We show a decrease in hepatic apoptosis in B6.gld mice. We also show resistance of macrophages to FasL-induced cell death in vitro. However, the limitation of our experiment is that it does not address the cellular specificity of apoptosis. The assumption is that most apoptotic cells in ethanol-treated animals are hepatocytes, but the possibility exists that macrophages, infiltrating immune cells, and activated stellate cells may be under-going apoptosis under these conditions. In fact, inhibition of inflammatory cells or stellate cells from apoptosis would interfere with their clearance after activation and would thus lead to an exacerbated inflammatory or fibrotic response.31,33Experiments presented here focused on the role of FasR engagement in macrophage function, the role of other nonparenchymal cell apoptosis in ethanol-induced liver injury especially the stellate cell cannot be discounted.
Conclusions
In summary, the major findings presented here are that B6.gld mice exhibit a greater fibrogenic phenotype in response to chronic ethanol exposure, that there is a sig-nificant shift in ethanol-fed B6.gld mice toward M2-like response (eg, TGF-b, IL-13) which favors fibrogenesis, and that FasR engagement regulates macrophage polariza-tion in vitro. It is concluded here that Fas-mediated apoptosis indeed plays a critical role in the pathogenesis of alcoholic liver disease and that deletion of FasL permits a more regulatory/wound healing pattern that promotes
fibrogenesis in a chronic model of ethanol consumption. These data clearly support multiple possible roles of Fas-FasL in parenchymal and nonparenchymal cellular response to ethanol exposure. Finally, the evidence points to a better understanding of the complex interactions between the regulation of cell death mechanisms and immune cell signaling.
References
1. Bataller R, Brenner DA: Liver fibrosis. J Clin Invest 2005, 115: 209e218
2. Higuchi H, Gores GJ: Mechanisms of liver injury: an overview. Curr Mol Med 2003, 3:483e490
3. Friedman SL, Roll FJ, Boyles J, Bissell DM: Hepatic lipocytes: the principal collagen-producing cells of normal rat liver. Proc Natl Acad Sci U S A 1985, 82:8681e8685
4. Arthur MJ, Friedman SL, Roll FJ, Bissell DM: Lipocytes from normal rat liver release a neutral metalloproteinase that degrades basement membrane (type IV) collagen. J Clin Invest 1989, 84: 1076e1085
5. Canbay A, Higuchi H, Bronk SF, Taniai M, Sebo TJ, Gores GJ: Fas enhancesfibrogenesis in the bile duct ligated mouse: a link between apoptosis andfibrosis. Gastroenterology 2002, 123:1323e1330 6. Feldstein AE, Canbay A, Angulo P, Taniai M, Burgart LJ, Lindor KD,
features of human nonalcoholic steatohepatitis. Gastroenterology 2003, 125:437e443
7. Canbay A, Feldstein A, Baskin-Bey E, Bronk SF, Gores GJ: The caspase inhibitor IDN-6556 attenuates hepatic injury andfibrosis in the bile duct ligated mouse. J Pharmacol Exp Ther 2004, 308:1191e1196 8. Wynn TA: Fibrotic disease and the T(H)1/T(H)2 paradigm. Nat Rev
Immunol 2004, 4:583e594
9. Chiaramonte MG, Donaldson DD, Cheever AW, Wynn TA: An IL-13 inhibitor blocks the development of hepaticfibrosis during a T-helper type 2-dominated inflammatory response. J Clin Invest 1999, 104: 777e785
10. Kaviratne M, Hesse M, Leusink M, Cheever AW, Davies SJ, McKerrow JH, Wakefield LM, Letterio JJ, Wynn TA: IL-13 activates a mechanism of tissuefibrosis that is completely TGF-beta independent. J Immunol 2004, 173:4020e4029
11. McKenzie GJ, Bancroft A, Grencis RK, McKenzie AN: A distinct role for interleukin-13 in Th2-cell-mediated immune responses. Curr Biol 1998, 8:339e342
12. McKenzie GJ, Fallon PG, Emson CL, Grencis RK, McKenzie AN: Simultaneous disruption of interleukin (IL)-4 and IL-13 defines indi-vidual roles in T helper cell type 2-mediated responses. J Exp Med 1999, 189:1565e1572
13. Nagata S, Suda T: Fas and Fas ligand: lpr and gld mutations. Immunol Today 1995, 16:39e43
14. Takahashi T, Tanaka M, Brannan CI, Jenkins NA, Copeland NG, Suda T, Nagata S: Generalized lymphoproliferative disease in mice, caused by a point mutation in the Fas ligand. Cell 1994, 76: 969e976
15. Alenzi FQ, Marley SB, Lewis JL, Chandrashekran A, Warrens AN, Goldman JM, Gordon MY: A role for the Fas/Fas ligand apoptotic pathway in regulating myeloid progenitor cell kinetics. Exp Hematol 2002, 30:1428e1435
16. Mysler E, Bini P, Drappa J, Ramos P, Friedman SM, Krammer PH, Elkon KB: The apoptosis-1/Fas protein in human systemic lupus er-ythematosus. J Clin Invest 1994, 93:1029e1034
17. Park DR, Thomsen AR, Frevert CW, Pham U, Skerrett SJ, Kiener PA, Liles WC: Fas (CD95) induces proinflammatory cytokine responses by human monocytes and monocyte-derived macrophages. J Immunol 2003, 170:6209e6216
18. Tsukamoto H, Reidelberger RD, French SW, Largman C: Long-term cannulation model for blood sampling and intragastric infusion in the rat. Am J Physiol 1984, 247:R595eR599
19. Yin M, Wheeler MD, Kono H, Bradford BU, Gallucci RM, Luster MI, Thurman RG: Essential role of tumor necrosis factor alpha in alcohol-induced liver injury in mice. Gastroenterology 1999, 117: 942e952
20. Uesugi T, Froh M, Arteel GE, Bradford BU, Gabele E, Wheeler MD, Thurman RG: Delivery of IkappaB superrepressor gene with adeno-virus reduces early alcohol-induced liver injury in rats. Hepatology 2001, 34:1149e1157
21. Kono H, Bradford BU, Yin M, Sulik KK, Koop DR, Peters JM, Gonzalez FJ, McDonald T, Dikalova A, Kadiiska MB, Mason RP, Thurman RG: CYP2E1 is not involved in early alcohol-induced liver injury. Am J Physiol 1999, 277:G1259eG1267
22. Thompson JA, Reitz RC: Effects of ethanol ingestion and dietary fat levels on mitochondrial lipids in male and female rats. Lipids 1978, 13: 540e550
23. Morimoto M, Zern MA, Hagbjork AL, Ingelman-Sundberg M, French SW: Fish oil, alcohol, and liver pathology: role of cytochrome P450 2E1. Proc Soc Exp Biol Med 1994, 207:197e205
24. Nanji AA: Apoptosis and alcoholic liver disease. Semin Liver Dis 1998, 18:187e190
25. Nanji AA, Khwaja S, Khettry U, Sadrzadeh SM: Plasma endothelin levels in chronic ethanol fed rats: relationship to pathologic liver injury. Life Sci 1994, 54:423e428
26. Smedsrod B, Pertoft H: Preparation of pure hepatocytes and reticulo-endothelial cells in high yield from a single rat liver by means of Percoll centrifugation and selective adherence. J Leukoc Biol 1985, 38: 213e230
27. Davis BK: Evaluation of classical, alternative, and regulatory functions of bone marrow-derived macrophages. Methods Mol Biol 2013, 1032: 79e89
28. Canbay A, Feldstein AE, Higuchi H, Werneburg N, Grambihler A, Bronk SF, Gores GJ: Kupffer cell engulfment of apoptotic bodies stimulates death ligand and cytokine expression. Hepatology 2003, 38: 1188e1198
29. Natori S, Rust C, Stadheim LM, Srinivasan A, Burgart LJ, Gores GJ: Hepatocyte apoptosis is a pathologic feature of human alcoholic hep-atitis. J Hepatol 2001, 34:248e253
30. Canbay A, Taimr P, Torok N, Higuchi H, Friedman S, Gores GJ: Apoptotic body engulfment by a human stellate cell line is profi bro-genic. Lab Invest 2003, 83:655e663
31. Ishii H, Adachi M, Fernandez-Checa JC, Cederbaum AI, Deaciuc IV, Nanji AA: Role of apoptosis in alcoholic liver injury. Alcohol Clin Exp Res 2003, 27:1207e1212
32. Neubauer K, Saile B, Ramadori G: Liverfibrosis and altered matrix synthesis. Can J Gastroenterol 2001, 15:187e193
33. Saile B, Knittel T, Matthes N, Schott P, Ramadori G: CD95/CD95L-mediated apoptosis of the hepatic stellate cell. A mechanism termi-nating uncontrolled hepatic stellate cell proliferation during hepatic tissue repair. Am J Pathol 1997, 151:1265e1272
34. Fujiwara K, Sakai T, Oda T, Igarashi S: The presence of collagenase in Kupffer cells of the rat liver. Biochem Biophys Res Commun 1973, 54:531e537
35. Emonard H, Grimaud JA: Matrix metalloproteinases. A review. Cell Mol Biol 1990, 36:131e153
36. Emonard H, Guillouzo A, Lapiere CM, Grimaud JA: Human liver
fibroblast capacity for synthesizing interstitial collagenase in vitro. Cell Mol Biol 1990, 36:461e467
37. Parsons CJ, Bradford BU, Pan CQ, Cheung E, Schauer M, Knorr A, Krebs B, Kraft S, Zahn S, Brocks B, Feirt N, Mei B, Cho MS, Ramamoorthi R, Roldan G, Ng P, Lum P, Hirth-Dietrich C, Tomkinson A, Brenner DA: Antifibrotic effects of a tissue inhibitor of metalloproteinase-1 antibody on established liver fibrosis in rats. Hepatology 2004, 40:1106e1115
38. Lin S, Saxena NK, Ding X, Stein LL, Anania FA: Leptin increases tissue inhibitor of metalloproteinase I (TIMP-1) gene expression by a specificity protein 1/signal transducer and activator of transcription 3 mechanism. Mol Endocrinol 2006, 20:3376e3388
39. Sica A, Invernizzi P, Mantovani A: Macrophage plasticity and polar-ization in liver homeostasis and pathology. Hepatology 2014, 59: 2034e2042
40. Hoffmann KF, Cheever AW, Wynn TA: IL-10 and the dangers of immune polarization: excessive type 1 and type 2 cytokine responses induce distinct forms of lethal immunopathology in murine schisto-somiasis. J Immunol 2000, 164:6406e6416
41. Barron L, Wynn TA: Fibrosis is regulated by Th2 and Th17 responses and by dynamic interactions betweenfibroblasts and macrophages. Am J Physiol Gastrointest Liver Physiol 2011, 300:G723eG728 42. Perlman H, Pagliari LJ, Georganas C, Mano T, Walsh K, Pope RM:
FLICE-inhibitory protein expression during macrophage differentia-tion confers resistance to fas-mediated apoptosis. J Exp Med 1999, 190:1679e1688
43. Huang QQ, Perlman H, Huang Z, Birkett R, Kan L, Agrawal H, Misharin A, Gurbuxani S, Crispino JD, Pope RM: FLIP: a novel regulator of macrophage differentiation and granulocyte homeostasis. Blood 2010, 116:4968e4977