Ar ticle
The Rockefeller University Press $30.00
The J
our
nal of Exper
imental Medicine
IntroductIon
Enteropathy-associated T cell lymphoma (EATL) is an un-common but lethal type of peripheral T cell lymphoma that appears to be rising in incidence (Swerdlow et al., 2008; Sharaiha et al., 2012). EATL is the most common oncologic complication of celiac disease, with a prevalence of ∼1% in those patients (Ferreri et al., 2011). The role of genetic muta-tions in the pathogenesis of EATL is largely unknown.
Past World Health Organization lymphoma classifica-tion systems (Swerdlow et al., 2008; Campo et al., 2011) have
recognized two subtypes of EATL. Type I EATL has a more variable histology, is more prevalent in Northern Europe (Delabie et al., 2011), and is strongly associated with celiac disease. Type II EATL has a more uniform histology, occa-sional association with celiac disease (Delabie et al., 2011), and is more prevalent in Asia (Sun et al., 2011; Tse et al., 2012; Kikuma et al., 2014). The diagnostic distinction between these two types is not always clear. Cases are currently classi-fied based on their morphology and immunophenotype, with both types sharing common T cell markers but type II cases
Enteropathy-associated t cell lymphoma (EAtL) is a lethal, and the most common, neoplastic complication of celiac disease. Here, we defined the genetic landscape of EAtL through whole-exome sequencing of 69 EAtL tumors. SEtd2 was the most frequently silenced gene in EAtL (32% of cases). the JAK-StAt pathway was the most frequently mutated pathway, with frequent mutations in StAt5B as well as JAK1, JAK3, StAt3, and SocS1. We also identified mutations in KrAS, tP53, and tErt. type I EAtL and type II EAtL (monomorphic epitheliotropic intestinal t cell lymphoma) had highly overlapping genetic alterations indicating shared mechanisms underlying their pathogenesis. We modeled the effects of SEtd2 loss in vivo by de-veloping a t cell–specific knockout mouse. these mice manifested an expansion of γδ t cells, indicating novel roles for SEtd2 in t cell development and lymphomagenesis. our data render the most comprehensive genetic portrait yet of this uncommon but lethal disease and may inform future classification schemes.
Enteropathy-associated T cell lymphoma subtypes are
characterized by loss of function of SETD2
Andrea B. Moffitt,
1,3Sarah L. Ondrejka,
6Matthew McKinney,
3Rachel E. Rempel,
3John R. Goodlad,
7Chun Huat Teh,
8Sirpa Leppa,
9Susanna Mannisto,
9Panu E. Kovanen,
10Eric Tse,
11Rex K.H. Au-Yeung,
11Yok-Lam Kwong,
11Gopesh Srivastava,
11Javeed Iqbal,
12Jiayu Yu,
12Kikkeri Naresh,
13Diego Villa,
14Randy D. Gascoyne,
14Jonathan Said,
15Magdalena B. Czader,
16Amy Chadburn,
17Kristy L. Richards,
18Deepthi Rajagopalan,
3Nicholas S. Davis,
3Eileen C. Smith,
3Brooke C. Palus,
3Tiffany J. Tzeng,
3Jane A. Healy,
3Patricia L. Lugar,
4Jyotishka Datta,
2Cassandra Love,
3Shawn Levy,
19David B. Dunson,
2Yuan Zhuang,
5Eric D. Hsi,
6and Sandeep S. Dave
1,31Duke Center for Genomics and Computational Biology and 2Department of Statistical Science, Duke University, Durham, NC 27708 3Duke Cancer Institute, 4Department of Medicine, and 5Department of Immunology, Duke University School of Medicine, Durham, NC 27710 6Pathology and Laboratory Medicine Institute, Cleveland Clinic, Cleveland, OH 44195
7Haematological Malignancy Diagnostic Service, St. James's University Hospital, Leeds LS9 7TF, England, UK 8Haematology Department, Western General Hospital, Edinburgh EH14 1TY, Scotland, UK
9Department of Oncology and Research Program Unit, Faculty of Medicine and 10HUS LAB and Medicum, Helsinki University Hospital Cancer Center and University
of Helsinki, 00014 Helsinki, Finland
11University of Hong Kong, Queen Mary Hospital, Hong Kong, China 12University of Nebraska Medical Center, Omaha, NE 68198 13Imperial College London, London SW7 2AZ, England, UK
14British Columbia Cancer Agency, University of British Columbia, Vancouver, BC V6R 1ZE, Canada 15University of California, Los Angeles, Los Angeles, CA 90095
16Indiana University, Indianapolis, IN 46202
17Presbyterian Hospital, Pathology and Cell Biology, Cornell University, New York, NY 10065 18University of North Carolina at Chapel Hill, Chapel Hill, NC 27599
19Hudson Alpha Institute for Biotechnology, Huntsville, AL 35806
© 2017 Moffitt et al. This article is distributed under the terms of an Attribution–Noncommercial–Share Alike–No Mirror Sites license for the first six months after the publication date (see http ://www .rupress .org /terms /). After six months it is available under a Creative Commons License (Attribution–Noncommercial– Share Alike 4.0 International license, as described at https ://creativecommons .org /licenses /by -nc -sa /4 .0 /).
Correspondence to Sandeep S. Dave: [email protected]
expressing CD56 more frequently (Delabie et al., 2011; Arps and Smith, 2013). Most type I patients carry the celiac dis-ease–associated HLA genotype DQA1*0501, DQB1*0201, whereas that genotype occurs at a frequency similar to the general population in type II patients. Based on these distinc-tions, it has been recommended that type II EATL should be reclassified as a distinct entity, known as monomorphic epitheliotropic intestinal T cell lymphoma (Swerdlow et al., 2016). The genomic distinction between the two described types of EATL is not well understood. Compared with other peripheral T cell lymphomas, which are primarily derived from αβ T cells, both types of EATL frequently arise from γδ T cells, a feature they share with hepatosplenic T cell lym-phoma (HSTL; Belhadj et al., 2003).
In this study, we applied whole-exome and transcriptome sequencing to define novel driver mutations, copy-number al-terations, and expression patterns in both types of EATL. We found that both types of EATL are characterized by frequent silencing mutations in SETD2. We further modeled the effects of SETD2 loss in vivo by developing a T cell–specific knock-out of the gene in mice. We found that mice with Setd2 loss manifested an expansion of γδ T cells, suggesting novel roles for SETD2 in T cell development. Together, our data render the most comprehensive genetic portrait yet of EATL and may inform future classification schemes of this disease.
rESuLtS
Whole-exome sequencing defines driver mutations and copy-number alterations in EAtL
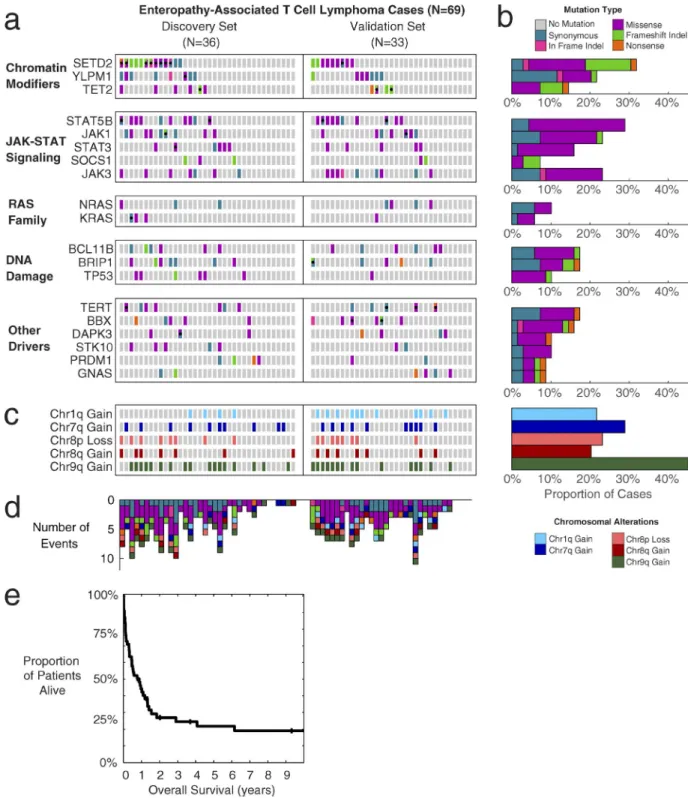
We performed whole-exome sequencing on 69 EATL tu-mors along with paired normal samples when available (n = 36), for a total of 105 exomes. Mean exome sequencing depth was greater than 70×. EATL cases were separated into the 36 cases with paired normal tissue available, deemed the “discovery set,” and the remaining samples, a “validation set.”
Fig. 1 a shows the mutation status of each significant EATL driver gene in each EATL case, with the number of cases summarized in the bar graphs of Fig. 1 b. Every gene shown had at least two confirmed somatic mutations in the discovery set with additional rare variants in the validation set that were comparable to those in the discovery set in terms of their frequency in the general population, distribution of amino acid alterations, location in protein domains, and evo-lutionary conservation, as we have described previously (Love et al., 2012; Zhang et al., 2014).
The most frequently mutated gene in EATL was found to be SETD2 (32% of cases), with the mutations featuring a large proportion (41%) of loss-of-function frameshift indels or nonsense mutations. Other chromatin modifiers were also mutated in a significant number of cases, such as TET2 and YLPM1, and typically exhibit loss-of-function type mutations.
The JAK-STAT pathway was the most commonly mu-tated signaling pathway, with frequent activating mutations
in STAT5B (29%), followed by JAK1 (23%), JAK3 (23%),
STAT3 (16%), and frameshift mutations in the negative
reg-ulator of the pathway, SOCS1 (7%). Interestingly, the RAS family of genes, which are rarely mutated in lymphomas, were also implicated in several EATL cases, with mutations at known activating hotspots (G12/G13) in NRAS and KRAS.
DNA damage response and repair genes were fre-quently mutated in EATL. TP53 was mutated in 10% of the cases. Other DNA damage–related genes mutated include BCL11B, a known tumor suppressor in T cell lymphomas,
and BRIP1, a DNA helicase known to be involved in the
repair of double-strand breaks.
Other noteworthy genes mutated in EATL included apoptosis-associated DAPK3 (10%), the cell cycle transcrip-tion factor BBX (16%), the interferon-related transcriptranscrip-tion factor PRDM1 (9%), and the telomerase reverse transcription TERT (17%). Full details of somatic mutations detected in EATL cases are described in Table S1.
We analyzed the mutual exclusion patterns of the mutated driver genes using the weighted row exclusivity test (Leiserson et al., 2016). Examining sets of 3 genes, we found 11 significant sets, involving 12 different genes, which are listed in Table S2. The JAK-STAT pathway is prominent among the mutually exclusive genes, with all of the significant sets including at least one of the genes from STAT5B, STAT3, JAK1, and JAK3, as shown in Fig. S1 a. We also quantified how often each gene pair occurs among the significant sets of four genes, which showed PRDM1 and DAPK3, followed by STAT3 and STAT5B, as the most common mutually exclusive gene pairs (Fig. S1 b).
To further understand the genetic drivers of EATL, we investigated the distribution of allele frequencies of mutations in the driver genes and the fraction of mutations that appear to be clonal. Estimates of cancer cell fraction based on observed allele frequencies for each driver gene are shown in Fig. S1 (c and d). STK10, DAPK3, TP53, and STAT5B showed the highest proportion of clonal events among the driver genes.
We next examined copy-number alterations in these cases. Interestingly, most of the copy-number alterations in EATL cases occurred in very large regions, frequently com-prising an entire arm of the chromosome. After correcting for these effects, there were no focal gene-level alterations that reached statistical significance.
Fig. 1 c depicts the significant copy number alteration status of each EATL case by chromosomal arm. Similar to previous studies investigating both type I and type II EATLs (deLeeuw et al., 2007; Ko et al., 2010; Tomita et al., 2015), we observed amplifications in chromosome 9q to be the most common in EATL (46%). We also noted gains in chromo-somes 1q, 7q, and 8q, as well as losses in 8p, which were each present in 20–30% of cases. Many cases had more than one of the noted alterations. The total number of events per case out of the shown EATL driver events is depicted in Fig. 1 d. Additional details of copy-number alterations are in Table S3.
clinical features of the EAtL cohort
tients. Good performance status (P = 0.003), low stage (P = 0.006), and complete response to initial treatment (P < 0.001) were all associated with better outcome (Fig. S1, e–g).
Assignment of each case to the two types of EATL was determined based on World Health Organization criteria (Swerdlow et al., 2008). The two types of EATL were re-markably similar in terms of overall survival (median survival: 9 mo for type I, 11 mo for type II; Fig. S1 h), age of onset (64 yr for type I, 59 yr for type II), and gender (44% male for type I, 52% male for type II). As expected, the type I patients were primarily Caucasian (93%), whereas the type II patients were split (57% Caucasian and 39% Asian).
History or concurrent diagnosis of celiac disease was observed in 84% of type I EATL cases compared with 16% of type II cases. The DQ2 or DQ8 HLA genotypes were ob-served in 88% of type I EATL patients, and 43% of type II EATL patients (Table S4). Among patients with type I EATL, adherence to a gluten-free diet appeared to correlate with improved outcomes (P = 0.07; Fig. S1 i).
Additional clinical parameters are summarized in Table 1, with full clinical and pathological details in Table S5.
Genomic and transcriptomic differences between type I and type II EAtL
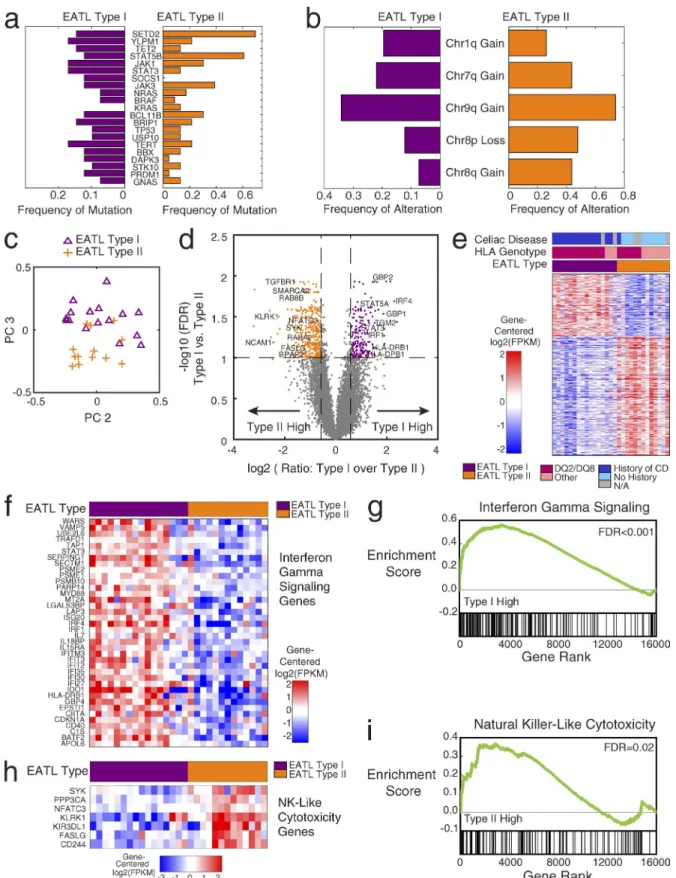
Given the paucity of our understanding of the molecular dis-tinction between the two described types of EATL, we fur-ther investigated the mutation frequencies in type I (n = 41) and type II (n = 23) EATLs (Fig. 2 a). Overall, we found that the overwhelming majority of the genes (90%) to be mutated in both types of EATL. A few selected genes appeared to be mutated more frequently in one type or the other. SOCS1 and DAPK3 had higher frequencies in type I, whereas KRAS, STAT5B (>50% in type II), and SETD2 (>60% in type II) had higher frequencies in type II EATL. Fig. 2 b shows simi-lar findings when we examined copy-number alterations sep-arately in type I and II cases. Chromosome 9q gains were the most common alteration in both types. Diagnostic guidelines have attributed 1q gains primarily to type I EATL (Arps and Smith, 2013); however, we found chromosome 1q gains to be present in at least 20% of cases in both types of EATL. Chromosome 8 alterations, particularly gains in chromosome 8q, which includes MYC, were significantly more frequent in type II EATL but also occurred in type I.
These data indicate that type I and type II EATL cases have strongly overlapping genetic alterations and likely arise from shared genetic mechanisms.
We further investigated the gene expression profiles through transcriptome sequencing of 29 EATL tumors for which RNA was available, including type I (n = 16) and type II (n = 13) cases. Unbiased principal-component analysis re-vealed that a large amount of variation in the gene expression data are driven by the differences between type I and type II cases. Plotting each of the EATL samples in the principal component space (Fig. 2 c) shows that the majority of sam-ples segregate into the two groups corresponding essentially
to the EATL subtypes, indicating robust differences in gene expression levels between the two subtypes. Based on these findings, we performed supervised differential expression analysis using the clinically derived labels of type I and type II. Fig. 2 d shows the genes that were at least 1.5-fold differen-tially expressed between the two types, with a false discovery rate of less than 0.1. Some notable genes with higher ex-pression in the type I cases, compared with type II, included STAT3, STAT5A, IRF1, and IRF4. The genes FAS LG, SYK, and TGBR1 were found to be more highly expressed in type II EATL than in type I. Transglutaminase 2 (TGM2) is an im-portant enzyme and autoantigen in celiac disease (Dieterich et al., 1997), which we found to be expressed at higher levels in the type I cases than in type II cases. NCAM1, also known as CD56, was expressed higher in type II EATL, consistent with the use of CD56 staining as a diagnostic feature of type II EATL. We did not find MYC to be differentially expressed, despite the higher proportion of chromosome 8q amplifica-tions in type II. The full list of differentially expressed genes is included in Table S6.
Fig. 2 e depicts the heat map of the differentially ex-pressed genes in the 29 EATL samples, along with HLA genotype and celiac disease status. With a false discovery rate (FDR) <0.1 and a fold change of at least 1.5× in either direc-tion, 380 genes are higher in type II and 198 genes are higher in type I. The cluster assignment, based on consensus K-means clustering of the differentially expressed genes, was found to track very closely with the original clinical EATL subtype.
Gene set enrichment of the differentially expressed genes revealed significant overexpression of the interferon-γ signaling pathway (P < 0.001; Fig. 2, f and g) in type I EATLs. Genes expressed higher in type II EATL were found to be enriched for the natural killer-like cytotoxicity pathway (P = 0.02; Fig. 2, h and i). Both interferon-γ signaling and nat-ural killer–like cytotoxicity (Meresse et al., 2006) are known functions of intraepithelial lymphocytes (IELs), which are the presumed cell of origin for EATLs (Ebert, 1990; Taguchi et al., 1991; Ishikawa et al., 1993; Kagnoff, 1998; Corazza et al., 2000). Increased interferon-γ production has been described in patients with untreated celiac disease, consistent with the higher expression of this function in celiac-associated type I EATL (Kagnoff, 1998; Nilsen et al., 1998). Other enriched gene sets of interest included MAPK signaling, up-regulated in type II, consistent with a previous study of high MAPK protein expression in type II (Kikuma et al., 2014).
Thus, the two EATL types are characterized by highly overlapping genetic alterations, as well as robust differ-ences in gene expression.
sam-Table 1. Summary of EAtL clinical characteristics
Parameter All EATL (n = 63) Type I (n = 41) Type II (n = 23)
Number (percentage) of cases
Sex
Male 33 (48) 18 (44) 12 (52)
Female 36 (52) 23 (56) 11 (48)
race
African-American 2 (3) 1 (2) 1 (4)
Caucasian 56 (81) 38 (93) 13 (57)
Asian 10 (14) 1 (2) 9 (39)
Age at diagnosis (yr)
Median (range) 62.0 (36.0–92.0) 64.0 (36–92) 59.0 (39.0–89.0)
celiac disease
Yes 35 (61) 32 (84) 3 (16)
Adherence to gluten-free diet
Yes 15 (36) 15 (44) 0 (0)
HLA type
DQ2/DQ8 49 (71) 36 (88) 10 (43)
tumor location
Small intestine 61 (93) 40 (97) 20 (91)
Size of tumor (cm)
Median (range) 7.0 (1.5–75.0) 8.0 (1.5–75.0) 6.0 (2.0–23.0)
Histopathology
CD3+ 57 (85) 30 (75) 23 (100)
CD4− 50 (91) 29 (91) 18 (95)
CD8+ 31 (46) 15 (37) 15 (68)
CD56+ 19 (33) 2 (5) 17 (85)
t cell receptor
AB 16 (46) 12 (43) 4 (57)
GD 9 (26) 6 (21) 3 (43)
EcoG performance score
0–1 20 (48) 14 (50) 6 (43)
2–4 22 (52) 14 (50 8 (57)
Ann Arbor stage
I 17 (40) 10 (36) 7 (47)
II 18 (42) 14 (50) 4 (27)
III–IV 8 (19) 4 (14) 4 (27)
High LdH
High LDH 31 (89) 21 (88) 10 (91)
B symptoms
Yes 27 (59) 19 (63) 7 (47)
Small bowel perforation
Yes 33 (57) 22 (58) 11 (55)
number of nodal sites
0 23 (48) 14 (48) 9 (56)
1 or more 15 (52) 15 (52) 7 (44)
Bone marrow involvement
No 32 (89) 20 (91) 12 (92)
treatment type
Curative 32 (64) 19 (58) 12 (75)
Minimal 18 (36) 14 (42) 4 (25)
response to initial treatment
CR 22 (63) 15 (71) 7 (50)
PR 5 (14) 3 (14) 2 (14)
NR 8 (23) 3 (14) 5 (36)
Progression or relapse
No 8 (24) 6 (32) 2 (14)
Yes 25 (76) 13 (68) 12 (86)
Survival
Median overall survival 10 mo 9 mo 11 mo
1-yr survival rate 44% 41% 50%
ples. However, we did not find significant evidence within this dataset for T cell subsets that specifically resembled either type I or type II EATLs. More specific profiling data will be needed in future studies to fully answer the question of pre-cise cell of origin for these EATL subtypes.
SEtd2 is frequently mutated in EAtL and plays a role in t cell development in vivo
Our mutation analysis in EATL tumors showed the histone lysine methyltransferase SETD2 to be the most frequently mutated gene in the disease (22 of 69 cases). The recurrent nonsense mutations and frameshift insertions and deletions (41% of SETD2 mutated cases) suggest that the role of mu-tations in this gene in EATL is likely to be loss of function. Further, nine EATL cases had multiple mutations in SETD2, further supporting its role as a tumor suppressor in EATL. SETD2 has also been implicated as a driver gene with loss-of-function mutations in other malignancies, including clear cell renal carcinoma (Dalgliesh et al., 2010), DLB CL (Zhang et al., 2013), and acute leukemia (Zhu et al., 2014).
SETD2 is a histone lysine methyltransferase responsible for trimethylation of lysine 36 on histone 3 (H3K36me3), which is an epigenetic marker for active transcription. Its interactions with RNA polymerase II during transcription occur through the SRI domain (Kizer et al., 2005).
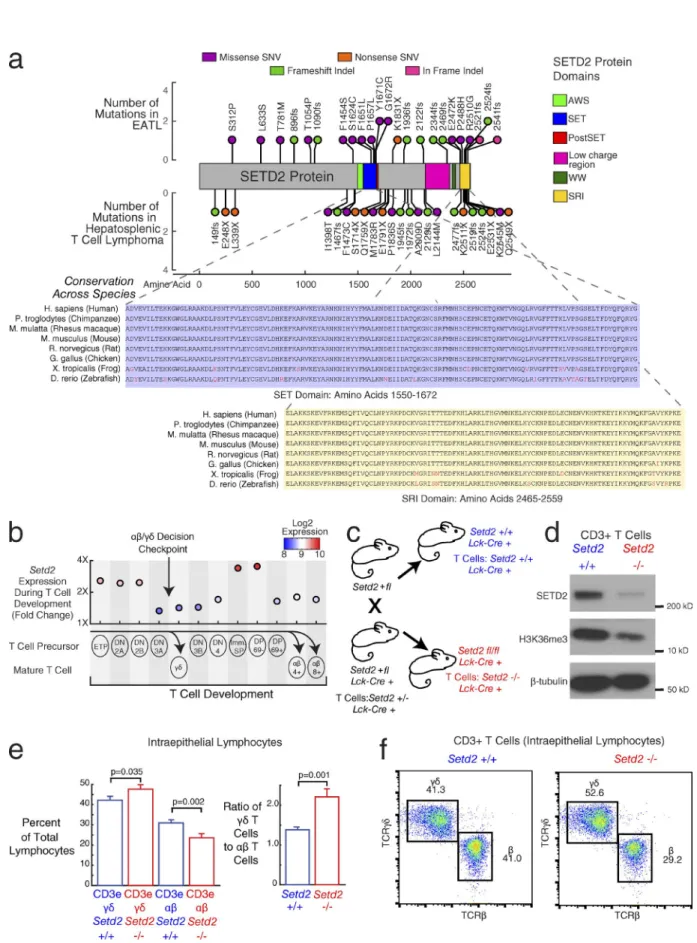
The distribution of mutations in SETD2 in our EATL cases is shown in Fig. 3 a (top). In a separate study examining the genetics of HSTL, a PTCL that arises predominantly from γδ T cells (McKinney et al., 2017), we also found SETD2 to be the most frequently silenced gene. For comparison, the distribution of mutations that we found in HSTL (McKin-ney et al., 2017) are also shown in Fig. 3 a (bottom). This distribution of mutations in both lymphomas appears similar. SETD2 mutations in EATL were found to cluster within the SET domain, responsible for the methyltransferase activity of SETD2. In both EATL and HSTL, mutations cluster in the SRI domain, responsible for the interaction with RNA polymerase II. Both the SET and SRI domains have highly conserved amino acid sequences, as shown in Fig. 3 a. The missense mutations in SETD2 may thus to serve to
effec-tively disrupt the essential functions of SETD2 by altering these protein domains.
Given that both HSTLs and EATLs arise disproportion-ately from γδ T cells and that γδ T cell expansion has been re-ported in patients with untreated celiac disease (Kagnoff, 1998; Nilsen et al., 1998), we further investigated a potential role for SETD2 in T cell development. We began by examining gene expression patterns throughout the mouse T cell lineage from early T cell precursors to early double negative (DN) to double positive (DP) and finally to the αβ or γδ T cell subsets (Heng et al., 2008; Fig. 3 b). The decision checkpoint for the αβ versus γδ split occurs at the DN3 stage (Carpenter and Bosselut, 2010; Kreslavsky et al., 2010). We found that Setd2 is selectively up-regulated during the transition from early DN to DP T cells. Setd2 expression is then down-regulated by DP CD69pos T cells on their way to becoming αβ T cells. These
results indicate that Setd2 up-regulation in the immature DP CD69neg stages is a critical step in confirming the αβ T cell
lineage choice, and we hypothesized that the absence of Setd2 up-regulation might favor the development of γδ T cells.
We further investigated the in vivo role of SETD2 in T cell development by breeding Setd2 conditional knockout mice with Lck-Cre transgenic mice, in which expression of Cre is restricted to the T cell lineage (Pan et al., 2002). The breeding scheme led to progeny whose T cells were either Setd2 wild-type, heterozygous, or deleted (Fig. 3 c shows the final cross and the mice selected for analysis). We then com-pared T cell populations in young adult mice whose T cells were either wild-type or deleted for Setd2.
We first confirmed the loss of SETD2 protein in T cells from Setd2fl/fl;Lck-Cre+ mice. Protein lysates were
made from splenic CD3epos T cells and analyzed by
immu-noblot. As shown in Fig. 3 d, there is a significant reduction in SETD2 protein in T cells isolated from Setd2fl/fl;Lck-Cre+
mice compared with Setd2+/+;Lck-Cre+ mice. We also
ob-served a corresponding decrease in H3K36me3, indicating a reduction of the histone methyltransferase activity in T cells lacking SETD2 protein.
We then assessed the effect of Setd2 loss upon T cell populations by dissecting IELs and gut-associated lymphoid
tissue (Peyer’s patches) from these mice and evaluating T cell markers by flow cytometry. The flow cytometry gating schemes for analysis and sorting are shown in Fig. S2 (a–g) for IELs. In IELs from Setd2 wild type mice, CD3epos T cells
ranged from 40% to 80% of the live cells within the lympho-cyte gate. Typically, TCRγδpos were ∼1.3 times more prevalent
than TCRβpos cells and 90% of both subsets were CD8αpos. In
Peyer’s patches from Setd2 wild-type mice, CD3epos T cells
were ∼25% of the live cells within the lymphocyte gate with TCRβpos outnumbering TCRγδpos cells ∼20 to 1. Although
<25% of the TCRβpos cells were CD8αpos, the majority (60%)
of TCRγδpos cells were CD8αpos.
We compared the proportion of IEL T cells that are CD3epos and TCRγδpos versus CD3epos and TCRβpos in the
Setd2 wild-type and deficient mice (Fig. 3 e) and found a sig-nificant increase in the γδ-positive T cell population (ANO VA F-test, P = 0.035), and a commensurate decrease in the αβ T cell population (ANO VA F-test, P = 0.002), resulting in an increase in the ratio of γδ T cells to αβ T cells from 1.4 to 2.2 (ANO VA F-test, P = 0.001). Fig. 3 f shows repre-sentative flow cytometry plots from Setd2+/+ and Setd2−/− T
cells, which show the shift toward a higher γδ T cell pop-ulation in the Setd2 knockout. An increase in the ratio of TCRγδpos to TCRβpos T cells was also evident in Peyer’s patch
T cells (Fig. S2, h–l).
To further investigate the phenotype of SETD2 loss in IELs, we profiled the gene expression of αβ and γδ sorted IELs, isolated from Setd2+/+ and Setd2−/− T cells.
Fig. S3 a shows the confirmation of the expected deletion of exon 2 of Setd2 from the RNA-sequencing data. Some of the most highly expressed genes in the IELs included Gzma, Gzmb, Ccl5, Txndr1, Rgs1, and B2m (Table S7). We identified the top differentially expressed genes between the αβ and γδ T cells, which included known T cell marker genes such as Cd4, Cd8b1, Icos, and Cd28 as more highly expressed in αβ T cells, and Ctsh, Tgm2, and Ctsh as more
highly expressed in γδ T cells (Fig. S3 b). Genes that differ-entiated Setd2−/− and Setd2+/+ IELs included Lst1, Tcea2,
Bmp7, Klk1, Agr2, and Msrb1 (Fig. S3 c). Interestingly, we found that overall, the genes that had higher gene expres-sion in γδ T cells (fold change >2 compared with αβ T cells), were highly enriched among the genes that increase in the Setd2 knockout (Fig. S3, d and e), supporting the notion that Setd2 loss may favor the development of T cells with a γδ-like phenotype.
No significant difference was found between the two genotypes in overall proportions of CD3epos or the
propor-tion of the TCRβpos or TCRγδpos that are CD8αpos. Table S8
lists the cell counts and proportions from IELs and Peyer’s patches for αβ and γδ T cell populations, as well as a sum-mary of the results for CD3e and CD8α. Setd2 deficient mice did not thus far develop lymphoma at up to 10 mo of age, suggesting that additional collaborating genetic events are needed for oncogenic transformation.
Collectively, these data point to a novel role for SETD2 in T cell development and suggest that SETD2 loss may favor the development of γδ T cells.
dIScuSSIon
EATL is an uncommon but lethal disease. In this study, we have assembled one of the largest cohorts of patients with EATL to define the genetic underpinnings of the disease. Our work defines many previously unknown mutational drivers of the disease, including chromatin modifiers, DNA damage– related genes, and activated signaling pathways. Our results show that SETD2 is the most frequently silenced gene in this disease, revealing the importance of loss of function of SETD2, as well as other epigenetic modifiers in general in the oncogenesis of EATL. Our data also suggest the JAK-STAT signaling pathway as an immediate therapeutic target in the disease, with over half of the EATL patients manifesting mu-tations in this pathway.
post-SET domain; pink, low-charge region; dark green, WW domain; yellow, SRI [Set2 Rpbl-interacting] domain). (Bottom) Conservation of SET (blue) and SRI (yellow) domain amino acid sequences. Nonconserved amino acids are colored in red. (b) Setd2 expression during T cell development. Labeled circles indicate different stages of T cell development. Corresponding scatterplot shows mouse gene expression (fourfold range) during development, with circles colored by expression. Values represent mean expression from two to three samples per group (34 total samples). αβ T cells differentiate from the DP early T cells, whereas γδ T cell differentiate from the DN3 stage of early T cell. Stages: early T precursor (ETP), DN2A, DN2B, DN3A, DN3B, DN4, immature single positive (Imm. SP), DP CD69−(DP 69−), DP CD69+ (DP 69+), γδ T cell (γδ), αβ CD4+ T cell (αβ 4+), αβ CD8+ T cell (αβ 8+). (c) Mouse breeding diagram. The final cross is between a heterozygous knockout Setd2+/fl mouse and a heterozygous knockout Setd2+/fl mouse with Cre transgene under the control of the T cell– specific Lck promoter (Lck-Cre+). The progeny mice that are used for downstream experiments are the wild-type Setd2 (+/+, blue) and null Setd2 (−/− in T cells, red), both with one copy of the Lck-Cre transgene. (d) Western blot in CD3+ splenic T cells from the Setd2 wild-type mouse (left) and Setd2-null mouse (right). (Top) SETD2 protein, (middle) H3K36 trimethylation, (bottom) β-tubulin control. Blot is representative of three experimental replicates. (e) Bar graph showing the quantification of CD3epos and TCRγδpos or CD3epos and TCRβpos T cell populations within IELs. Blue bars show populations from the Setd2+/+ wild-type T cells. Red bars show populations from the Setd2−/−null T cells. (Left) Left bars show γδ T cell receptor expressing populations, and right bars
show αβ T cell receptor expressing populations. (Right) Ratio of γδ T cells to αβ T cells in Setd2+/+ T cells versus Setd2−/−T cells. Error bars show standard
The classification and naming of EATL and its subtypes have been debated extensively (Chan et al., 2011; Tse et al., 2012; Nairismägi et al., 2016; Roberti et al., 2016). The clas-sification schemes developed thus far largely rely on mor-phological distinctions and limited immunophenotyping and copy-number data. Next-generation sequencing provides a powerful tool for systematically defining the genetic differ-ences between the subtypes. Interestingly, we observed that the types of EATL demonstrate highly convergent genetics in the face of divergent gene expression. These findings sug-gest that the two subtypes of EATL have potentially different cellular phenotypes that nevertheless follow similar genetic pathways to the development of EATL.
Knowing when to reclassify a disease is difficult, partic-ularly in a rare entity such as EATL. There are many potential benefits of increasing the resolution of diagnosis, including the ability to define the basis of distinct clinical outcomes, as well as the ability to identify distinct aspects of biology. However, such fragmentation of the disease landscape can also pose challenges in trying to perform clinical trials and trying to improve clinical outcomes, particularly in uncommon dis-eases such as EATL, where the described subtypes have similar outcomes and distribution of therapeutically targetable mu-tations. DNA and RNA sequencing provides the basis for a data-driven approach to disease classification. It appears inev-itable that such data will inform future classification schemes. SETD2 is the most frequently silenced gene in EATL. T cell development involves the concerted action of many different genes at well-defined stages of development. Expres-sion analysis in mouse data indicates that Setd2 is selectively down-regulated in the steps that are critical precursors of γδ T cells and an up-regulation of Setd2 is a feature of precur-sors of αβ T cells. SETD2 loss in mice is associated with an expansion of γδ T cells, suggesting a novel role for SETD2 in T cell development, in addition to its other described roles in oncogenesis (Dalgliesh et al., 2010; Zhu et al., 2014). Inter-estingly, a known hallmark of celiac disease is an increase in the proportion of γδ T cells (Kagnoff, 1998). The lack of lym-phoma development in Setd2 knockout mice suggests that the development of EATL requires the activation of other collaborating genetic events. More work is needed to fully define the role of SETD2 in the oncogenesis of EATL and other peripheral T cell lymphomas, such as HSTL, where it is also highly mutated.
This work defines the complete mutational, co-py-number, and transcriptomic landscape of EATL genetics in one of the largest studies in this disease to date. Our in vivo experiments support a role for SETD2 loss in T cell develop-ment and lay the groundwork for future investigation into the role of this driver gene in T cell lymphomas.
MAtErIALS And MEtHodS Study design and sample selection
EATL tumors and normal tissues were obtained from institu-tions that constitute the Hematologic Malignancies Research
Consortium (Jima et al., 2010). Tumor samples were derived from FFPE tissues, and normal samples were from unaffected bone marrow, when available. Archival patient tumor and normal samples, as well as clinical data, were collected ac-cording to a protocol approved by the Duke University In-stitutional Review Board, which was exempt from informed consent, and in accordance with the Declaration of Helsinki.
Exome sequencing and derivation of genomic data
In brief, genomic DNA was sheared to 250 bp and size/con-centration were verified using Bioanalyzer (Agilent Technol-ogies). Sheared DNA was end-repaired, A-tailed, and ligated to Illumina paired-end adapters. The resulting libraries were amplified using Illumina PE specific primers. Samples were column purified and the size and quantity of the final librar-ies was determined using Bioanalyzer. The resulting librarlibrar-ies were then hybridized overnight to DNA baits provided in the SureSelect Human All Exon 50 MB kit (Agilent Technolo-gies). The captured libraries were amplified and sequenced on Illumina Hiseq (Table S9).
rnA-sequencing library preparation for tumors
RNA was extracted and assessed for quality using the Bioana-lyzer RNA Pico chip. Ribosomal RNA (rRNA) was depleted using a custom RNaseH method similar to other published methods (Morlan et al., 2012; Adiconis et al., 2013). 1 µg total RNA was hybridized with 1 µg of a custom DNA oligo mix tiling the 18s, 28s, 5.8s and mitochondrial rRNA sequences (Table S10). Each sample was then RNaseH treated to de-grade complementary rRNA sequence and DNase treated to degrade the DNA oligo mix. The remaining rRNA-depleted samples were then purified using the RNeasy Mini kit as directed (QIA GEN). The Kapa Stranded RNA-Seq kit was used to generate stranded Illumina sequencing libraries (Kapa Biosystems). In brief, RNA was hybridized to random prim-ers, followed by first-strand cDNA synthesis, second-strand cDNA synthesis with marking, A-tailing, ligation of Illumina paired-end adapters with 8-bp barcodes, and nine cycles of PCR amplification. Reactions were purified with Agencourt AMPure XP beads where necessary. Paired-end, library- prepared RNA was captured using SureSelect Exome V6+UTR capture baits from Agilent Technologies (Cieslik et al., 2015). The quality and quantity of the final captured libraries were assessed using the Bioanalyzer. Libraries were multiplexed in equimolar amounts and sequenced as paired-end 50-bp (100-bp) reads on an Illumina HiSeq Sequencing System.
Exome sequencing alignment
Wheeler Aligner version 0.7.7 (BWA mem –M –p; Li and Durbin, 2010). Output was converted to BAM format with SAMtools (Li et al., 2009) version 0.1.19. All alignments were output as BAM files and merged using Picard version 1.96 (http ://picard .sourceforge .net). PCR/optical duplicates were marked by Picard. Base quality recalibration was performed using GATK to generate a more accurate base quality score that takes into account its reported quality score in the original FAS TQ file, position within the read, and sequence context, for example AC and TG dinucleotides. To improve accuracy and quality of alignment, localized indel realignments were performed using GATK, which infers the consensus indel call from multiple reads mapping to suspected indel genomic regions, rather than considering each read independently. Regions that should be realigned are determined by the GATK Realigner Target Creator.
Variant calling and annotation
SAMtools (Li et al., 2009) mpileup with settings “-C50 -m3 -F0.0002” was run on all cases and output to a single VCF file. The mpileup settings do the following: “-C50” limits the contribution of reads with many mismatches, and “-m3 – F0.0002” is used to maximize sensitivity to indel discovery by requiring three supporting reads at a minimum of 0.02% abun-dance, rather than the default abundance cutoff of 0.2%. Each variant was required to have an instance of genotype quality >30 and read depth >5. For all samples for which paired nor-mal DNA was available, MuTect version 1.1.7 (Cibulskis et al., 2013) was used to detect truly somatic variants, which are absent in the normal germline DNA (tumor LOD score cutoff set to 4.5 for increased sensitivity). MuTect was also run on all human tumor exome samples to take advantage of the increased sensitivity for low allelic fraction variants. Mu-Tect called variants were merged with mpileup variants for downstream processing. Individual single nucleotide variants (SNVs) and indels from human exomes were annotated with gene names, predicted function, population frequencies, and other variant annotations using Annovar (Wang et al., 2010), which takes as input genomic coordinates and variants, and outputs alteration (amino acid change, frameshift, stop gained, etc.), scores from various predictors, including SIFT (Sim et al., 2012), Polyphen-2 (Adzhubei et al., 2013), and CADD (Kircher et al., 2014), as well as any observed frequencies in the NHL BI 6500 Exomes Sequencing Project and dbSNP.
Variant filtering and the identification of EAtL driver genes The first round of variant filtering required variants to be
absent from control populations (NHL BI 6500 Exomes
Sequencing Project, in-house normal exomes, and EATL paired normals). We also required variants to have a frequency within the EATL dataset <30% for SNVs and <5% for in-dels (to eliminate obvious alignment artifacts) and to not have missing data in >50% of the samples. Highly recurrent SNVs required outside support from COS MIC and/or the literature. Furthermore, variants were filtered out that lie in
genomic regions with high duplication scores. Finally, the variant had to have an alternate allele read depth of at least 3, total read depth of at least 5, and an allele frequency of at least 5% in one sample. Next, we formed our discovery gene set using all genes implicated with at least two somatic events in our paired cases, as shown in the separation of discovery and validation sets in Fig. 1. Within these genes, we required these genes to be expressed in T cells (FPKM >1) and to not be overly variable in the normal population (restrictions on number of variants in the 6500 exome project and number of variants over gene size). Most importantly, to identify EATL driver genes, we required genes to have at least 3 not-synon-ymous events across at least 4 cases out of the highly filtered variants. Additional steps to identify drivers involved requir-ing a high proportion of identified variants in a gene to have high CADD scores and be completely absent in population databases and for the gene to have a high ratio of not-synon-ymous to synonnot-synon-ymous events.
Mutual exclusion testing
Mutations in final driver gene list (excluding synonymous) were tested for mutual exclusion using the weighted row ex-clusivity test, using the Saddlepoint approximation for p-value (Leiserson et al., 2016). Sets of three and four genes were tested for mutual exclusion. Within the significant sets of four genes, the presence of all gene pairs in these sets was counted.
Arm-level copy-number calling
increase/decrease in the tumor/normal ratio, equivalent to one copy gained or lost in a 10% pure tumor, as the minimum. Again, arms that are significant in any of the normal samples are removed. GIS TIC runs were repeated with only type I or only type II samples separately, and alterations with significant q-values in those runs were also included.
Allele frequency and cancer cell fraction analysis
Purity estimates are taken as the maximum of the copy num-ber based estimate from the driver copy-numnum-ber alterations reported and the mutation allele frequency based estimate from the driver gene mutations reported. Allele frequencies are corrected for purity and assumed to be from heterozygous mutations to calculate cancer cell fraction. Only mutations with at least five reads are included in the analysis.
HLA genotyping
HLA genotyping was performed using EATL tumor and nor-mal exome sequencing FAS TQs and the PHL AT algorithm (Bai et al., 2014). The PHL AT python package was run using Python 2.7 and Bowtie2 (2.1.0). When possible, tumor and normal FAS TQs were merged for analysis because the HLA genotype that we are interested in is the germline genotype. Tumor and normals were also assessed separately and were found to have a high degree of concordance. Table S4 shows the genotypes for DQA1 and DQB1, the two genes most rel-evant for establishing the celiac disease-associated HLA type, as well as the serotype groups for DQA1 and DQB1.
rnA-sequencing alignment and expression quantification RNA-sequencing reads were first trimmed for removal of adapter sequences and low-quality bases with Trimmomatic (Bolger et al., 2014; version 0.32; adapters: 2:20:7:1:true, lead-ing: 5, traillead-ing: 5, slidingwindow: 4:10, minlen: 21). Next reads were aligned with Bowtie2 (Langmead and Salzberg, 2012; version 2.1.0, with local alignment) against a custom rRNA reference built by searching the NCBI nucleotide database for Homo sapiens rRNA, rRNA molecule type (or Mus muscu-lus). Remaining reads were aligned with Tophat (Trapnell et al., 2012; version 2.0.9) to the hg19 transcriptome (Ensembl v74), with remaining reads aligned to the hg19 genome (or mm10 equivalents for mouse data). Expression quantifica-tion was done using Cuffquant and Cuffnorm (Trapnell et al., 2012; version 2.2.0, cuffquant –u –b). FPKM values from Cuffnorm were used in downstream analysis.
differential expression and gene set enrichment analysis Samples were filtered for quality, and genes that had a median expression greater than 0 in the dataset were used for further analysis. An additional step of quantile normalization was applied to the filtered dataset. Differentially expressed genes were identified using Student’s t test and fold change (FDR <0.1, fold change > 1.5×). Principal-component analysis, volcano plots, and differential expression tests were all performed using Matlab (R2016a). Gene set
enrichment was run as a hypergeometric test comparing each gene set to the list of differentially expressed genes between type I and type II EATL. The MSigDB Hallmark,
KEGG, and REA CTO ME gene set lists were used for
comparison. Ranked list gene set enrichment using GSEA (Subramanian et al., 2007) was also run using the same gene sets. Enrichment plots across the ranked list are generated using the GSEA software and gseapy (http ://pydigger .com /pypi /gseapy). FDR correction is done for both differential expression and gene set enrichment according to the Benjamini–Hochberg method.
comparison of EAtL tumors to t cell subsets
EATL tumor RNA-sequencing samples were compared with the T cell subset gene expression data from the Immunolog-ical Genome Project (Heng et al., 2008). All T cells samples available from unmodified C57BL/6 mice were used for comparison. Datasets were filtered to common genes. Pearson correlations were computed for each EATL tumor against each T cell sample. T cell samples are then ranked by mean correlation across the EATL tumors.
Statistics
The log-rank test was used to test significance in survival associations with clinical covariates. Survival curves were drawn using the Kaplan–Meier method. Differentially ex-pressed genes were selected as those with at least 1.5-fold difference between the two groups and an FDR (q-value) <0.1 (Benjamini–Hochberg FDR correction after Student’s t test.) Principal-component analysis was run using the pca command in Matlab R2016a. Gene set enrichment analysis was run using the hallmark gene sets from MSigDB, Re-actome, and KEGG gene sets. A two-way ANO VA model was used to compare T cell population percentages between wild-type and knockout mice while controlling for ex-perimental batch effect.
Mouse strains
Mice were housed in a Duke University Medical Center Division of Laboratory Animal Resources facility and ex-periments approved by the Duke University and Medical Center Animal Care and Use Committee. The Setd2 con-ditional knockout mouse line designated C57BL/6N-Set-d2<tm1c(NCOM)Mfgc>/Tcp was made as part of the NorCOMM2 project with C57BL/6NSetd2<tm1a(N-COM)Mfgc>/Tcp made from NorCOMM ES cells at the Toronto Centre for Phenogenomics. The line was made available to us through the Canadian Mouse Mutant Re-pository. The Lck-Cre transgenic strain for T cell–spe-cific CRE expression was provided by Y. Zhuang (Duke University, Durham, NC; Pan et al., 2002). For the eval-uation of SETD2 function in T cells, Setd2+/fl mice were
crossed to Setd2+/fl; Lck-Cre+ mice. The progeny of such
Mouse genotyping
Genotyping was performed on tail-snip DNA using the QIA GEN HotStarTaq master mix. The Setd2 alleles were iden-tified using primers 5′-TAG CTG TGC TTG AGT TGC CAC
AGA GC-3′ and 5′-TCC TGA AGC TGG TGC AAA CCA
CTA GG-3′ and an annealing temperature of 60°C. The wild-type allele produced a 571-bp product, whereas the floxed allele produced a 665-bp product. The Lck-Cre transgene was identified using primers 5′-GCA GGA AGT GGG TAA CTA
GAC TAAC-3′ and 5′-TCT CCC ACC GTC AGT ACG TGA
GAT ATC-3′ and an annealing temperature of 55°C. Presence of the transgene was indicated by a 750-bp product.
Mouse dissection and isolation of lymphocytes
Mouse Peyer’s patches and IELs were harvested in RPMI-1640 medium containing 10% (vol/vol) FBS. Single-cell suspensions of Peyer’s patch lymphocytes were made by squeezing dissected Peyer’s patches between ground glass slides. IELs were isolated from dissected, washed, and inverted small intestinal fragments using a DTT-based extraction me-dium and sequential filtration steps. The detailed protocol is as follows: We modeled our isolation of IELs on the protocol by Couter and Surana (2016). Just before mouse dissection, IEL extraction media was prepared for each mouse (30 ml RPMI supplemented with 60 µl 0.5 M EDTA and 500 µl FBS). The extraction medium was placed into a 125-ml plas-tic culture flask and warmed to 37°C in a tissue culture in-cubator. Freshly prepared DTT (93 µl 5% wt/vol in dH2O)
was added immediately to each flask before addition of in-testinal segments. The mouse was euthanized and an incision made to expose the gut contents. The small intestine was sep-arated from the stomach by transection of the pyloric sphinc-ter with scissors. The small intestine was removed from the peritoneum and mesenteric fat teased away. A second cut was made at the ileocecal junction. The isolated small intestine was rinsed and stored when not being manipulated in ice-cold RPMI/10% FBS to maximize cell viability. The small intestine was manipulated on paper towels moistened with RPMI/10% FBS. All the Peyer’s patches were excised from the surface of the small intestine, placed in cold RPMI/10% FBS, and a single-cell suspension made by squeezing the tis-sue between ground glass slides (Micro Slides; Corning) and filtering the suspension through 70 µm cell strainers (Falcon). Red blood cells were lysed and remaining Peyer’s patch cells were washed twice with PBS/2% FBS before flow cytom-etry. Upon removal of Peyer’s patches, the central third of the small intestine was selected to be the source of IELs and remaining fat thoroughly and gently removed using curved forceps. The intestinal segment was then subdivided into three or four 1.5–2-in segments. Intestinal contents were re-moved by gently flushing the segments with 15–20 ml cold PBS using a butterfly needle affixed to a syringe. Each seg-ment was inverted by cannulating the segseg-ment with curved forceps, grasping the distal end of the tissue, using a needle to pass the end of gut into the forceps and finally pulling the
forceps back out to invert the segment of gut. The segments were rinsed and stored in cold RPMI/10% FBS before being transferred into the culture flasks with prewarmed extraction medium. The flasks were shaken at 400 rpm for 15 min at 37°C. After incubation, a steel tea strainer was used to separate tissue pieces from the IELs contained in the cloudy filtrate. The filtrate was then put through a 100-µm cell strainer into a 50-ml conical tube, and for better recovery, the filter was rinsed with 20 ml RPMI/10% FBS. The solution was centri-fuged at 500 g for 10 min at 4°C. The supernate was carefully decanted, and the pellet resuspended in 5 ml RPMI contain-ing 10% FBS. The resuspended cells were filtered through a 40-µm filter, the filter rinsed with 15 ml RPMI/10% FBS, and the filtrate centrifuged again at 500 g for 10 min at 4°C. The supernate was carefully decanted and the pellet resus-pended in 5 ml RPMI containing 10% FBS. The IELs were counted in Trypan blue with a yield of 15–50 million cells/ animal with ∼70% viability.
Western blotting
Mouse splenic CD3pos T cells were isolated by filtering
sus-pended spleen cells through a 70-µM cell strainer, exposed to RBC lysis buffer, and washed twice with PBS with 0.5% BSA. CD3e+ spleen T cells were then positively selected for
by cell surface staining with CD3e PE-Cy5.5 antibodies and MACs microbeads passed through LS columns (Miltenyi Biotech) according to the manufacturer’s protocols. For each sample, 5 × 10⁶ cells were washed once in ice cold PBS and
lysed in 150 microliters RIPA buffer (Sigma-Aldrich) with protease, phosphatase inhibitors (Roche), and 2 mM EDTA. Crude lysates were sonicated at 10% duty cycle, intensity 4, 200 cycles/burst on a Covaris S-series device then centri-fuged at 13,000 g for 10 min, and supernatants were used for downstream experiments. 10–30 µg of protein were separated on 4–18% Bis-Tris gradient gels and transferred overnight to Immobilion PVDF membranes (EMD Millipore) in Tris- glycine buffer with 20% methanol at 30 V. Primary antibodies (anti-SETD2, anti-H3K36me3, and anti–β tubulin; Cell Sig-naling Technology) were diluted 1:1,000 in 5% BSA/TBS-T and bound overnight followed by washing and binding of HRP-conjugated anti–rabbit antibody (Santa Cruz Biotech-nology, Inc.). Blots were developed using SuperSignal Pico chemiluminescent substrate (Thermo Fisher Scientific).
Flow cytometry
For the analysis of T cell populations, IEL preparations, and Peyer’s patch cells were blocked using CD16/32 then incu-bated with antibodies to surface antigens for 20 min at 4°C. Cells were washed twice, resuspended in PBS/2% FBS, and analyzed by flow cytometry using a Sony LE-SH800 flow cy-tometer and cell sorter. Identification of TCR γδpos and TCR
βpos cells was based on the staining and gating strategy
illus-trated in Fig. S2. Cells are within the lymphocyte gate, singlets, viable, and CD3eposTCRγδpos or CD3eposTCRβpos.
(145-2C11; BioLegend), PE-conjugated anti-CD8a (53-6.7;
BD Biosciences), APC-conjugated anti-TCR β (H57-597;
BioLegend), and PE/Cy7 anti-TCR γδ (GL3; BioLegend)
with Zombie Green (BioLegend) used to identify viable cells.
Flow cytometry analysis
Flow data from Peyer’s patch samples were collected from nine experiments, and flow data from IEL preparation samples were collected from five experiments. Samples for each tissue were combined for analysis in FlowJo to standardize the gates. In the case of the Peyer’s patches, samples were excluded if less than 70% of the total cells in the forward versus side scat-ter plot fell within the lymphocyte gate; this was to prevent incorporation of samples with significant IEL contamination caused by the incorporation of excessive gut wall tissue in the dissection. In the case of IEL preparations, samples were ex-cluded if less than 5% of total cells in the forward versus side scatter plot fell within the lymphocyte gate; this effectively excluded samples with poor retrieval of viable lymphocytes.
rnA-sequencing library preparation for IELs
αβ and γδ IELs were isolated from the intestinal epithelium by sorting during flow cytometry as described. The purified IELs were then pelleted and lysed using RNA Lysis Buffer (Zymo). Total RNA was isolated using the Zymo Quick-RNA Mi-croPrep kit per manufacturer’s instructions. RNA sequenc-ing libraries were then created ussequenc-ing the KAPA Stranded mRNA-Seq kit (Kapa Biosystems). In brief, mRNA was se-lected with poly-T beads, mRNA was fragmented and hy-bridized to random primers, followed by first-strand cDNA synthesis, second-strand cDNA synthesis with marking, A-tailing, ligation of Illumina paired-end adapters with 8-bp barcodes, and 12 cycles of PCR amplification. Reactions were purified with Agencourt AMPure XP beads where necessary. Samples were then sequenced as paired-end 75-bp (150-bp) libraries on the Illumina MiSeq Sequencing System.
data availability
Primary sequence data are available at the European Genome- phenome Archive under accession no. EGAS00001001954.
online supplemental material
Fig. S1 shows mutually exclusive gene sets, cancer cell fraction for driver genes, and exploratory Kaplan-Meier plots for clin-ical and molecular covariates (related to Fig. 1). Fig. S2 shows the flow cytometry scheme for sorting and quantifying T cell populations from the Setd2 wild-type and knockout mice in IELs and the proportions of T cells in Setd2 wild-type and knockout mice for Peyer’s patches (related to Fig. 3). Fig. S3 shows the RNA-sequencing analysis of IELs (related to Fig. 3). Tables S1–S10 are available as tabs in an Excel file. Table S1 lists the variants in EATL significantly mutated genes. Table S2 lists the mutual exclusion sets. Table S3 lists the copy-number alter-ations in EATL. Table S4 lists the HLA genotypes for DQA1 and DQB1 genes. Table S5 lists the clinical and pathological
features of the EATL cases. Table S6 lists the differentially ex-pressed genes between type I and type II. Table S7 lists the RNA sequencing gene expression for the IELs. Table S8 lists the in-dividual T cell proportions for IELs and Peyer’s patches. Table S9 lists the summary statistics for exome and RNA sequencing. Table S10 lists the oligo sequences used for rRNA depletion.
AcKnoWLEdGMEntS
A.B. Moffit was funded by a Hertz Foundation Graduate Fellowship and National Science Foundation Graduate Fellowship. This work was partly funded through the National Institutes of Health.
The authors declare no competing financial interests.
Author contributions: A.B. Moffit, M. McKinney, R.E. Rempel, and S.S. Dave wrote the paper; M. McKinney, R.E. Rempel, N.S. Davis, E.C. Smith, B.C. Paulus, T.J. Tzeng, J.A. Healy, and C. Love performed experiments; A.B. Moffit, D. Rajagopalan, and J. Datta performed analysis; S.L. Ondrejka, J.R. Goodlad, C.H. Teh, S. Leppa, S. Man-nisto, P.E. Kovanen, E. Tse, R.K.H. Au-Yeung, Y.-L. Kwong, G. Srivastava, J. Iqbal, J. Yu, K. Naresh, D. Villa, R.D. Gascoyne, J. Said, M.B. Czader, A. Chadburn, K.L. Richards, P.L. Lugar, and E.D. Hsi contributed samples and clinical data; Y. Zhuang provided mice; and S. Levy, D.B. Dunson, Y. Zhuang, E.D. Hsi, and S.S. Dave advised research.
Submitted: 10 June 2016 Revised: 6 February 2017 Accepted: 2 March 2017
rEFErEncES
Adiconis, X., D. Borges-Rivera, R. Satija, D.S. DeLuca, M.A. Busby, A.M. Berlin, A. Sivachenko, D.A. Thompson, A. Wysoker, T. Fennell, et al. 2013. Comparative analysis of RNA sequencing methods for degraded or low-input samples. Nat. Methods. 10:623–629. http ://dx .doi .org /10 .1038 / nmeth .2483
Adzhubei, I., D.M. Jordan, and S.R. Sunyaev. 2013. Predicting functional ef-fect of human missense mutations using PolyPhen-2. Curr. Protoc. Hum. Genet. Chapter 7:20.
Arps, D.P., and L.B. Smith. 2013. Classic versus type II enteropathy-associated T-cell lymphoma: Diagnostic considerations. Arch. Pathol. Lab. Med.
137:1227–1231. http ://dx .doi .org /10 .5858 /arpa .2013 -0242 -CR Bai, Y., M. Ni, B. Cooper, Y. Wei, and W. Fury. 2014. Inference of high
resolution HLA types using genome-wide RNA or DNA sequencing reads. BMC Genomics. 15:325. http ://dx .doi .org /10 .1186 /1471 -2164 -15 -325
Belhadj, K., F. Reyes, J.-P. Farcet, H. Tilly, C. Bastard, R. Angonin, E. Deconinck, F. Charlotte, V. Leblond, E. Labouyrie, et al. 2003. Hepatosplenic γδ T-cell lymphoma is a rare clinicopathologic entity with poor outcome: Report on a series of 21 patients. Blood. 102:4261–4269. http ://dx .doi .org /10 .1182 /blood -2003 -05 -1675
Bolger, A.M., M. Lohse, and B. Usadel. 2014. Trimmomatic: A flexible trimmer for Illumina sequence data. Bioinformatics. 30:2114–2120. http ://dx .doi .org /10 .1093 /bioinformatics /btu170
Campo, E., S.H. Swerdlow, N.L. Harris, S. Pileri, H. Stein, and E.S. Jaffe. 2011. The 2008 WHO classification of lymphoid neoplasms and beyond: Evolving concepts and practical applications. Blood. 117:5019–5032. http ://dx .doi .org /10 .1182 /blood -2011 -01 -293050
Carpenter, A.C., and R. Bosselut. 2010. Decision checkpoints in the thymus.
Nat. Immunol. 11:666–673. http ://dx .doi .org /10 .1038 /ni .1887 Chan, J.K., A.C. Chan, W. Cheuk, S.K. Wan, W.K. Lee, Y.H. Lui, and W.K.
Chan. 2011. Type II enteropathy-associated T-cell lymphoma: A distinct aggressive lymphoma with frequent γδ T-cell receptor expression.
Cibulskis, K., M.S. Lawrence, S.L. Carter, A. Sivachenko, D. Jaffe, C. Sougnez, S. Gabriel, M. Meyerson, E.S. Lander, and G. Getz. 2013. Sensitive detection of somatic point mutations in impure and heterogeneous cancer samples. Nat. Biotechnol. 31:213–219. http ://dx .doi .org /10 .1038 /nbt .2514
Cieslik, M., R. Chugh, Y.-M. Wu, M. Wu, C. Brennan, R. Lonigro, F. Su, R. Wang, J. Siddiqui, R. Mehra, et al. 2015. The use of exome capture RNA-seq for highly degraded RNA with application to clinical cancer sequencing. Genome Res. 25:1372–1381. http ://dx .doi .org /10 .1101 /gr .189621 .115
Cock, P.J., C.J. Fields, N. Goto, M.L. Heuer, and P.M. Rice. 2010. The Sanger FAS TQ file format for sequences with quality scores, and the Solexa/ Illumina FAS TQ variants. Nucleic Acids Res. 38:1767–1771. http ://dx .doi .org /10 .1093 /nar /gkp1137
Corazza, N., S. Müller, T. Brunner, D. Kägi, and C. Mueller. 2000. Differential contribution of Fas- and perforin-mediated mechanisms to the cell-mediated cytotoxic activity of naive and in vivo-primed intestinal intraepithelial lymphocytes. J. Immunol. 164:398–403. http ://dx .doi .org /10 .4049 /jimmunol .164 .1 .398
Couter, C.J., and N.K. Surana. 2016. Isolation and flow cytometric characterization of murine small intestinal lymphocytes. J. Vis. Exp.
e54114. http ://dx .doi .org /10 .3791 /54114
Dalgliesh, G.L., K. Furge, C. Greenman, L. Chen, G. Bignell, A. Butler, H. Davies, S. Edkins, C. Hardy, C. Latimer, et al. 2010. Systematic sequencing of renal carcinoma reveals inactivation of histone modifying genes.
Nature. 463:360–363. http ://dx .doi .org /10 .1038 /nature08672 Delabie, J., H. Holte, J.M. Vose, F. Ullrich, E.S. Jaffe, K.J. Savage, J.M. Connors,
L. Rimsza, N.L. Harris, K. Müller-Hermelink, et al. 2011. Enteropathy-associated T-cell lymphoma: Clinical and histological findings from the international peripheral T-cell lymphoma project. Blood. 118:148–155. http ://dx .doi .org /10 .1182 /blood -2011 -02 -335216
deLeeuw, R.J., A. Zettl, E. Klinker, E. Haralambieva, M. Trottier, R. Chari, Y. Ge, R.D. Gascoyne, A. Chott, H.K. Müller-Hermelink, and W.L. Lam. 2007. Whole-genome analysis and HLA genotyping of enteropathy-type T-cell lymphoma reveals 2 distinct lymphoma subtypes. Gastroenterology.
132:1902–1911. http ://dx .doi .org /10 .1053 /j .gastro .2007 .03 .036 Dieterich, W., T. Ehnis, M. Bauer, P. Donner, U. Volta, E.O. Riecken, and
D. Schuppan. 1997. Identification of tissue transglutaminase as the autoantigen of celiac disease. Nat. Med. 3:797–801. http ://dx .doi .org /10 .1038 /nm0797 -797
Ebert, E.C. 1990. Intra-epithelial lymphocytes: Interferon-gamma production and suppressor/cytotoxic activities. Clin. Exp. Immunol. 82:81–85. http ://dx .doi .org /10 .1111 /j .1365 -2249 .1990 .tb05407 .x
Ferreri, A.J., P.L. Zinzani, S. Govi, and S.A. Pileri. 2011. Enteropathy-associated T-cell lymphoma. Crit. Rev. Oncol. Hematol. 79:84–90. http :// dx .doi .org /10 .1016 /j .critrevonc .2010 .06 .006
Heng, T.S.P., M.W. Painter, K. Elpek, V. Lukacs-Kornek, N. Mauermann, S.J. Turley, D. Koller, F.S. Kim, A.J. Wagers, N. Asinovski, et al. Immunological Genome Project Consortium. 2008. The Immunological Genome Project: Networks of gene expression in immune cells. Nat. Immunol.
9:1091–1094. http ://dx .doi .org /10 .1038 /ni1008 -1091
Ishikawa, H., Y. Li, A. Abeliovich, S. Yamamoto, S.H. Kaufmann, and S. Tonegawa. 1993. Cytotoxic and interferon gamma-producing activities of gamma delta T cells in the mouse intestinal epithelium are strain dependent. Proc. Natl. Acad. Sci. USA. 90:8204–8208. http ://dx .doi .org /10 .1073 /pnas .90 .17 .8204
Jima, D.D., J. Zhang, C. Jacobs, K.L. Richards, C.H. Dunphy, W.W. Choi, W.Y. Au, G. Srivastava, M.B. Czader, D.A. Rizzieri, et al. Hematologic Malignancies Research Consortium. 2010. Deep sequencing of the small RNA transcriptome of normal and malignant human B cells identifies hundreds of novel microRNAs. Blood. 116:e118–e127. http ://dx .doi .org /10 .1182 /blood -2010 -05 -285403
Kagnoff, M.F. 1998. Current concepts in mucosal immunity. III. Ontogeny and function of γδ T cells in the intestine. Am. J. Physiol. 274:G455–G458. Kikuma, K., K. Yamada, S. Nakamura, A. Ogami, S. Nimura, M. Hirahashi,
H. Yonemasu, S. Urabe, S. Naito, Y. Matsuki, et al. 2014. Detailed clinicopathological characteristics and possible lymphomagenesis of type II intestinal enteropathy-associated T-cell lymphoma in Japan. Hum. Pathol. 45:1276–1284. http ://dx .doi .org /10 .1016 /j .humpath .2013 .10 .038
Kircher, M., D.M. Witten, P. Jain, B.J. O’Roak, G.M. Cooper, and J. Shendure. 2014. A general framework for estimating the relative pathogenicity of human genetic variants. Nat. Genet. 46:310–315. http ://dx .doi .org /10 .1038 /ng .2892
Kizer, K.O., H.P. Phatnani, Y. Shibata, H. Hall, A.L. Greenleaf, and B.D. Strahl. 2005. A novel domain in Set2 mediates RNA polymerase II interaction and couples histone H3 K36 methylation with transcript elongation.
Mol. Cell. Biol. 25:3305–3316. http ://dx .doi .org /10 .1128 /MCB .25 .8 .3305 -3316 .2005
Ko, Y.H., S. Karnan, K.M. Kim, C.K. Park, E.S. Kang, Y.H. Kim, W.K. Kang, S.J. Kim, W.S. Kim, W.Y. Lee, et al. 2010. Enteropathy-associated T-cell lymphoma—A clinicopathologic and array comparative genomic hybridization study. Hum. Pathol. 41:1231–1237. http ://dx .doi .org /10 .1016 /j .humpath .2009 .11 .020
Kreslavsky, T., M. Gleimer, A.I. Garbe, and H. von Boehmer. 2010. αβ versus
γδ fate choice: counting the T-cell lineages at the branch point. Immunol. Rev. 238:169–181. http ://dx .doi .org /10 .1111 /j .1600 -065X .2010 .00947 .x
Langmead, B., and S.L. Salzberg. 2012. Fast gapped-read alignment with Bowtie 2. Nat. Methods. 9:357–359. http ://dx .doi .org /10 .1038 /nmeth .1923
Leiserson, M.D., M.A. Reyna, and B.J. Raphael. 2016. A weighted exact test for mutually exclusive mutations in cancer. Bioinformatics. 32:i736–i745. http ://dx .doi .org /10 .1093 /bioinformatics /btw462
Li, H., and R. Durbin. 2010. Fast and accurate long-read alignment with Burrows-Wheeler transform. Bioinformatics. 26:589–595. http ://dx .doi .org /10 .1093 /bioinformatics /btp698
Li, H., B. Handsaker, A. Wysoker, T. Fennell, J. Ruan, N. Homer, G. Marth, G. Abecasis, and R. Durbin. 1000 Genome Project Data Processing Subgroup. 2009. The Sequence Alignment/Map format and SAMtools.
Bioinformatics. 25:2078–2079. http ://dx .doi .org /10 .1093 /bioinformatics /btp352
Love, C., Z. Sun, D. Jima, G. Li, J. Zhang, R. Miles, K.L. Richards, C.H. Dunphy, W.W. Choi, G. Srivastava, et al. 2012. The genetic landscape of mutations in Burkitt lymphoma. Nat. Genet. 44:1321–1325. http ://dx .doi .org /10 .1038 /ng .2468
Magi, A., L. Tattini, I. Cifola, R. D’Aurizio, M. Benelli, E. Mangano, C. Battaglia, E. Bonora, A. Kurg, M. Seri, et al. 2013. EXC AVA TOR: Detecting copy number variants from whole-exome sequencing data.
Genome Biol. 14:R120. http ://dx .doi .org /10 .1186 /gb -2013 -14 -10 -r120
McKenna, A., M. Hanna, E. Banks, A. Sivachenko, K. Cibulskis, A. Kernytsky, K. Garimella, D. Altshuler, S. Gabriel, M. Daly, and M.A. DePristo. 2010. The Genome Analysis Toolkit: A MapReduce framework for analyzing next-generation DNA sequencing data. Genome Res. 20:1297–1303. http ://dx .doi .org /10 .1101 /gr .107524 .110
McKinney, M., A.B. Moffitt, P. Gaulard, M. Travert, L. De Leval, A. Nicolae, M. Raffeld, E.S. Jaffe, S. Pittaluga, L. Xi, et al. 2017. The genetic basis of hepatosplenic T-cell lymphoma. Cancer Discov. 7:369–379. http ://dx .doi .org /10 .1158 /2159 -8290 .CD -16 -0330
Meresse, B., S.A. Curran, C. Ciszewski, G. Orbelyan, M. Setty, G. Bhagat, L. Lee, M. Tretiakova, C. Semrad, E. Kistner, et al. 2006. Reprogramming of CTLs into natural killer-like cells in celiac disease. J. Exp. Med.
Mermel, C.H., S.E. Schumacher, B. Hill, M.L. Meyerson, R. Beroukhim, and G. Getz. 2011. GIS TIC2.0 facilitates sensitive and confident localization of the targets of focal somatic copy-number alteration in human cancers.
Genome Biol. 12:R41. http ://dx .doi .org /10 .1186 /gb -2011 -12 -4 -r41 Morlan, J.D., K. Qu, and D.V. Sinicropi. 2012. Selective depletion of rRNA
enables whole transcriptome profiling of archival fixed tissue. PLoS One.
7:e42882. http ://dx .doi .org /10 .1371 /journal .pone .0042882
Nairismägi, M.L., J. Tan, J.Q. Lim, S. Nagarajan, C.C.Y. Ng, V. Rajasegaran, D. Huang, W.K. Lim, Y. Laurensia, G.C. Wijaya, et al. 2016. JAK-STAT and G-protein-coupled receptor signaling pathways are frequently altered in epitheliotropic intestinal T-cell lymphoma. Leukemia. 30:1311–1319. http ://dx .doi .org /10 .1038 /leu .2016 .13
Nilsen, E.M., F.L. Jahnsen, K.E. Lundin, F.E. Johansen, O. Fausa, L.M. Sollid, J. Jahnsen, H. Scott, and P. Brandtzaeg. 1998. Gluten induces an intestinal cytokine response strongly dominated by interferon gamma in patients with celiac disease. Gastroenterology. 115:551–563. http ://dx .doi .org /10 .1016 /S0016 -5085(98)70134 -9
Pan, L., J. Hanrahan, J. Li, L.P. Hale, and Y. Zhuang. 2002. An analysis of T cell intrinsic roles of E2A by conditional gene disruption in the thymus. J. Immunol. 168:3923–3932. http ://dx .doi .org /10 .4049 /jimmunol .168 .8 .3923
Roberti, A., M.P. Dobay, B. Bisig, D. Vallois, C. Boéchat, E. Lanitis, B. Bouchindhomme, M.-C. Parrens, C. Bossard, L. Quintanilla-Martinez, et al. 2016. Type II enteropathy-associated T-cell lymphoma features a unique genomic profile with highly recurrent SETD2 alterations. Nat. Commun. 7:12602. http ://dx .doi .org /10 .1038 /ncomms12602
Sharaiha, R.Z., B. Lebwohl, L. Reimers, G. Bhagat, P.H. Green, and A.I. Neugut. 2012. Increasing incidence of enteropathy-associated T-cell lymphoma in the United States, 1973-2008. Cancer. 118:3786–3792. http ://dx .doi .org /10 .1002 /cncr .26700
Sim, N.-L., P. Kumar, J. Hu, S. Henikoff, G. Schneider, and P.C. Ng. 2012. SIFT web server: predicting effects of amino acid substitutions on proteins. Nucleic Acids Res. 40:W452-W457. http ://dx .doi .org /10 .1093 /nar /gks539
Subramanian, A., H. Kuehn, J. Gould, P. Tamayo, and J.P. Mesirov. 2007. GSEA-P: A desktop application for Gene Set Enrichment Analysis.
Bioinformatics. 23:3251–3253. http ://dx .doi .org /10 .1093 /bioinformatics /btm369
Sun, J., Z. Lu, D. Yang, and J. Chen. 2011. Primary intestinal T-cell and NK-cell lymphomas: A clinicopathological and molecular study from China focused on type II enteropathy-associated T-cell lymphoma and primary intestinal NK-cell lymphoma. Mod. Pathol. 24:983–992. http ://dx .doi .org /10 .1038 /modpathol .2011 .45
Swerdlow, S., E. Campo, N.L. Harris, N.L. Harris, E.S. Jaffe, S.A. Pileri, H. Stein, J. Thiele, and J.W. Vardiman. 2008. WHO classification of tumours of haematopoietic and lymphoid tissues. IARC Press, France. 439 pp. Swerdlow, S.H., E. Campo, S.A. Pileri, N.L. Harris, H. Stein, R. Siebert, R.
Advani, M. Ghielmini, G.A. Salles, A.D. Zelenetz, and E.S. Jaffe. 2016. The 2016 revision of the World Health Organization classification of lymphoid neoplasms. Blood. 127:2375–2390. http ://dx .doi .org /10 .1182 /blood -2016 -01 -643569
Taguchi, T., W.K. Aicher, K. Fujihashi, M. Yamamoto, J.R. McGhee, J.A. Bluestone, and H. Kiyono. 1991. Novel function for intestinal intraep-ithelial lymphocytes. Murine CD3+, gamma/delta TCR+ T cells pro-duce IFN-gamma and IL-5. J. Immunol. 147:3736–3744.
Tomita, S., Y.Y. Kikuti, J. Carreras, M. Kojima, K. Ando, H. Takasaki, R. Sakai, K. Takata, T. Yoshino, S. Bea, et al. 2015. Genomic and immunohistochemical profiles of enteropathy-associated T-cell lymphoma in Japan. Mod. Pathol.
28:1286–1296. http ://dx .doi .org /10 .1038 /modpathol .2015 .85 Trapnell, C., A. Roberts, L. Goff, G. Pertea, D. Kim, D.R. Kelley, H. Pimentel,
S.L. Salzberg, J.L. Rinn, and L. Pachter. 2012. Differential gene and transcript expression analysis of RNA-seq experiments with TopHat and Cufflinks. Nat. Protoc. 7:562–578. http ://dx .doi .org /10 .1038 /nprot .2012 .016
Tse, E., H. Gill, F. Loong, S.J. Kim, S.B. Ng, T. Tang, Y.H. Ko, W.J. Chng, S.T. Lim, W.S. Kim, and Y.L. Kwong. 2012. Type II enteropathy-associated T-cell lymphoma: A multicenter analysis from the Asia Lymphoma Study Group. Am. J. Hematol. 87:663–668. http ://dx .doi .org /10 .1002 /ajh .23213
Wang, K., M. Li, and H. Hakonarson. 2010. ANN OVAR: Functional annotation of genetic variants from high-throughput sequencing data.
Nucleic Acids Res. 38:e164. http ://dx .doi .org /10 .1093 /nar /gkq603 Zhang, J., V. Grubor, C.L. Love, A. Banerjee, K.L. Richards, P.A. Mieczkowski,
C. Dunphy, W. Choi, W.Y. Au, G. Srivastava, et al. 2013. Genetic heterogeneity of diffuse large B-cell lymphoma. Proc. Natl. Acad. Sci. USA. 110:1398–1403. http ://dx .doi .org /10 .1073 /pnas .1205299110 Zhang, J., D. Jima, A.B. Moffitt, Q. Liu, M. Czader, E.D. Hsi, Y. Fedoriw, C.H.
Dunphy, K.L. Richards, J.I. Gill, et al. 2014. The genomic landscape of mantle cell lymphoma is related to the epigenetically determined chromatin state of normal B cells. Blood. 123:2988–2996. http ://dx .doi .org /10 .1182 /blood -2013 -07 -517177