SYSTEMS GENETICS APPROACH TO DEFINING GENETIC AND MICRORNA ASSOCIATION WITH DIET-ASSOCIATED ATHEROSCLEROSIS
Alisha Renee Coffey
A dissertation submitted to the faculty at the University of North Carolina at Chapel Hill in partial fulfillment of the requirements for the degree of Doctor of Philosophy in the
Curriculum in Genetics in Molecular Biology in the School of Medicine.
Chapel Hill 2018
Approved by:
Brian Bennett
Terry Furey
Samir Kelada
Nobuyo Maeda
© 2018
ABSTRACT
Alisha Renee Coffey: Systems Genetics Approach to Defining Genetic and MicroRNA Association with Diet-Associated Atherosclerosis
(Under the direction of Brian J. Bennett and Praveen Sethupathy)
Atherosclerosis is a progressive condition that can develop over the course of decades, and eventually lead to cardiovascular disease, which is the leading cause of death in the world. Metabolic imbalance in the liver can cause dyslipidemia (abnormal levels of lipids) and aberrant levels of metabolites such as trimethylamine N-oxide (TMAO), both of which are associated with increased risk of atherosclerosis. Understanding the genetic influences and molecular networks that govern these processes is necessary to identify candidates for more effective therapeutics.
a genetically diverse mouse cohort from the Diversity Outbred (DO) resource to
identify co-regulated modules of hepatic miRNAs, or rather groups of miRNAs in the
liver that exhibit a shared response to a pro-atherogenic diet. I also quantified the extent
of association between the miRNA groups, gene modules, and several cardiometabolic
traits. Notably, we found that one particular group of miRNAs, comprising members
such as miR-146, miR-27, miR-24, miR-199, and miR-181, is strongly correlated with
circulating levels of low-density lipoprotein cholesterol.
The majority of previous studies on the cardiovascular disease risk factor and
liver metabolite TMAO focus on its regulation by the gut microbiota as well as some
host liver enzymes. However, there have been very few studies to investigate the
effects of host genetics on circulating TMAO levels. To understand the genetic
influences on TMAO, I performed quantitative trait loci mapping in the same DO cohort
mentioned above. I identified a novel association between a locus on chromosome 12
and circulating TMAO levels. Also, I identified miR-146 as a strong candidate regulator
of TMAO, which was corroborated in additional animal models (a mouse and
non-human primate model) of cardiometabolic dysfunction.
The findings from this body of work contribute to the field by addressing two
major knowledge gaps, and warrant further study and validation in the context of
To all of those who came before me – who fought, suffered, hoped, prayed, or sacrificed their lives to make this possible for me.
ACKNOWLEDGEMENTS
I’d first like to thank God for blessing me throughout this entire journey. This was the best and hardest time in my life, but I made it through.
I also would like to thank my mentors and advisors, Brian Bennett and
Praveen Sethupathy. Brian has always been so encouraging and helpful. Even with the miles and miles of distance between us, he always was dedicated to being a present mentor, and made absolutely sure that I had everything that I needed, from lab equipment to IT help; ending every conversation with, “Is there anything else you need from me?” Praveen has also encouraged me to strive to do better, and was always willing to teach, and make sure I understood concepts. He always reminded me to “get out of the weeds” and always question the biological meaning from a broader perspective. I thank him for taking the chance on accepting me into his lab, and fully stepping into the role of mentor without hesitation. I know I may not have been the perfect graduate student for either Brian or Praveen, but I know that they always made sure to let me know that they were there if ever I needed anything. I often compare my advisors with others, and could not have been happier with anyone else. Thank you for making the graduate experience and training that much easier.
me lab techniques, sharing your code, and never making me feel excluded. You guys were a great lab family!
I want to acknowledge my dissertation committee members, Terry Furey, Nobuyo Maeda, Karen Mohlke, and Samir Kelada. Everyone was always so
understanding of who I am as a student, and so often willing to give suggestions and advice. Thank you for making me feel comfortable, yet challenging me in all of my committee meetings and individual meetings with you.
I’d like to thank my friends for seeing me through this journey. Kim Stratford and Nicole Fleming especially got me through these last couple of years of graduate school. Thanks for literally making me keep the faith, and for understanding the struggle. To Lennora Folkes, I owe thanks for lots of laughs. Even though we are on opposite sides of the country, she always made sure to check on me, listen to my rants, and put a smile on my face. To two of my oldest friends, Ashley Mays
Agbemaple and Lauren Royal McDonald Moss, I thank them for randomly calling or texting me, and still managing to include me in their lives, even when I was
unplugged and seemingly missing in action. To various other friends that may not have gotten a personal mention here, you are not forgotten. I thank you for making these past few years great. I honestly would not have survived grad school without all of you!
you for always being a phone call away. Daddy, thank you for always praying for me, and supporting me through it all. You were always willing to talk things out and help me plan my next steps. To my sister, Jonaee, I thank you for being the type of big sister that I could share things with, and have deep or silly conversations with. I also would like to thank my grandmothers for their love, and for calling to make sure I was doing well. To my aunts, I thank them for their support and love. To the rest of my family, thank you for all of the encouragement and well wishes.
PREFACE
The work in Chapter 2 previously appeared as an article in the journal
Physiological Genomics, in 2017, under the direction of Dr. Brian J. Bennett and Dr. Praveen Sethupathy. The citation for this manuscript is as following: Coffey AR, Smallwood TL, Albright J, Hua K, Kanke M, Pomp D, Bennett BJ, Sethupathy P. Systems genetics identifies a co-regulated module of liver microRNAs associated with plasma LDL cholesterol in murine diet-induced dyslipidemia. Physiol Genomics, DOI: 10.1152/physiolgenomics.00050.02017.
Experiments performed on LIRKO mice and African Green Monkeys in Chapter 3 were executed by individuals in the labs of Sudha Biddinger and Ryan Temel,
respectively, as denoted by the appropriate references.
The work highlighted in this dissertation was supported through several funding sources including National Science Foundation Graduate Research Fellowship,
TABLE OF CONTENTS
LIST OF FIGURES ... xiv
LIST OF TABLES ... xv
LIST OF ABBREVIATIONS ... xvi
CHAPTER 1: INTRODUCTION ... 1
1.1 ATHEROSCLEROSIS ... 1
1.2 LIPID HOMEOSTASIS, THE LIVER, AND ATHEROSCLEROSIS ... 3
1.3 MICRORNAS... 6
1.3.1 Overview of MicroRNA Biogenesis ... 6
1.3.2 Regulatory Function of MicroRNAs ... 7
1.4 MICRORNAS IN ATHEROSCLEROSIS ... 10
1.4.1 miR-33 ... 10
1.4.2 miR-30c ... 11
1.4.3 miR-148a ... 12
1.4.4 miR-27 ... 13
1.5 ANIMAL MODELS USED FOR STUDYING ATHEROSCLEROSIS ... 14
1.6 SYSTEMS GENETICS APPROACHES FOR STUDYING ATHEROSCLEROSIS ... 16
CHAPTER 2: SYSTEMS GENETICS IDENTIFIES A CO-REGULATED MODULE OF LIVER MICRORNAS ASSOCIATED WITH PLASMA LDL
CHOLESTEROL IN MURINE DIET-INDUCED DYSLIPIDEMIA ... 22
2.1 INTRODUCTION ... 22
2.2 MATERIALS AND METHODS... 24
2.2.1 Animals, Diets, and Phenotyping ... 24
2.2.2 RNA Extraction ... 25
2.2.3 Microarray ... 26
2.2.4 Small RNA-sequencing ... 27
2.2.5 WGCNA ... 28
2.2.6 Pathway Enrichment Analysis ... 30
2.2.7 MicroRNA Target Site Enrichment Analysis ... 30
2.3 RESULTS ... 31
2.3.1 Effects of a high-fat cholic acid, dyslipidemia-inducing diet on plasma lipoprotein cholesterol levels in the diversity outbred mouse population ... 31
2.3.2 Effects of the HFCA diet on liver miRNA expression in the DO cohort ... 32
2.3.3 Identification of co-regulated miRNA modules and correlation with lipid phenotype ... 37
2.3.4 Identification of microRNA “hubs” in the brown module correlated with post-diet plasma VLDL/LDL-C ... 41
2.3.5 Analysis of gene expression data and identification of several gene co-regulated modules associated with post-diet LDL-C and inversely correlated with the brown microRNA module ... 41
CHAPTER 3: GENETIC AND MICRORNA ASSOCIATION WITH THE
CARDIOMETABOLIC DISEASE RISK FACTOR TMAO ... 55
3.1 INTRODUCTION ... 55
3.2 MATERIALS AND METHODS... 57
3.2.1 Animals, Diets and Genotyping ... 57
3.2.2 Measurement of TMAO Metabolite ... 57
3.2.3 Measurement of microRNA and mRNA Expression ... 58
3.2.4 QTL Mapping ... 58
3.2.5 QTL-eQTL Overlap Analysis ... 60
3.2.6 Bioinformatics ... 60
3.2.7 Small RNA-Sequencing in Livers of LIRKO mice ... 60
3.2.8 Small RNA-Sequencing in Livers of Monkeys ... 61
3.3 RESULTS ... 62
3.3.1 Plasma TMAO levels in the Diversity Outbred mice and its relationship to cardiovascular risk factors ... 63
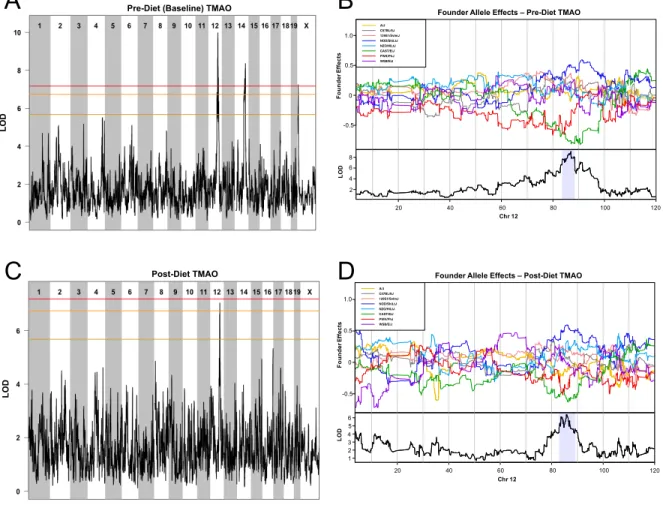
3.3.2 Identification of Chromosome 12 QTL associated with TMAO at baseline and after dietary treatment ... 65
3.3.3 A subset of genes within the Chromosome 12 TMAO QTL have overlapping eQTL ... 67
3.3.4 Evidence for robust miR-146 association with circulating TMAO levels and atherosclerosis ... 71
3.4 DISCUSSION ... 76
CHAPTER 4: DISCUSSION AND FUTURE DIRECTIONS ... 84
4.1 MICRORNA MODULES ... 84
LIST OF FIGURES
Figure 2.1: Summary Diagram of Experimental Design ... 33 Figure 2.2: Plasma VLDL/LDL, AST and ALT are dramatically
affected by HFCA diet ... 34 Figure 2.3: Diet alters miRNA expression ... 38 Figure 2.4: Diet alters expression of specific miRNAs ... 39 Figure 2.5: MiRNA co-expression analysis identifies module
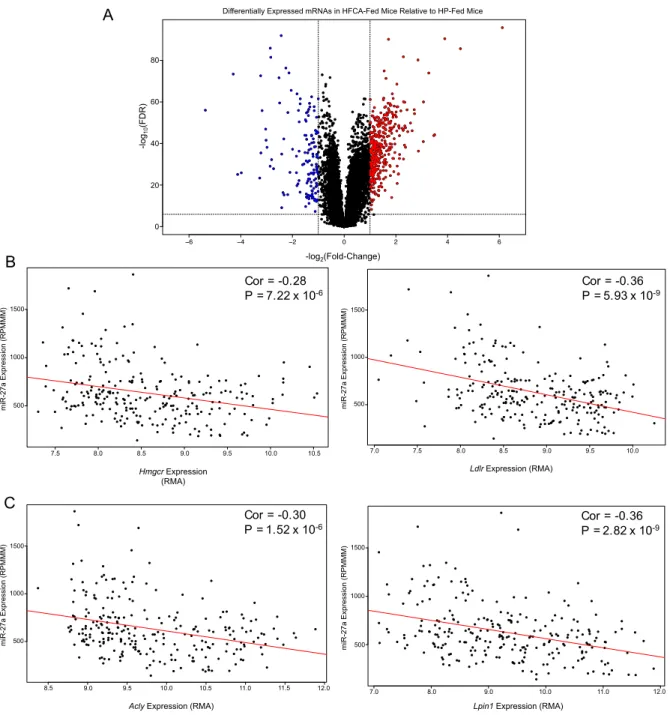
associated with metabolic traits ... 40 Figure 2.6: Differential expression analysis for gene expression ... 52 Figure 2.7: Gene co-expression analysis identifies gCRMs that are
are correlated with the brown mCRM ... 53 Figure 3.1: Plasma TMAO levels are altered by diet and are correlated
cardiometabolic phenotypes in the DO mice ... 64 Figure 3.2: Genetic mapping of TMAO in DO mice before and
dietary treatment ... 66 Figure 3.3: Genes within the TMAO QTL interval have
overlapping eQTL ... 69 Figure 3.4: The remainder of the seven genes that have consistent
founder alleles with TMAO ... 70 Figure 3.5: miR-146a/b has significant associations with post-diet
TMAO in DO mice ... 79 Figure 3.6: miR-146a/b, miR-34a, and miR-1247 are upregulated
in DO and LIRKO mouse livers ... 80 Figure 3.7: miR-146a/b is significantly altered in monkeys and is
inversely associated with a previously validated target gene
in the TMAO QTL, Numb ... 82 Figure 3.8: Fold change in expression of miRNAs in monkeys
LIST OF TABLES
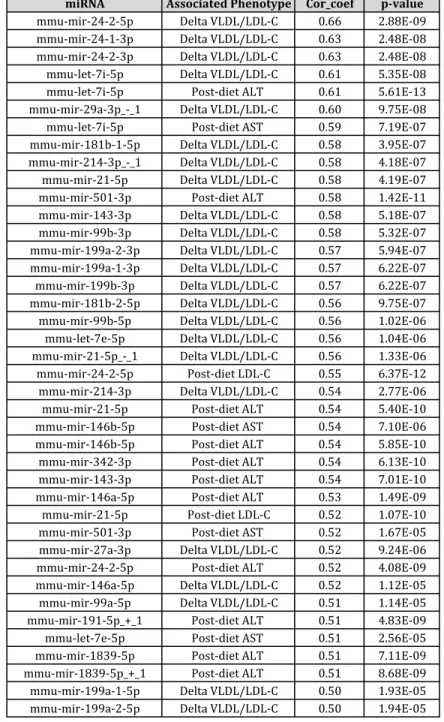
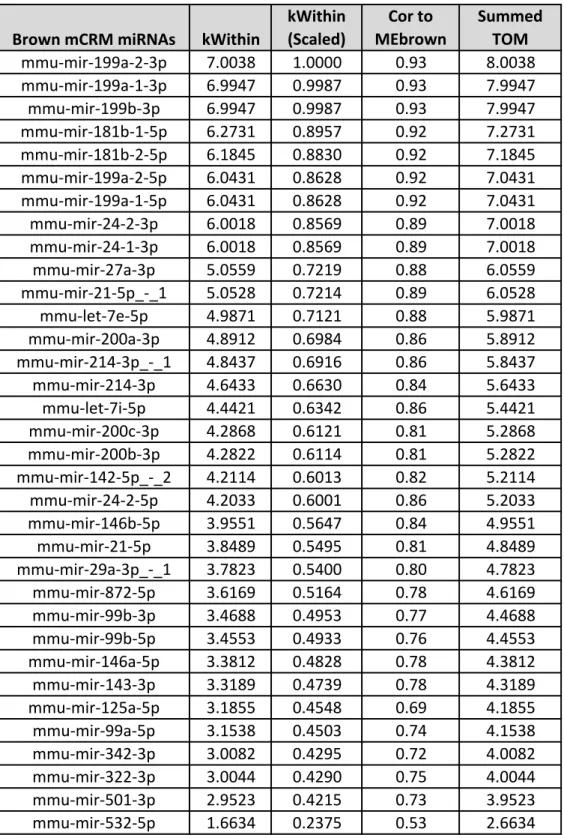
Table 2.1: Top correlations between miRNAs and cardiometabolic endpoints ... 44 Table 2.2: miRNAs with the highest interconnectedness are
identified as hubs ... 51 Table 3.1: Significant eQTL at the chromosome 12 TMAO locus ... 72 Table 3.2: Correlations between genes and TMAO levels ... 73 Table 3.3: miRNAs that are predicted to target genes with eQTL
overlapping the TMAO QTL and exhibit consistent allele effects ... 73 Table 3.4: Mapping statistics for small RNA-seq in LIRKO mice ... 74 Table 3.5: Mapping statistics for small RNA-seq in African
Green Monkey livers ... 81 Table A1: Predicted target genes of the brown miRNA module members ... 96 Table A2: Genes in the TMAO chromosome 12 QTL interval ... 104 Table A3: Fold change of robustly expressed miRNAs in African
LIST OF ABBREVIATIONS
3’ UTR 3’ untranslated region ABCA1 ATP-binding cassette A1 ABCG1 ATP-binding cassette G1 ACAT1 Acetyl-CoA acetyltransferase 1 Apoa1 Apolipoprotein A1
Apoe Apolipoprotein E CC Collaborative Cross CVD Cardiovascular disease DO Diversity Outbred
eQTL Expression quantitative trait loci GWAS Genome-wide association studies HDL High-density lipoprotein
HFCA High fat diet with added cholic acid HFHC High fat, high cholesterol diet HMDP Hybrid mouse diversity panel HP High protein diet
IL-1β Interleukin 1 beta
LDL-C Low-density lipoprotein cholesterol LDLR Low-density lipoprotein receptor
LPGAT1 Lysophosphatidylglycerol acyltransferase 1
LPL Lipoprotein lipase
miRNA micoRNA. Individual miRNAs are identified as “miR”, “mmu-miR”, or “hsa-miR” followed by a number
MMP-13 Matrix metalloproteinase 13
mRNA messenger RNA
MTP Microsomal triglyceride transport protein
MYC Myelocytomatosis gene
NAFLD Non-alcoholic fatty liver disease
oxLDL Oxidized LDL
PCSK9 Proprotein convertase subtilisin/kexin type 9
PPARα Peroxisome proliferator-activated receptor alpha Pre-miRNA miRNA precursor
Pri-miRNA Primary miRNA
QTL Quantitative trait loci
SNP Single nucleotide polymorphism
TMA Trimethylamine
TMAO Trimethylamine-N-oxide
TOM Topological overlap measure
VLDL-C Very low-density lipoprotein cholesterol
CHAPTER 1: INTRODUCTION
1.1 ATHEROSCLEROSIS
According to the World Health Organization, cardiovascular disease (CVD) is the number one cause of death worldwide, with ~30% of all deaths resulting from complications of CVD in 2015 [WHO]. CVD is not one disease, but can be one (or more) of multiple systemic conditions including, but not limited to angina, coronary heart disease, and peripheral artery disease. Atherosclerosis, a condition involving the gradual hardening and narrowing of the major or medium arteries caused by fatty deposit build-up, is a common cause and hallmark of CVD [AHA].
[Lusis 2000]. The advanced lesion, if left untreated, can lead to ischemia, heart attack, stroke and death.
A number of environmental factors are known to promote the development of atherosclerosis. These include having a lifestyle that lacks exercise, overuse of alcohol, chronic smoking, and (of particular importance) an unhealthy diet that is high in saturated fats and cholesterol [AHA, WHO]. Of these, diet is one of the largest contributors to atherosclerosis and CVD. A health comparison of Japanese people living in Japan versus those living in the United States showed that
1.2 LIPID HOMEOSTASIS, THE LIVER, AND ATHEROSCLEROSIS
Lipid homeostasis is a balancing act between lipid intake, distribution, storage, and elimination. Although there are several organs and tissues that have a role in lipid homeostasis, the liver is one of the central organs in lipid metabolism and distribution. It is responsible for the synthesis, export, and clearance of lipids from circulation. Liver metabolism is meticulously regulated by the quality and quantity of diet, and energy availability.
monocytes differentiate into macrophages, which proceed to engulf and digest the oxidized LDL-C (oxLDL). However, oxLDL overload often occurs in macrophages, thereby causing them to become foam cells: cells typically found in abundance in atherosclerotic plaques [Helk et al. 2016]. Thus, an increase in circulating lipids initiated in large part by the liver, is extremely important in the onset and progression of atherosclerosis.
A metabolic imbalance in the liver often results in a shift in lipid homeostasis. For instance, non-alcoholic fatty liver disease (NAFLD) has been implicated as a predictor for several cardiometabolic conditions, including CVD [Lonardo et al. 2017]. Not only is NAFLD a strong risk factor for CVD, but also, evidence suggests that it may instigate the premature progression of fatty streaks to advanced lesions, which ultimately increases the incidence of cardiac events (e.g., heart attack, stroke) and mortality irrespectively of other CVD risk factors [Lonardo et al. 2006].
Furthermore, it has been shown to cause chronic inflammation, which is another hallmark of atherosclerosis and CVD [Sinn et al. 2017, Zeb et al. 2016]. NAFLD also can be used as a predictor for hypertension (another important risk factor for CVD), and the severity of NAFLD-induced fibrosis in the liver can additionally serve as an indicator of CVD mortality [Ekstedt et al. 2015, Li et al. 2017, Lopez-Suarez et al. 2011].
The microbiota first convert dietary choline (from sources like red meat, eggs, and
fish) to trimethylamine (TMA) gas, which is then absorbed and transported to the
liver where it is oxidized into TMAO, predominately by flavin monooxygenase 3
(FMO3) [Wang et al. 2011]. Studies in atherosclerosis-prone mice show that a
regular chow diet supplemented with TMAO or choline is enough to cause formation
of atherosclerotic plaques in the aorta, whereas treatment of the same mice with
antibiotics prevented this increase in plaque formation [Wang et al. 2011]. A similar
study in humans showed a marked reduction in TMAO levels after treatment with
antibiotics, and a rebound after antibiotic treatment was complete [Tang et al. 2013].
Further studies in humans comparing vegetarians and omnivores showed that
omnivores had higher baseline levels of TMAO and a greater capacity to produce
TMAO after L-carnitine feeding than the vegetarians; thereby, highlighting the
differences in diet-mediated gut microbiota composition between meat-eaters and
vegetarians [Koeth et al. 2013].
While these studies suggest a causal relationship between the microbiota,
TMAO, and atherosclerosis, they do not address the relationship between TMAO
levels and host genetics. A genome-wide association study (GWAS) done in the
Hybrid Mouse Diversity Panel identified a locus for TMAO levels that overlaps with
an expression quantitative trait locus (eQTL) on chromosome 3 for Slc30a7
expression [Hartiala et al. 2014]. In their comparative GWAS performed in humans,
the association was found to be merely suggestive. Although the association did not
this gene is involved with modulating TMAO levels [Hartiala et al. 2014].
Additionally, in a recent variant analysis done in individuals with trimethylaminuria
disorder – which prevents individuals from converting TMA to TMAO – rare SNPs
and insertion/deletions were identified in genes other than FMO3, thus providing
further evidence that TMA metabolism and TMAO levels may be affected by other
genes and genetic variation [Guo et al. 2017]. This provides the motivation for
additional studies to further elucidate genetic influences, whether at the genomic
level or molecular level, on TMAO.
1.3 MICRORNAS
A prominent species of RNA, known as microRNAs (miRNAs), has emerged as
important regulators of gene expression, has been shown to function within
molecular regulatory networks, and has been implicated in many biological
processes that control lipid and metabolite metabolism. Here, it is important to
highlight their actions and significance in CVD as they are part of the foundation of
the work presented in this dissertation.
1.3.1 Overview of MicroRNA Biogenesis
MiRNAs are small non-coding RNAs that are post-transcriptional repressors
of messenger RNA (mRNA) expression. They are encoded in the genome in
intergenic regions, or within exonic or intronic regions of host genes [Altuvia et al.
RNA Polymerase II, although there are some transcribed by RNA Polymerase III
[Borchert et al. 2006, Lee et al. 2004]. The pri-miRNAs, which can be over 1
kilobase in length, are trimmed by nuclear RNase III Drosha to reveal one or more
miRNA precursors (pre-miRNAs), which are stem loop intermediates that are around
70 nucleotides in length [Lee et al. 2002, Lee et al. 2003]. The pre-miRNAs are then
transported to the cytoplasm by the Ran-GTP-dependent RNA binding protein,
Exportin-5, where they are further processed by RNase III Dicer into a ~22
nucleotide duplex [Yi et al. 2003]. One of the strands of the duplex is incorporated
into the RISC (RNA-induced silencing complex), more specifically with an Argonaute
protein, to locate an accessible complementary target sequence commonly found in
the 3’ untranslated region (UTR) of specific mRNAs. Once the mature miRNA’s seed
is sufficiently hybridized with a target sequence, the RISC can prevent translation by
deadenylation, recruiting P body components to the mRNA, ribosomal drop off
during translational elongation, and possibly other proposed methods [Eulalio et al.
2008, Wakiyama et al. 2007, Parker and Sheth 2007, Petersen et al. 2006].
1.3.2 Regulatory Function of MicroRNAs
MiRNAs were first studied in Caenorhabditis elegans (C. elegans), in the
context of post-embryonic development, and were regarded as molecular switches.
Lin-4, which was originally presumed to be a protein-coding gene, was found to be a
miRNA that heterochronically decreases expression of lin-14 during the L1 larval
lin-4, the lingering high levels of lin-14 cause the larva to undergo a repeat of previous
developmental stages, thus causing an abnormal adult lacking critical tissues. These
findings demonstrated that miRNAs can turn essential genes that progress
developmental programs on or off. Beyond development, miRNAs have been shown
to perform this on/off switch-like function in other pathways, such as those
associated with cancer cell proliferation. For instance, overexpression of let-7a was
shown to cause a decrease in expression of MYC mRNA and protein, and decrease
proliferation of lymphoma cells [Sampson et al. 2007]. More recently, researchers
have harnessed and utilized the molecular on/off regulatory power of miRNAs in the
detection and purification of cell types for which specific antigens have not been
identified or extensively validated [Miki et al. 2015]. Overall, miRNA function as a
molecular switch demonstrates that the effect of a single miRNA can have a robust
regulatory effect on the expression of highly impactful genes.
Although there are some contexts in which miRNAs operate as molecular
switches, they more often operate as fine tuners of gene expression. On their own,
miRNAs tend to have moderate effects on target gene expression. Most miRNAs
merely stymie the expression of their target mRNAs to maintain levels below a
certain threshold [Mukherji et al. 2011]. In other words, the miRNAs function to
decrease noisy expression of their targets in order to enhance the robustness of
some other switch-like molecule [Cohen et al. 2006, Mukherji et al. 2011, Siciliano et
al. 2013]. This buffering function is likely the reason why the dysregulation of a
atherosclerosis and cardiometabolic dysfunction. The dysregulated miRNA’s
function can obscure its target genes’ expression thresholds, thereby rendering the other molecular switch ineffective.
1.4 MICRORNAS IN ATHEROSCLEROSIS
While processes of atherosclerosis and CVD progression encompass several tissues including immune cells, endothelial cells, the intestine, and adipose, multiple miRNAs in the liver have been implicated as being drivers or responders to
atherosclerosis or cardiometabolic dysfunction. Yet, there are a precious few that have been extensively studied. In the following paragraphs, I will briefly describe them and their importance in atherosclerosis.
1.4.1 miR-33
[Horie et al. 2013]. This action is conserved in humans, however, humans have two
members of the miR-33 family, miR-33a and miR-33b, that differ by only 2
nucleotides; whereas mice only have one, which is homologous to human miR-33a.
Antagonism of miR-33 results in an increase in fatty acid oxidation genes and
high-density lipoprotein (HDL), and a decrease in expression of fatty acid synthesis genes
and circulating VLDL triglyceride levels in non-human primates [Rayner et al. 2011].
In mice, treatment of antagomiR-33 or miR-33 KO ultimately caused the regression
of atherosclerotic plaques in two traditional models of atherosclerosis, Ldlr-/- and Apoe-/-, respectively, which led to the consideration of miR-33 as a therapeutic target [Horie et al. 2012, Rotllan et al. 2013]. However, long-term inhibition of miR-33
showed no change in the state of disease in Ldlr--/- mice, and even had detrimental effects in wild-type C57BL/6 mice fed a high fat diet (HFD) [Marquart et al. 2013,
Goedeke et al. 2014].
1.4.2 miR-30c
miR-30c is a more recently discovered miRNA in the context of
atherosclerosis. In 2013, it was discovered to have atherosclerosis and
hyperlipidemia-reducing effects when overexpressed by lentivirus in the livers of
C57BL/6 mice fed a western diet [Soh et al. 2013]. Injecting miR-30c mimic was
shown to have similar effects in Ldlr-/- mice, as well as ob/ob, and db/db mice, which are other models of cardiometabolic dysfunction [Irani et al. 2016, Irani et al. 2017].
lipoprotein assembly and lipidation to form LDL. In an MTP activity assay, miR-30c decreased MTP activity by 50%, whereas other miR-30 family members had no effect [Soh et al. 2013]. It exerts its lipid synthesis reducing activity by also targeting Lpgat1. This activity, along with its lack of steatosis or other harmful side effects makes miR-30c an attractive candidate for use as a therapeutic agent against atherosclerosis [Irani et al. 2015, Irani et al. 2016, Soh et al. 2013].
1.4.3 miR-148a
miR-148a is an intergenic miRNA that regulates lipid metabolism in the liver, adipose tissue, and macrophages by regulating LDLR and ABCA1 [Baldan and Fernandez-Hernando 2016]. A high-throughput screen revealed that miR-148a
mimic led to a decrease in LDLR [Goedeke et al. 2016]. Further investigation showed that miR-148a expression is modulated by SREBP1, which is in turn
modulated by lipid levels [Goedeke et al. 2016]. When miR-148a is inhibited, LDLR and ABCA1 are increased, which causes a decrease in circulating LDL-C and an increase in circulating HDL-C [Goedeke et al. 2016, Wagschal et al. 2015]. In the livers of mice and non-human primates fed a HFD, miR-148a is found to be
1.4.4 miR-27
expression in the liver is altered in dyslipidemia and atherosclerosis [Vickers et al. 2013].
In addition to the four that have been highlighted here, there are a number of other hepatic miRNAs that have been implicated in atherosclerosis. Many of these such as miR-29, miR-146, miR-24, and miR-122 have been identified as regulators of lipid metabolism and have been shown to be abnormally expressed in the disease state [Baldan and Fernandez-Hernando 2016, Kurtz et al. 2015, Rotllan et al. 2016, Willeit et al. 2016]. The growing list of miRNAs relevant to lipid metabolism and
homeostasis provides the motivation to identify groups of miRNAs that modulate the underlying processes of CVD.
1.5 ANIMAL MODELS USED FOR STUDYING ATHEROSCLEROSIS
The laboratory mouse has been an invaluable tool for studying the onset, progression, and molecular mechanisms involved in atherosclerosis and its risk factors. Since mice are naturally resistant to atherosclerosis, it was necessary to develop mouse models that are prone to developing atherosclerosis and
hyperlipidemia. These are generally on the C57BL/6J background, and commonly harbor a null mutation in a single gene -- the two most widely-used KO mouse models being ApoE-/- and Ldlr-/- mice [Ishibashi et al.1994, Zhang et al. 1992].
feeding [Plump et al. 1992]. Ldlr deficient mice also have disrupted cholesterol uptake (especially that of apoB and apoE-containing lipoproteins), and have a phenotype similar to that seen in humans with familial hypercholesterolemia
[Defesche 2004]. Similar to ApoE deficient mice, when Ldlr deficient mice are fed a HFD, the severity of hyperlipidemia and atherosclerosis is worsened. Much of what is known about genes and mechanisms influencing atherosclerosis have been identified using these mouse models. It is worth noting that there are other models, including transgenic mouse models such as ApoE3-Leiden that are also popular for studying cardiometabolic dysfunction, but may have slightly different phenotypic characteristics [van den Maagdenberg et al. 1993].
successful these models are, their limitations and shortcomings suggest that a model that more directly mimics the genetic diversity seen in humans is needed.
1.6 SYSTEMS GENETICS APPROACHES FOR STUDYING
ATHEROSCLEROSIS
Many of the risk factors have significant genetic components associated with strong heritability and increased susceptibility for developing atherosclerosis. These risk factors, including total cholesterol, HDL-C, triglycerides, body mass index, blood pressure, and type 2 diabetes, together have heritability measures anywhere from
approximately 25-80% [Lusis 2004]. These factors, when measured in the
population, often convey normal distributions, which are indicative of polygenic traits, or rather traits controlled by multiple genes [Lusis 2004].
Since many cardiometabolic traits are polygenic and influenced by pleiotropic molecules, studying them should involve a method that includes a more
comprehensive view of the systems and networks underpinning them. Instead of using a knockout or transgenic animal model that involves a single mutation like in conventional studies, systems genetics studies -- in which there is integration of genetic variation, molecular profiles, and phenotype information -- are becoming increasingly popular as a method for relating genetics with molecular and
physiological phenotypes [Sieberts and Schadt 2007]. In these methods, a
case, the genetic diversity acts as multiple genetic perturbations, which modifies the proper function of molecular networks and initiates disease [Civelek and Lusis 2014, Sieberts and Schadt 2007]. Overall, by integrating genetic and genomic data, we can explore how natural variation in a population influences disease and disease-related phenotypes, and eventually identify candidates that exert causal control over them [Kulp and Jagalur 2006].
high degree of naturally-occurring allelic variation, the genetic makeup, phenotypic variability, and susceptibility to various chemicals or diseases mimics that which is seen in humans [Schmidt 2015]. To that end, the DO mouse resource is an idyllic animal model for systems genetics and genetic mapping studies. Specifically, it is a resource that is ideal for performing unbiased systems genetics studies, in which transcriptional signatures are identified in a particular context without the specific modification of the organism’s genome. By this method, we can begin to answer explicit questions regarding genetics and regulation, as well as gain a more global view of the system.
1.7 SUMMARY AND SIGNIFICANCE OF RESEARCH PRESENTED
The research within this dissertation features work that is an expansion of a previous study in which DO mice were used to perform quantitative trait loci (QTL) mapping studies to identify novel QTL for clinical phenotypes measured either before or after specific diet treatments [Smallwood 2015]. The work presented here delves a bit deeper by investigating the molecular profiles of gene and miRNA expression in the livers of the same ~300 DO mice. Having the molecular
Although there is a large amount of evidence supporting groups of miRNAs regulating networks or modules of genes, miRNA studies encompassing
cardiometabolic dysfunction commonly involve the investigation of single miRNAs in a single inbred mouse strain, or mice on an inbred strain background. Those studies are not conducive to getting a complete picture of how the fine-tuning action of miRNA groups, or modules, can facilitate the development of particular physiological outcomes. With the work included in Chapter 2, we addressed this deficiency by performing an unbiased systems genetics approach to identifying miRNA modules associated with VLDL/LDL-C in a large and genetically diverse cohort of outbred mice on an atherogenic diet. By utilizing the gene and miRNA expression data and phenotype data, I performed a expression network analysis to identify
miR-21 isomiR. This work not only addresses the aforementioned shortcomings in the field, but also highlights the importance of using genetically diverse animal models in such studies, as some results did not coincide with findings from studies using only inbred mice; thus, suggesting that the results from the inbred mouse studies may be ungeneralizable to genetically diverse organisms such as humans.
To take advantage of the genetic diversity of the mouse cohort, and to address our question on genetic regulatory action, I integrated the data sets to perform QTL and eQTL mapping on the cardiometabolic parameters, genes and miRNAs. Since not much is known about the host genetic regulation of circulating TMAO, in chapter 3, I utilized the mapping results to shed some light on the molecular underpinnings governing the cardiometabolic trait, TMAO. My work peels back one of the layers of this regulation by identifying miR-146 as a potential regulator of TMAO levels as it is one of the most highly aberrantly expressed miRNAs in the livers of the DO mice, as well as in the livers of two other animal models of cardiometabolic dysfunction with elevated TMAO levels, including non-human primates. Its expression is also
significantly correlated with post-diet TMAO thereby supporting miR-146 as a likely driver of, or responder to, elevated circulating TMAO levels (a marker for
cardiometabolic dysfunction). Also, QTL mapping done on pre-diet and post-diet levels of TMAO introduces another layer of genetic regulation of TMAO. We
The work presented herein is unique in that it incorporates multiple datasets with
phenotypic, genotypic, and molecular profile information from a cohort of genetically
diverse mice. In Chapter 4, I end the exposition of my work with a discussion of how
with these data, we have been able to answer some key scientific questions on
genetics and regulation in cardiometabolic dysfunction, and develop a basis for
2 CHAPTER 2: SYSTEMS GENETICS IDENTIFIES A CO-REGULATED MODULE OF LIVER MICRORNAS ASSOCIATED WITH PLASMA LDL
CHOLESTEROL IN MURINE DIET-INDUCED DYSLIPIDEMIA
2.1 INTRODUCTION
Dyslipidemia, or the state of having chronically altered lipid levels in the blood, is a major risk factor for developing atherosclerosis and cardiovascular disease [Nelson 2013, Zhang et al. 2015]. The liver is the primary organ regulating plasma lipid levels, and dysfunction in certain hepatic processes has been shown to be a
main contributor to dyslipidemia [Hojland et al. 2016, Zhang et al. 2015]. Thus, understanding the underlying molecular mechanisms in the liver that cause or respond to dyslipidemia is important for ultimately identifying novel therapeutic targets.
MiRNAs, which are small non-coding RNAs that fine-tune gene expression primarily at the post-transcriptional level, have emerged as key players in many processes, including those involved with lipid homeostasis. Several hepatic miRNAs have been associated with atherosclerosis and hyperlipidemia, including miR-27 [Shirasaki et al. 2013, Vickers et al. 2013], miR-122 [Elman et al. 2008], miR-148a
A number of these miRNAs, including miR-33 and miR-30c, have been identified as potential therapeutic targets for atherosclerosis and hyperlipidemia [Christopher et al. 2016, Irani and Hussain 2015]. However, there are at least two limitations shared by most of these studies. First, the vast majority of the studies of miRNAs in lipid-related disorders have been performed in C57BL/6 mice, an inbred mouse strain. Although these have produced promising results, the relevance of the findings to genetically diverse outbred populations (like humans) is unclear. Second, all of these studies involve a focused effort to understand an individual miRNA, and its contextually relevant target genes. While this is a reasonable approach, it is not conducive to understanding the roles of miRNAs within a network of other miRNAs and genes. This is an important limitation since there is evidence to support the idea that miRNAs often work in cooperative groups to regulate gene expression [Krek et al. 2005, Lai et al. 2012, Xu et al. 2011].
One approach to addressing both of these limitations is to utilize a systems genetics strategy wherein transcript levels are quantified in tissues of interest,
integrated with underlying genetic information, and related to clinical traits of interest. This has been successfully performed in a number of studies focused on gene
networks in glucose and lipid metabolism in humans [Plaisier et al. 2009], mice [Yang et al. 2009], and flies [Cermelli et al. 2006]. Subsequent studies have
A resource that is ideal for such a study is the Diversity Outbred (DO) mouse population. The DO mice were created by strategic outbreeding of eight parental strains of mice, the same ones used to generate the Collaborative Cross (CC) which are distinct lines of mice that are maintained as recombinant inbred strains [Churchill et al. 2004]. While DO mice are similar to CC mice in that they represent mosaics of the eight founder lines, they are different from the CC in that each DO mouse has a unique, non-reproducible genome with dramatically increased levels of accumulated recombination [Churchill et al. 2012]. With each mouse harboring around 45 million variants in its genome, there is a high degree of allelic and phenotypic variation within the population. The extent of genotypic and phenotypic diversity, as well as the high frequency of recombination events, is very useful for identifying genetic contributions to traits of interest with high resolution [Svenson et al. 2012].
In the present study, we utilized a cohort of almost 300 DO mice to interrogate the hepatic network of miRNAs associated with circulating lipid levels in diet-induced dyslipidemia. We identify a key co-regulated module of miRNAs that is strongly associated with LDL cholesterol (LDL-C), which is a significant risk factor for many downstream morbidities, including atherosclerosis and metabolic disease.
2.2 MATERIALS AND METHODS
2.2.1 Animals, Diets, and Phenotyping
triglycerides, glucose, and insulin have been provided previously [Smallwood et al. 2014]. For HDL precipitation, 100μL aliquots of blood plasma samples were diluted 1:4 with PBS, combined with 9 μL of Heparin-MnCl2, and centrifuged. Supernatant
was removed and combined with working cholesterol reagent (mixture of reagent, HDCBS, Cholesterol Oxidase, Cholesterol Esterase, and Horseradish Peroxidase)
[Puppione and Charugundla 1994]. Samples were run in triplicate on 96-well flat bottom plates, and absorbance was read at 515nm using BioTek plate reader and Gen5 software. Absorbance values were averaged across triplicates, and
concentrations were calculated. In order to determine VLDL-C/LDL-C levels, HDL-C
was subtracted from total cholesterol. Markers of liver inflammation, alanine aminotransferase (ALT) and aspartate aminotransferase (AST), were measured using a Biolis 24i Analyzer (Carolina Liquid Chemistries, Winston Salem, NC).
2.2.2 RNA Extraction
Livers were flash frozen in liquid nitrogen and subsequently stored at -80 degrees Celsius until their use. Total RNA was isolated by automated
instrumentation from approximately 25 milligrams of liver tissue per sample using Norgen Total RNA Purification Kit (Norgen, Ontario, Canada, Catalog No. 24300). Quant-iTTM RiboGreen from ThermoFisher Scientific (Waltham, MA, Catalog No.
Quality Indicator (RQI) of at least 7.5 or greater were used for microarray and
sequencing.
2.2.3 Microarray
High quality RNA was available from livers of 268 of the 292 DO mice and
was used for microarray gene expression analysis. The RNA was hybridized to
Affymetrix Mouse Gene 2.1 ST 96-Array Plate using the GeneTitan Affymetrix
instrument according to standard manufacturer’s protocol. Robust Multiarray
Average (RMA) method was used to estimate normalized expression levels of
transcripts (median polish and sketch-quantile normalization). Affymetrix Expression
Console software was used for quality control assessment, and as a result, six of the
mice were removed for not passing tests leaving 262 samples to be analyzed. All
probes containing known SNPs from the eight founder inbred mouse strains of the
DO mouse population were masked (165,204 probes) during normalization by
downloading the SNPs from the Sanger sequencing website
[http://www.sanger.ac.uk/science/data/mouse-genomes-project], and overlapping
them with probe sequences. All control probes (190 probes), reporter probes (82
probes), and normalization probes (6,683 probes) were removed from the probe sets
before running WGCNA. Probes were filtered using an expression threshold of a
minimum RMA of 4 in at least one-quarter of the samples, which left 15,105 probes.
Differential expression analysis was performed by Student’s t-test, and p-values
were corrected using the Bonferroni method. Microarray data is available on the
2.2.4 Small RNA-sequencing
High quality RNA was available from livers of 269 of 292 of the DO mice was used for small RNA sequencing (smRNA-seq). Libraries were created using New England Biosciences NEBNext Multiplex Small RNA Library Prep Set for Illumina, and 50bp single-read sequencing was carried out on the Illumina HiSeq platform resulting in an average of over 16 million reads per sample. miRquant 2.0 [Kanke et al. 2016] was used to trim off adapter sequences, align reads to the mouse genome, and quantify miRNAs and their isoforms (termed isomiRs). A previous study in Collaborative Cross mice has shown that miRNAs do not contain variants across founder strains within their seed regions, so reads were aligned to the mm9 mouse genome [Rutledge et al. 2015]. Reads were normalized to reads per millions
mapped to miRNAs (RPMMMs). An expression threshold of at least 50 RPMMMs in at least one-quarter of all samples was set to filter out the lowly expressed miRNAs, which resulted in a set of 246 robustly expressed miRNAs. The results were
Benjamini-Hochberg method. Small RNA-seq data is available on the GEO repository,
accession number GSE99561.
2.2.5 WGCNA
The WGCNA R package was used to identify the co-regulated modules
(CRMs) for miRNAs and genes [Langfelder and Horvath 2008]. Only expression
data from the HFCA-fed mouse samples were used to identify the CRMs.
For the miRNA network analysis, we matched the smRNA-seq samples with
the mice for which phenotypic data was measured, and were left with 256 DO mice,
of which 135 were HFCA-fed mice. The RPMMMs were transformed to log2(x+1)
scale. The soft threshold was chosen by running the pickSoftThreshold function to
find the best fit to a scale-free topology, and beta was set to 14 because it fit with an
R2 value ³ 0.8, and connectivity measures suggested the possibility of identifying
hubs. An adjacency matrix was created using Pearson correlations. From the
adjacency matrix, the topological overlap measure (TOM) was calculated using the
signed method. The dissimilarity measure was calculated by 1-TOM, and this was
used to create a dendrogram according to the Ward’s hierarchical clustering method.
We use Ward’s method instead of the default average method because it considers
the variance in expression between miRNAs before choosing to put them in a clade
together. Thus, miRNAs within the same clade have the lowest variance in
expression possible, which is meaningful for identifying clusters of co-regulated
were left unmerged. Module eigenmiRs (MEms) were calculated using the
moduleEigengenes function, and were correlated with each phenotype measured in
the mice using the biweight midcorrelation. Module significance was also calculated
using biweight midcorrelation method. Modules with the highest correlation or
inverse correlation (coefficient >|0.4|) were taken as those of interest. miRNAs that
were found to have the highest aggregated TOMs within the respective CRMs, the
highest kWithin (intramodular connectivity measure) and the highest Pearson
correlations to their MEms were identified as hub miRNAs. Network files were
exported to Cytoscape [Shannon et al. 2003] for visualization.
For WGCNA on mRNAs, we matched microarray samples with the mice we
have measured phenotypes for, and we were left with 249 DO mice, of which 135
were HFCA-fed mice. We parsed out the top 5,000 most variably expressed mRNAs
within the HFCA samples from the 15,105. We found that a large number of the
mRNAs were not separated into CRMs, but were allocated to an undefined group,
which is where genes are assigned when they cannot be placed into any module.
We gradually reduced the number of mRNAs from 5,000 to 3,000. Using the top
3,000 most variably expressed mRNAs within the HFCA samples allowed for each
gene to be assigned to a specific CRM. Soft threshold beta was set to 9 because it
fit a scale-free topology with an R2 value > 0.8, and connectivity measures suggested the possibility of identifying hub genes. An adjacency matrix was
calculated with Pearson correlations, and the TOM was calculated using the signed
to the Ward’s method of hierarchical clustering. The hybrid tree-cutting algorithm
was used to form the modules, which were left unmerged. Module eigengenes were
calculated and correlated with each phenotype measured in the mice using the
biweight midcorrelation. The same method was used to calculate correlations
between gene CRMs and the brown miRNA CRM. Modules with the highest
correlation or inverse correlation (coefficient >|0.4|) were recognized as those of
potential interest.
2.2.6 Pathway Enrichment Analysis
Enrichr was used to perform pathway enrichment analysis and gene ontology
analysis on the genes within each gene CRM [Chen et al. 2013, Kuleshov et al.
2016].
2.2.7 MicroRNA Target Site Enrichment Analysis
miRhub [Selitsky et al. 2015] was used to perform target site enrichment
analysis for miRNAs. Briefly, miRhub employs a Monte Carlo simulation strategy to
determine which miRNAs, if any, have an over-representation of predicted target
sites at a specified level of conservation in a set of input genes. We ran miRhub on
genes up- and down-regulated in the liver from HFCA-fed mice and required
positional conservation of predicted target sites in at least two mammalian species in
2.3 RESULTS
2.3.1 Effects of a high-fat cholic acid, dyslipidemia-inducing diet on plasma
lipoprotein cholesterol levels in the diversity outbred mouse population
In a previous study [Smallwood et al. 2014], we demonstrated the value of a
specific multi-parental mouse population, the diversity outbred (DO) resource, for
mapping quantitative trait loci (QTL) and identifying candidate genes and potential
therapeutic targets for dyslipidemia and atherosclerosis. An initial cohort of 292 DO
mice comprised of 146 sibling pairs was fed either a high-fat cholic acid containing
diet (HFCA), which induces dyslipidemia, or a calorie-matched high protein diet (HP)
for eighteen weeks. We identified QTLs for atherosclerotic lesion size, pre-diet
circulating triglycerides, and post-diet circulating total cholesterol. In the present
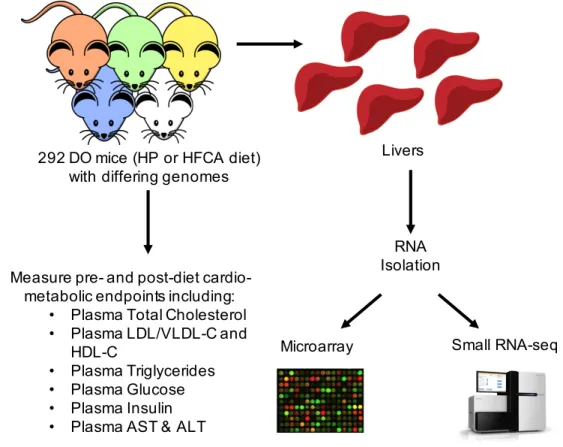
study (Figure 2.1), we have analyzed plasma samples from the same mouse cohort
for several additional cardio-metabolic endpoints, with a primary focus on Very Low
Density Lipoprotein and Low Density Lipoprotein Cholesterol (VLDL/LDL-C), and
High Density Lipoprotein Cholesterol (HDL-C) prior to and after the eighteen-week
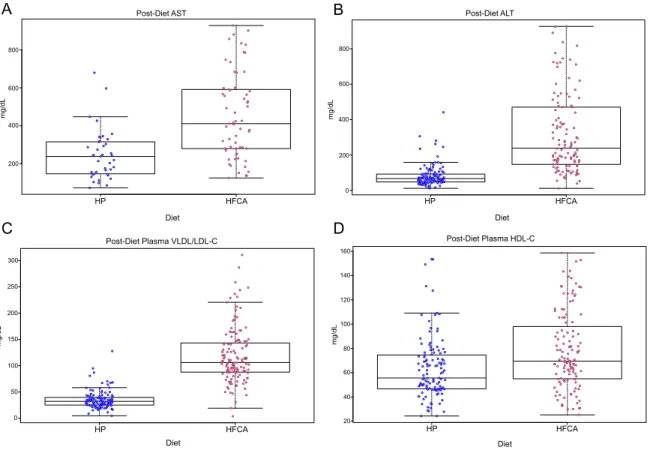
diet exposure. We found that the average levels of alanine aminotransferase (ALT),
aspartate aminotransferase (AST), VLDL/LDL-C, but not HDL-C, are significantly
Notably, all but three of the HFCA-fed mice had higher circulating VLDL/LDL-C
levels than the average level among HP-fed mice. Moreover, VLDL/LDL-C levels
were highly variable among the HFCA-fed mice, ranging from <10 mg/dL to >
300mg/dL (Figure 2C). This finding indicates that effects of the HFCA diet on plasma
VLDL/LDL-C is highly dependent on genetic background.
2.3.2 Effects of the HFCA diet on liver microRNA expression in the DO cohort
Given the importance of the liver in maintaining cholesterol and lipoprotein
homeostasis, and the growing appreciation for miRNAs in the control of cholesterol
metabolism, we reasoned that hepatic miRNAs may associate with the observed
variation in lipid phenotypes, particularly VLDL/LDL-C, across the mice in the DO
cohort. To test this hypothesis, we performed small RNA sequencing (smRNA-seq)
on liver tissue from 269 of the same DO mice at an average depth of 16 million
reads per sample (range 7,662,595 – 30,8861,518 reads). The reads were mapped
to the mouse genome (mm9), and miRNAs and their isoforms (referred to as
isomiRs) were annotated and quantified using miRquant 2.0 [Kanke et al. 2016].
Detailed information on the mapping statistics are provided in online supplemental
Figure 2.1 Summary Diagram of Study Design. 292 DO mice, each having a different composite of the 8 founder mouse strain genomes, were fed either HP or HFCA diet. Cardio-metabolic endpoints were measured before and after diet intervention. RNA was isolated from the livers of each of the mice, and used for microarray analysis to measure gene expression, and small RNA sequencing.
RNA Isolation
Microarray Small RNA-seq 292 DO mice (HP or HFCA diet)
with differing genomes
Livers
Measure pre- and post-diet cardio-metabolic endpoints including:
• Plasma Total Cholesterol • Plasma LDL/VLDL-C and
HDL-C
Figure 2.2: Plasma vLDL/LDL, AST and ALT are dramatically affected by HFCA diet. Box plot of (A) post-diet AST (mg/dL), (B) post-diet ALT (mg/dL), (C) post-diet plasma VLDL/LDL-C (mg/dL), and (D) post-diet plasma HDL-C (mg/dL)
concentration in HP-fed DO mice and HFCA-fed DO mice. Each dot represents one mouse in the respective diet. Hinges of boxplots represent the first and third quartile of expression. HP HFCA 0 50 100 150 200 250 300
Post−Diet LDL−C Levels
Diet
mg/dL
HP HFCA
Diet 0 100 50 150 250 200 300 mg /dL
Post-Diet Plasma VLDL/LDL-C Post-Diet Plasma HDL-C
HP HFCA 20 40 60 80 100 120 140 160
Post−Diet HDL−C Levels
Diet
mg/dL
HP HFCA
Diet 20 40 60 80 100 120 140 160 mg /dL A B HP HFCA 200 400 600 800
Post−Diet AST
Diet
mg/dL
200
HP HFCA
Diet 400 600 800 mg /dL Post-Diet AST HP HFCA 0 200 400 600 800 Post−Diet ALT Diet mg/dL
HP HFCA
To normalize miRNA expression, we used the reads per millions mapped to
miRNAs (RPMMM) method. After filtering out those miRNAs with low levels of
expression across the majority of samples, 246 miRNAs remained (Methods). More
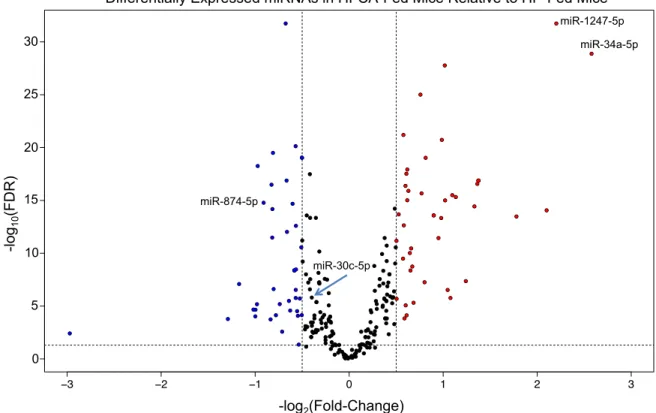
than one-third of these were significantly elevated (fold-change ≥ 1.5, FDR < 0.05) in
the livers of the mice fed the dyslipidemic HFCA diet relative to those fed the HP diet
(Figure 2.3). Specifically, 45 miRNAs were significantly up-regulated, and 39
miRNAs were significantly down-regulated in the HFCA-fed mice. These
differentially expressed miRNAs included several that have previously been
implicated in the development and/or progression of atherosclerosis or
hyperlipidemia. One such miRNA is miR-34a, which is up-regulated in the plasma of
ApoE knockout (KO) C57BL/6 mice [Han et al. 2015], a well-established animal
model of atherosclerosis; in the liver tissue of high-fat diet-fed C57BL/6 mice [Ding et
al. 2015, Fu et al. 2012], a model of hepatic steatosis and obesity; as well as in the
plaques of humans with coronary artery disease [Raitoharju et al. 2011]. We found
that liver miR-34a expression levels in most HFCA diet-fed mice were significantly
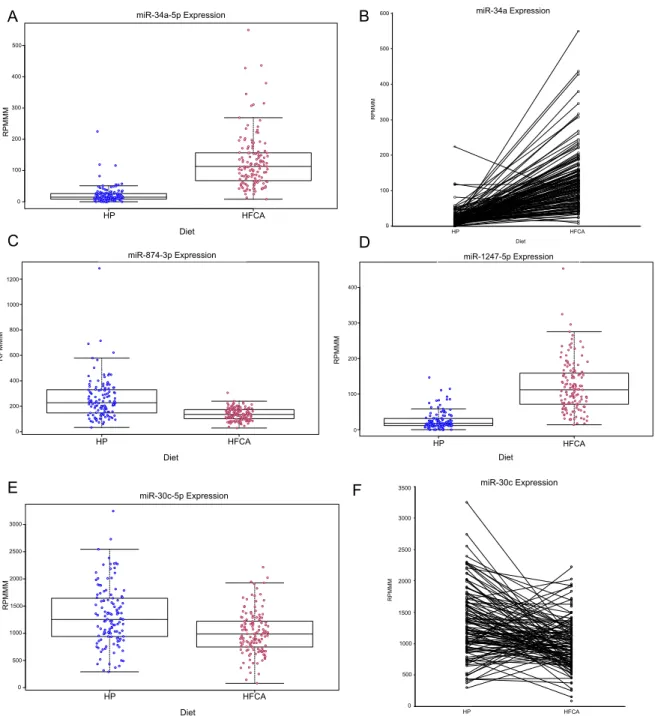
greater than in the HP diet-fed mice (Figure 2.4A). Notably, miR-34a expression in
all but two (98.7%) of the HFCA samples was above the average expression in the
HP-fed mice. In addition, analysis of miR-34a expression within the sibling pairs
shows the majority of the pairs follow the same trend of an increase in miR-34a
expression as a result of HFCA feeding (Figure 2.4B). We also identified other
miRNAs significantly altered by HFCA diet, including several that have not been
down-regulated by almost 2-fold, and miR-1247-5p, which was up-regulated by
>4-fold (Figure 2.4C, D).
The HFCA diet did not universally alter expression for every miRNA, including
miR-30c, which has been shown to be significantly down-regulated in the liver of the
ApoE C57BL/6 KO model. Over-expression of miR-30c mimic can mitigate
hyperlipidemia and regress atherosclerosis in both wild-type and ApoE KO C57BL/6
mice [Soh et al. 2013]. However, in our DO cohort, while there is an expected trend
toward lower liver miR-30c expression in the HFCA-fed mice, the difference is not
substantial and the expression distributions among HFCA- and HP-fed mice are
largely overlapping (Figure 4E). The response of the miR-30c levels to the HFCA
diet is much more mixed than what is seen for miR-34a (Figure 4F). These data
suggest that while the dyslipidemia-inducing diet has a robust effect on liver
miR-34a, the effect on miR-30c may be more dependent on genetic composition than
diet. The extensive variation in hepatic expression that we observed for miRNAs
across the DO mice that were fed the same HFCA diet is likely due to interactions
between the underlying genetics and diet, and it provided a unique opportunity to
identify groups or modules of miRNAs that exhibit highly similar genotype-dependent
2.3.3 Identification of co-regulated microRNA modules and correlation with
lipid phenotypes
We next sought to identify groups, or co-regulated modules (CRMs), of hepatic miRNAs across the HFCA-fed DO mice. We applied the weighted gene co-expression network analysis (WGCNA) [Langfelder and Horvath 2008] to the 246
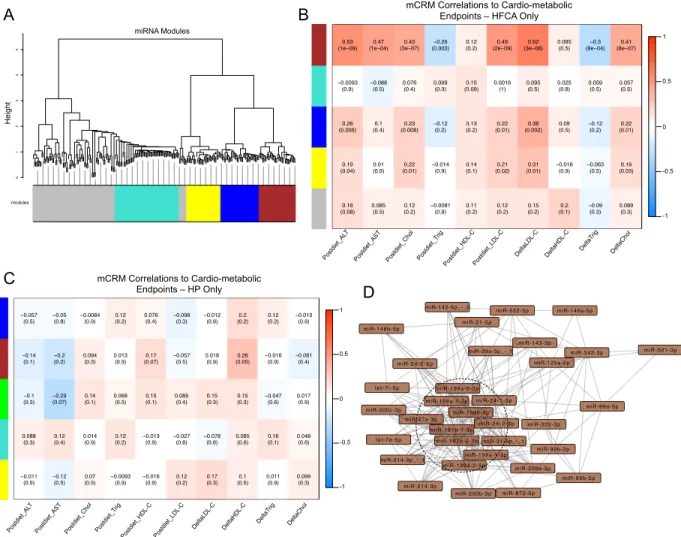
miRNAs robustly expressed in the liver (Methods). This analysis identified five main miRNA CRMs (mCRMs) with anywhere from 32 to 60 miRNAs in each CRM (Figure 2.5A). We then used the biweight midcorrelation (bicor) analysis to assess the extent of correlation between each of these modules and the various endpoints that were
measured in these mice (Methods). We found that one particular module, which we will refer to as the brown module, is comprised of 34 miRNAs/isomiRs, and is highly correlated with important endpoints, most notably post-diet circulating VLDL/LDL-C (bicor coefficient 0.49) (Figure 2.5B). Furthermore, all of the top 20 correlations between any of the 246 miRNAs and any of the endpoints involve miRNAs from the
brown module, and almost all are associated with the diet-induced change in plasma VLDL/LDL-C (Table 2.1).
As a comparison, we performed the WGCNA analysis with the HP-fed mice using the liver expression data for the same 246 miRNAs. Of the five mCRMs that were identified, none were strongly correlated with any of the cardio-metabolic
endpoints that were measured in the mice (Figure 2.5C). Also, none of the mCRMs in the HP-only analysis exhibited substantial overlap with any of the mCRMs
represents an average of just ~20% shared between any one HP mCRM and any one HFCA mCRM). This indicates that the HFCA diet leads to a very specific, robust re-wiring of the regulatory networks governing miRNA expression.
Figure 2.3: Diet alters miRNA expression. Volcano plot of differentially expressed liver miRNAs between HFCA-fed and HP-fed DO mice after filtering out those that were lowly expressed. Each dot represents one miRNA. Red dots are miRNAs that are up-regulated in HFCA-fed mice relative to HP-fed mice with a fold-change of 1.5 or more and an FDR ≤ 0.05. Blue dots are miRNAs that are down-regulated in HFCA-fed mice relative to HP-fed mice with a fold-change of 1.5 or more and an FDR ≤ 0.05. Horizontal dashed line denotes FDR = 0.05. Vertical dashed lines denote fold change of -1.5 (left) and 1.5 (right).
−3 −2 −1 0 1 2 3
0
5
10
15
20
25
30
Differentially Expressed miRNAs in HFCA Diet Compared to HP Diet
log2(FC)
−
log10(FDR)
Differentially Expressed miRNAs in HFCA-Fed Mice Relative to HP-Fed Mice
0 5 10 15 20 25 30
-lo
g10
(F
D
R
)
miR-34a-5p miR-1247-5p
miR-30c-5p miR-874-5p
Figure 2.4: Diet alters expression of specific miRNAs. (A) Box plot of miR-34a-5p. (B) miR-34a-5p expression with lines connecting DO mouse sibling pairs in either diet group. (C-E) Box plot of miR-874-3p, miR-1247-5p, and miR-30c-2-5p expression in HP-fed and HFCA-fed DO mice. For all box plots, each dot represents one mouse in the respective diet. Hinges of boxplots represent the first and third quartile of expression. (F) miR-30c-2-5p expression with lines connecting DO mouse sibling pairs in either diet group.
HP HFCA 0 100 200 300 400 500
miR−34a−5p Expression
Diet RPMMM 0 100 200 300 400 500 R PMMM
HP HFCA
Diet miR-34a-5p Expression HP HFCA 0 500 1000 1500 2000 2500 3000
miR−30c−2−5p Expression
Diet
RPMMM
HP HFCA
Diet R PMMM 0 500 1000 1500 2000 3000 2500 miR-30c-5p Expression
A B
C HP HFCA 0 200 400 600 800 1000 1200
miR−874−3p Expression
Diet RPMMM 0 200 1200 800 400 1000 R PMMM
HP HFCA
Diet 600 miR-874-3p Expression HP HFCA 0 100 200 300 400
miR−1247−5p Expression
Diet RPMMM 0 100 200 300 400 R PMMM
HP HFCA
Diet miR-1247-5p Expression
D
E F
0 100 200 300 400 500 600
HP HFCA
R
PMMM
Diet miR-34a Expression
HP HFCA
Diet R PMMM 0 100 200 300 400 500 600 0 500 1000 1500 2000 2500 3000 3500 HP HFCA RP M M M Diet miR-30c Expression
HP HFCA
Figure 2.5: MiRNA co-expression analysis identifies module associated with
metabolic traits.(A) miRNA modules formed using WGCNA. Only HFCA mice were
used during analysis. RPMMMs were converted using log2(x+1) and used to calculate Pearson correlations. Dendrogram was created using the 1-TOM, and Ward’s method of hierarchical clustering. Modules were formed using the hybrid
tree-cutting function in the WGCNA software package. (B,C) Heatmap of miRNA
module eigenmiRs correlated to cardio-metabolic endpoints measured in the (B) HFCA-fed DO mice and (C) HP-fed DO mice. EigenmiRs were calculated using the WGCNA function moduleEigengenes, and correlated using the biweight
midcorrelation to normalized endpoint values. The intensity of orange or blue
denotes how close the correlation coefficient is to 1 or -1, respectively. Top numbers
are biweight midcorrelation coefficients, bottom numbers are p-values. (D)
Cytoscape visualization of brown mCRM. Each node represents one miRNA. Each edge represents high co-correlation. The dashed circle highlights the hub miRNAs in this module as determined by number of connections and weight of connections.
m i R - 1 9 9 a - 2 - 5 p
m i R - 2 0 0 b - 3 p m i R - 8 7 2 - 5 p miR-200a-3p
m i R - 2 1 4 - 3 p
m i R - 9 9 b - 5 p miR-146a-5p
m i R - 1 4 3 - 3 p m i R - 5 3 2 - 5 p
miR-125a-5p
m i R - 3 4 2 - 3 p m i R - 5 0 1 - 3 p
m i R - 1 8 1 b - 1 - 5 p m i R - 2 4 - 2 - 3 p m i R - 1 9 9 b - 3 p
m i R - 2 4 - 1 - 3 p
miR-27a-3p
miR-99a-5p miR-200c-3p
m i R - 1 9 9 a - 1 - 3 p
m i R - 3 2 2 - 3 p m i R - 2 4 - 2 - 5 p
miR-29a-3p_-_1
l e t - 7 i - 5 p
m i R - 2 1 - 5 p
m i R - 1 9 9 a - 2 - 3 p miR-142-5p_-_2
m i R - 1 4 6 b - 5 p
m i R - 1 8 1 b - 2 - 5 p l e t - 7 e - 5 p
m i R - 1 9 9 a - 1 - 5 p miR-214-3p_-_1
miR-21-5p_-_1
m i R - 9 9 b - 3 p
1
0.5
0
-0.5
-1 mCRM Correlations to Cardio-metabolic
Endpoints – HFCA Only Module Eigengene−Trait Correlations Power=14 − Hybrid
−1 −0.5 0 0.5 1 postdiet_AL T postdiet_AST postdiet_Cholesterolpostdiet_T riglycer ides postdiet_HDL −C postdiet_LDL −C DeltaLDL −C DeltaHDL −C DeltaT riglycer ides DeltaCholesterol 0.53 (1e−09)
0.47 (1e−04)
0.43 (3e−07)
−0.26 (0.003)
0.12 (0.2)
0.49 (2e−09)
0.62 (3e−08)
0.085 (0.5)
−0.3 (8e−04)
0.41 (8e−07)
−0.0093
(0.9) −0.088(0.5) 0.076(0.4) 0.099(0.3) (0.09)0.15 0.0016(1) 0.095(0.5) 0.025(0.8) 0.059(0.5) 0.057(0.5)
0.26
(0.006) (0.4)0.1 (0.008)0.23 −(0.2)0.12 0.13(0.2) (0.01)0.22 (0.002)0.38 0.09(0.5) −(0.2)0.12 (0.01)0.22
0.19
(0.04) 0.01(0.9) (0.01)0.22 −0.014(0.9) 0.14(0.1) (0.02)0.21 (0.01)0.31 −0.016(0.9) −0.063(0.5) (0.03)0.19
0.16 (0.08) 0.085 (0.5) 0.12 (0.2) −0.0081 (0.9) 0.11 (0.2) 0.12 (0.2) 0.15 (0.2) 0.2 (0.1) −0.09 (0.3) 0.089 (0.3) Post diet _AL T Post diet _AST Post diet _Cho l Post diet _Trig Post diet _HDL -C Post diet _LDL -C DeltaLDL -C DeltaHDL -C Delta Trig DeltaChol 0 1 2 3 4 5
miRNA Modules − HFCA Only − Power = 14 Signed − minModule=30 − cutHeight=1.5
hclust (*, "ward") d Height hybridColors modules miRNA Modules Height
m i R - 1 9 9 a - 2 - 5 p
m i R - 2 0 0 b - 3 p m i R - 8 7 2 - 5 p miR-200a-3p m i R - 2 1 4 - 3 p
m i R - 9 9 b - 5 p miR-146a-5p
m i R - 1 4 3 - 3 p m i R - 5 3 2 - 5 p
miR-125a-5p
m i R - 3 4 2 - 3 p m i R - 5 0 1 - 3 p
m i R - 1 8 1 b - 1 - 5 p m i R - 2 4 - 2 - 3 p m i R - 1 9 9 b - 3 p
m i R - 2 4 - 1 - 3 p miR-27a-3p
miR-99a-5p miR-200c-3p
m i R - 1 9 9 a - 1 - 3 p
m i R - 3 2 2 - 3 p m i R - 2 4 - 2 - 5 p
miR-29a-3p_-_1
l e t - 7 i - 5 p
m i R - 2 1 - 5 p
m i R - 1 9 9 a - 2 - 3 p miR-142-5p_-_2 m i R - 1 4 6 b - 5 p
m i R - 1 8 1 b - 2 - 5 p l e t - 7 e - 5 p
m i R - 1 9 9 a - 1 - 5 p miR-214-3p_-_1
miR-21-5p_-_1 m i R - 9 9 b - 3 p
1
0.5
0
-0.5
-1
mCRM Correlations to Cardio-metabolic Endpoints – HFCA Only Module Eigengene−Trait Correlations
Power=14 − Hybrid
−1 −0.5 0 0.5 1 postdiet_AL T postdiet_AST postdiet_Cholesterolpostdiet_T riglycer ides postdiet_HDL −C postdiet_LDL −C DeltaLDL −C DeltaHDL −C DeltaT riglycer ides DeltaCholesterol 0.53 (1e−09)
0.47 (1e−04)
0.43 (3e−07)
−0.26 (0.003)
0.12 (0.2)
0.49 (2e−09)
0.62 (3e−08)
0.085 (0.5)
−0.3 (8e−04)
0.41 (8e−07)
−0.0093 (0.9) −0.088 (0.5) 0.076 (0.4) 0.099 (0.3) 0.15 (0.09) 0.0016 (1) 0.095 (0.5) 0.025 (0.8) 0.059 (0.5) 0.057 (0.5) 0.26
(0.006) (0.4)0.1 (0.008)0.23 −(0.2)0.12 0.13(0.2) (0.01)0.22 (0.002)0.38 0.09(0.5) −(0.2)0.12 (0.01)0.22
0.19
(0.04) 0.01(0.9) (0.01)0.22 −0.014(0.9) 0.14(0.1) (0.02)0.21 (0.01)0.31 −0.016(0.9) −(0.5)0.063 (0.03)0.19
0.16
(0.08) 0.085(0.5) (0.2)0.12 −0.0081(0.9) 0.11(0.2) (0.2)0.12 0.15(0.2) (0.1)0.2 −(0.3)0.09 0.089(0.3)
Post diet _AL T Post diet _AST Post diet _Cho l Post diet _Trig Post diet_H
DL-C Post diet _LDL -C DeltaLDL -C DeltaHDL -C Delta Trig DeltaChol 0 1 2 3 4 5
miRNA Modules − HFCA Only − Power = 14 Signed − minModule=30 − cutHeight=1.5
hclust (*, "ward")d
Height
hybridColors modules
miRNA Modules
Height
mCRM Correlations to Cardio-metabolic Endpoints – HP Only Module Eigengene−Trait Correlations
Power=14 − Hybrid
−1 −0.5 0 0.5 1 postdiet_AL T postdiet_AST postdiet_Cholesterol postdiet_T riglycer ides postdiet_HDL −C postdiet_LDL −C DeltaLDL −C DeltaHDL −C DeltaT riglycer ides DeltaCholesterol −0.057 (0.5) −0.05 (0.8) −0.0084 (0.9) 0.12 (0.2) 0.076 (0.4) −0.098 (0.3) −0.012 (0.9) 0.2 (0.2) 0.12 (0.2) −0.013 (0.9) −0.14 (0.1) −0.2 (0.2) 0.094 (0.3) 0.013 (0.9) 0.17 (0.07) −0.057 (0.5) 0.018 (0.9) 0.28 (0.05) −0.016 (0.9) −0.081 (0.4) −0.1 (0.3) −0.29 (0.07) 0.14 (0.1) 0.068 (0.5) 0.15 (0.1) 0.085 (0.4) 0.15 (0.3) 0.15 (0.3) −0.047 (0.6) 0.017 (0.9) 0.088 (0.3) 0.12 (0.4) 0.014 (0.9) 0.12 (0.2) −0.013 (0.9) −0.027 (0.8) −0.078 (0.6) 0.085 (0.6) 0.16 (0.1) 0.048 (0.6) −0.011 (0.9) −0.12 (0.5) 0.07 (0.5) −0.0093 (0.9) −0.016 (0.9) 0.12 (0.2) 0.17 (0.3) 0.1 (0.5) 0.011 (0.9) 0.099 (0.3) Post diet _AL T Post diet _AST Post diet_C
hol Post diet _Trig Post diet _HDL -C Post diet_L
DL-C DeltaLDL -C DeltaHDL -C Delta Trig DeltaChol -1 -0.5 0 0.5 1
A B
C
2.3.4 Identification of microRNA “hubs” in the brown module correlated with
post-diet plasma VLDL/LDL-C
The strength of connection between miRNAs in an mCRM is indicative of the
extent of co-correlation. The miRNAs with the highest connectivity scores are
defined as “hubs.” To define the miRNA “hubs” in the brown mCRM, we ranked the
miRNAs according to their topological overlap measure (TOM) scores and
intramodular connectivity measures, which are the WGCNA metrics for
interconnectedness. The miRNAs in the 75th percentile were identified as “hubs” in
the brown mCRM: miR-199a, miR-181b, miR-27a, miR-21_-_1, and miR-24. Each of
these miRNAs was very highly correlated with the module eigenmiR, or first principal
component, of the brown module (Figure 2.5D,Table 2.2), with miR-199a being the
most highly correlated (Pearson coefficient = 0.93).
2.3.5 Analysis of gene expression data and identification of several gene
co-regulated modules associated with post-diet LDL-C and inversely
correlated with the brown microRNA module
To determine the effects of the HFCA diet on gene expression, we performed
microarray analysis on 262 liver samples from the DO mice (34,390 mRNAs
detected, 15,105 mRNAs with RMA ≥ 4 in at least one-quarter samples). Differential
expression analysis revealed that 4236 genes were significantly (corrected p-value <
1.20 x 10⁻⁶) up-regulated, of which 401 exhibited a fold-change greater than 2, and