Maureen T. Dostert. To What Extent Does Domain Knowledge Influence Search Stopping Behavior?A Master’s Paper for the M.S. in I.S. degree. May, 2010. 60pages. Advisor: Diane Kelly
Recently, search stopping behavior has gained attention from researchers. The purpose of the present research study was to investigate if users’ level of domain knowledge
influenced when they chose to end a search for information. The topic of stopping behavior was investigated using a convenience sample of 15 third-and fourth-year undergraduate students at a large university. This study investigated how users’ level of domain knowledge influenced their decisions to stop information searches. Subjects were asked to complete four search task in which their completion time was measured.
Subjects also completed questionnaires about their experiences and participated in an exit interview. The results of the study indicated that there was not an association between knowledge level and stopping behavior. However, the results of the study indicated there was a correlation between levels of domain knowledge and levels of interest in domains. There was also a strong correlation between the subjects’ satisfaction with the search process and the retrieved results. Lastly, there was a negative correlation between the subjects’ level of domain knowledge and their task times.
Headings:
by
Maureen T. Dostert
A Master’s paper submitted to the faculty of the School of Information and Library Science of the University of North Carolina at Chapel Hill
in partial fulfillment of the requirements for the degree of Master of Science in
InformationScience.
Chapel Hill, North Carolina
April 2010
Approved by
Table of Contents
Table of Contents ... 1
Introduction ... 2
Literature Review ... 5
What triggers stopping behavior? ... 5
Is stopping behavior predictive? ... 5
What is “good enough” information? ... 7
What are the summaries drawn from this literature review? ... 10
Method ... 11
Study Population ... 11
Procedure ... 12
Questionnaires ... 14
Exit Interviews... 20
Transaction Logs ... 21
Results ... 22
Subjects ... 22
Subjects’ Self‐Assessment of Search Experience for Three Types of Searches ... 23
Subjects’ Self‐Assessment of Computer Experience ... 24
Subjects Self‐Assessment of Search Self‐Efficacy ... 25
Subject’s Self‐Assessment of Level of Domain Knowledge ... 26
Subjects’ Self‐Assessment of Level of Domain Interest ... 28
Subjects’ Self‐Assessment of Satisfaction with the Search Processes/Results ... 29
Subjects’ Self‐Assessment of Satisfaction with the Search Processes ... 29
Subjects’ Self‐Assessment of Satisfaction with the Search Results ... 31
Correlations of Interest, Knowledge, Satisfaction, Results, and Task Times ... 31
Reasons for Stopping Searches ... 32
Correlation of Reasons for Stopping Searches... 33
Search Tasks ... 34
Summary of Responses to Interview Questions ... 36
Discussion and Conclusions ... 40
Assumptions about Subjects ... 41
Discussion of the Study Results ... 42
Positive Correlations between Domain Knowledge and Interest Levels ... 43
Positive Correlations between Satisfaction with the Search Processes and Search Results ... 44
Negative Correlations between Satisfaction with Search Results and Search Task Times ... 47
Positive Correlations Between Reason B and C for Ending Information Searches ... 50
Study Implications ... 51
Limitations of Study ... 52
Potential Future Research ... 53
Conclusion ... 54
Introduction
According to Rainie (2005), director of the Pew Internet and American Life
Project, about 60 million American Internet users have used a search engine to search for
information. They estimate that in 2004, there were approximately 38 million Internet
users. In only one year, by 2005, that number rose to 59 million users (Google is the first
choice and then Yahoo is the second choice of search engines in use) (Rainie, 2005).
While this data does not address search behavior, the data suggests that the number of
Internet users increases each year; therefore, search stopping behavior may be an
important aspect of Internet, Web-based, and online library search behavior. Brown et al.
(2007) define cognitive stopping rules as “A heuristic people invoke to make judgments
about sufficiency” (Brown et al, 2007, pg. 90). Search stopping behaviors are the
cumulative set of actions or reactions that people experience to particular circumstances
that people using cognitive stopping rules as part of the decision-making process to end
searches for information
This study investigates how different criteria (e.g. level of domain knowledge)
influence search stopping behaviors and the reasons people stop information searches in
the context of the Internet and Web-based services such as those found in libraries, digital
libraries, and search databases.
Rainie (2008) finds that people search for information about the problems of daily
living (e.g. education, health, and taxes); these are not ordinary general-interest types of
people have problems searching for topical information about legal action, military
benefits, and education, to name just a few. Rainie (2008) also states that 169 million
adults conduct these more problematic types of searches each year. These are areas of
information searches that libraries and librarians increasing are asked to deliver;
therefore, understanding the unique criteria that affects search stopping behavior in
web-based and library environments is essential to improving the quality of searches for these
169 million adults (Rainie, 2008). Search stopping behavior is a small but important part
of the larger process of search behavior that is required to understand the criteria users
employ to end searches.
Researchers (Brown et al., 2002, 2007; Zach 2005; Berryman, 2008; Toms &
Freund, 2009; Prabha et al, 2007) have identified stopping rules people employ to end
searches for information in an online environment, such as online libraries or the Web.
Users decide during online information searches which documents to review and save,
when to reformulate queries, and when to end searches for information. Users employ
cognitive stopping rules in the decision-making process as they evaluate and re-evaluate
information. While the process of search behavior has been extensively researched, the
process of ending a search or stopping behavior has produced limited research results.
Many researchers, such as Brown (2002, 2007), Zach (2005), and Prabha (2007),
and Marchionini (1995) have investigated to varying degrees those influences on the
decision-making processes users employ throughout the search process. These other
influences include the following:
• Domain knowledge (familiarity with the topic) (Marchionini,1995)
• Complexity of the search task (Brown, 2004, 2007)
• Search experience of the user (Brown, 2004, 2007)
• Satisfaction with the search results (Prabha, 2007)
• Disgust with the search results (Prabha, 2007)
However, one criterion that lacks empirical investigation is the level of domain
knowledge as Marchionini (1995) discusses who defined domain knowledge as the level
of expertise a person possesses about a specific topic (e.g. medicine, sociology). The goal
of this research study then is to investigate how users’ levels of domain knowledge
influences their decisions to stop a search for information. This lack of empirical
evidence provides a key motivating factor for this study.
A study about how domain knowledge influences search stopping behaviors may
help developers of online information systems understand how users behave in
information search settings which might enable them to become more attuned to users’
personal variables and thinking processes. This research may be valuable to those
designing online library and Web-based applications in which their audiences typically
have a wide range of domain knowledge, experience levels, and task knowledge based on
age and education alone. This knowledge might also enable developers to be more
creative in the design of more useful search interfaces that address varying kinds of
search tasks, domain knowledge, results organization, search algorithms, databases
structures, and the creation of new conventions. This may also help librarians better
Literature Review
Researchers listed throughout this literature review approach the study of search
stopping behavior from various perspectives (e.g. triggers and cognitive stopping rules).
Some researchers question whether a predictive nature to stopping behavior exists. A
discussion of users’ perspectives about satisfactory information includes cost-benefit
analyses, role theory, and evaluations about what is good enough information. The
following is a brief discussion of these topics as they relate to current information about
search stopping behavior.
What triggers stopping behavior?
Researchers (Brown et al., 2004, 2007; Toms, 2009; Zach, 2005) investigate
reasons that trigger cognitive stopping rules a user may employ to end an information
search. Brown et al. (2007) define cognitive stopping rules as “A heuristic people invoke
to make judgments about sufficiency” (Brown et al, 2007, pg. 90). Reasons that motivate
a user to end an information search are usually cognitive, motivational, or affective. Our
discussion concerns itself with cognitive stopping rules. Other reasons, such as
motivational reasons, in which there is an external motivating source, such as a deadline;
and affective reasons, such as emotions, all contribute to the desire to end an information
search (Brown et al., 2007). However, to limit the scope and size of this research study,
motivation and affective reasons are not discussed here.
Is stopping behavior predictive?
Researchers such as Toms et al. (2009) and Brown et al. (2004, 2007) try to
through empirical research. Brown et al. (2004, 2007) investigate the relationship
between the complexity of the search task and the search experience of the user, and how
these factors lend a predictive nature to stopping behavior. Brown et al. (2004, 2007)
propose five cognitive stopping rules that users may tacitly employ during an online
information search. Users employ cognitive rules based on how they process information
using their own mental models (cognitive thought processes) about the search processes
For example, Brown et al. (2004 2007) identify task complexity and search experience as
two factors that might predict which cognitive stopping rules users apply to end an
information search. The goal is that this information may assist web designers to design
interfaces that support varying levels of complexity of search tasks along with varying
levels of search experience (Brown et al., 2004, 2007) among users.
Other researchers, who also demonstrate interest in whether stopping behavior
may have a predictive nature, include Toms and Freund (2009) who investigate whether
users unknowingly leave behind behavioral cues in user-transaction logs. The authors
state that three behaviors may predict that a user will stop a search: These are view a
page, view a second page, and follow a link on a page (Toms & Freund, 2009). While
these behaviors are part of the search process, the authors argue that these three behaviors
may represent the users’ moves toward stopping information searches (Toms & Freund,
2009). However, one can argue that any move or any click is one step in a cumulative
series of steps users initiate to end a search.
Prabha et al. (2007) describes other rulespeople employ for stopping information
searches. These rules are the satiation rule, the disgust rule, and the combination rule. The
information. The disgust rule states that users stop a search after they have achieved a
threshold of disgust from reviewing too many non-relevant or repetitive items. The
combination rule states that users stop information searches after a threshold of a
combination of both the satiation and disgust rules are achieved (Kraft & Lee, 1979;
Prabha et al., 2007).
What is “good enough” information?
This discussion of unknown or known, spoken or tacit criteria that comprises
cognitive stopping behavior leads researchers (Zach, 2005; Prabha et al, 2007; Brown et
al, 2004, 2007, Berryman, 2008) to attempt to define exactly what is good enough
information. What is the threshold at which users are satisfied with the amount and
quality of information they collect and thus end information searches? This issue is
addressed in empirical studies by Prabha (2007), Berryman (2005), and Zach (2005),
which will be discussed below. However, a discussion of what is good enough
information must begin with a discussion of the concept of satisficing by Simon (1955).
One researcher often cited is Simon (1955) who theorizes that people satisfice
after they determine the results they achieve are good enough. This behavior may occur
when individuals, for unknown reasons, lack access to all of the available options. Prabha
(2007) argues that these individuals are unable to compare the cost necessary to expend
additional efforts to continue the search for more information and thus, determine if
enough benefits may be achieved to make the effort (cost) worthwhile. However,
Simon’s focus is on the notion that satisficing is an alternative to rational decision
making when searching. Simon emphasizes the notion that people determine if an
goals and satisfy their information needs. This behavior is a cognitive process in which
users alternatively judge back and forth the value of more effort (cost) versus enough
information (benefit). Saad and Russo (1996) state that it is at this point in the
cost-benefit analyses that users must commit to the choices of information they acquire. Thus
stopping behavior indicates a level of commitment to information users’ deem acceptable
as good enough. This commitment occurs before users actually end their searches and
indicates the complexity of the cognitive process, the iterative nature of the decision
process, and the variables users unknowingly and tacitly address when they make
cognitive decision about information (Saad & Russo, 1996).
Saad and Russo (1996) also discover evidence to support the notion that people
establish thresholds of information that once reached, allows them to make decisions. The
authors propose that users address the mental analyses of costs and benefits as part of the
process that leads to stopping. However, if the under- or over-accumulation of
information does not lead to acceptable cost-benefit ratios, then users adapt their behavior
by varying their thresholds. This behavior results in adaptive thresholds (Saad & Russo,
1996).
Brown et al. (2002) corroborate the cost-benefit analysis Saad and Russo (1996)
offer. Brown, et al. (2002) describe stopping rules in the context of the costs and benefits
associated with those users who under- or over-acquire information. Those users who
under-acquire information do so at the cost of collecting insufficient information to make
informed decisions. Those who over-acquire information do so at additional costs of time
Other ways to think about stopping behavior is in the context of Role theory.
Prabha et al. (2007) use Role theory to explain the similarities and differences in the
stopping behavior of students and faculty members. They discovered that the social role
of the subjects affects the stopping behaviors of students and faculty members. Students
have a specific objective to complete a class assignment. However, faculty members
indicate they have more open-ended needs, such as feedback from colleagues, reviewers,
and others (Prabha, 2007).
This study by Prabha et al. (2007) lends support to the notion that context also
influences decision making. Through focus group interviews, they determine that
quantitative data (e.g. number of pages, number of citations, and numeric data) are
sufficient data for students to decide to end searches for information. Qualitative reasons
are information accuracy, repetition, and quality of information. The perspective from the
faculty members is quite different than that of the students; faculty members indicate that
the time available was the most important factor they use to determine when to stop a
search. Qualitative reasons include trustworthiness of source, representative samples,
cutting-edge research, repetition, exhausted information available, and colleagues’
feedback (Prabha et al., 2007).
Berryman (2008) also raises the issue that good enough information is a matter of
context. This means that the information users collect is good enough in one
environmental context but may not be good enough information in another context. For
example, information users collect for a one-page summary report may not be good
Both studies by Zach (2005) and Berryman (2008) provide evidence about the
influences people experience in two specific work domains. Zach (2005) conducts
interviews with 12 arts administrators to understand the decision-making processes they
use to end searches for information. Zach discovers that administrators have a tendency
to rely on their own personal experience as part of the data they use to satisfy an
information need. Zach also found that administrators often satisfice. Administrators
know there is more information available, but it is unnecessary or the benefits of the
additional data are not worth the effort (cost) they must extend. Zach’s study
demonstrates that decision-making processes about when to end information searches has
many contexts and is an iterative process that occurs over varying periods of time, such
as minutes, hours, or days (Zach, 2005).
Similarly, Berryman (2008) conducts interviews of public sector workers to
identify their influences to stop searches. Berryman found the major influences on users
exist in the form of pressure from colleagues and the organizational culture, as well as
inherent properties associated with the work task. These results stress the complexity of
context and social pressures and how these variables influence the criteria people use to
determine to stop searches (Berryman, 2008).
What are the summaries drawn from this literature review?
This study continues along the same lines as other researchers by using a
convenience sample of university students as subjects in a laboratory setting.From these
research studies, the following ideas are summarized:
• Users invariably make cost-benefit analyses while they search for information.
• Information search requires people to adapt their thresholds to determine what
constitutes good enough information.
• The roles of users affect their decision to end a search.
The discussion of the studies informs this research paper by providing context for
the study. Research has been conducted to examine the relationship between users’ level
of domain knowledge and their search tactics (Wildemuth et al., 2004); however, little
empirical research has been conducted on how the levels of domain knowledge influence
users’ decisions to end information searches. Thus, this research seeks to address the
following question: Does users’ domain knowledge influence their search stopping
behavior?
Method
Study Population
The population for this research study was defined as adult third- and fourth-year
undergraduate students who were enrolled at a large university (approximately 29,000
students). This population was further identified as possessing varying levels of domain
knowledge based on their participation in university studies and based on meeting
university requirements for first- and second-year academic coursework to advance to
third- and fourth-year status.
Once the IRB was approved, subjects were recruited through an email to the third-
and fourth-year student body at the university. Inducements of $10 US dollars per subject
were offered for participation in this study. The first 15 students who responded and met
One thing to note is that as subjects arrived, some of them were unaware if they
were second- or third-year students or the number of credits they had completed prior to
the current term of the study. To address this, the researcher asked the subjects for the
number of credits they had completed to verify that they were indeed third- or fourth-year
students and that they had completed greater than 60 credits. This allowed the researcher
to re-categorize students who thought they were second-year based on credits to
third-year status.
Once subjects arrived at the study location, they were given a fact sheet. After
subjects read this form, the subjects’ verbal “I accept” was interpreted by the researcher
as informed consent. A signature was not collected and thus did not tie the subject to any
other information. A signature was only collected to certify that they received the $10
inducement to participate.
Procedure
A controlled laboratory study was used as the principle method. Questionnaires,
transaction logs, and interviews were used as the primary data collection instruments. The
experiment took subjects approximately 30 minutes to complete.
Subjects were scheduled based on the order in which they responded to the
recruitment email. Subjects were rescheduled if their own schedule changed and they
requested a change that could be accommodated. If subjects did not arrive for the study
even after receiving a reminder email, the next subject on the list was selected and
scheduled.
Once subjects arrived at the lab, they were asked to complete the following
1. Demographics questionnaire included general demographic information about the
subject, such as age and sex.
2. Search experience questionnaire included questions about how many hours per
day subjects spent on certain kinds of search tasks.
3. Computer/Internet/Web 2.0 questionnaire included questions about subjects’
knowledge about computers and features associated with the Internet.
4. Search self-efficacy questionnaire included questions about subjects’ beliefs about
their information search abilities.
Subjects were then assigned four search tasks. Before they began each of their
search tasks, they answered two questions about their domain knowledge and interest.
Next, subjects completed the search tasks. Once subjects completed the first search task,
they completed two more questionnaires about their search satisfaction and reasons for
stopping. In addition, subjects’ search task times were recorded using a client-side
transaction logger. This logger recorded keystrokes and mouse clicks, as well as time.
The sequence of events was as follows:
1. Domain knowledge question (pre-search task): A question about subjects’
knowledge about certain domains.
2. Domain interest question (pre-search task): A question about subjects’ interest in
certain domains.
3. One search task: exploratory search to answer a multi-answer question.
4. Search satisfaction (post-search task): Questions about subjects’ satisfaction with
5. Reasonfor stopping (post-search task): Questions about why subjects ended a
search. These steps were repeated with different search tasks (English Literature,
Geometry, Psychology, and Botany) for a total of four search tasks. Search tasks
were counterbalanced among the subjects.
Lastly, an exit interview was conducted and audio-recorded. The results of the
audio-recording were transcribed. The interview included five pre-search and four
post-search result questions.
Once the study data was collected, the data was analyzed and re-analyzed. The
transaction logs were examined for tasks start and end times. The times were entered into
SPSS along with all the other data from the study. Descriptive statistics were calculated
on the demographic data. Descriptive and inferential statistics were calculated on the
search-related data. Lastly, discussions about the data and observations about the results
were written.
Questionnaires
Search Experience
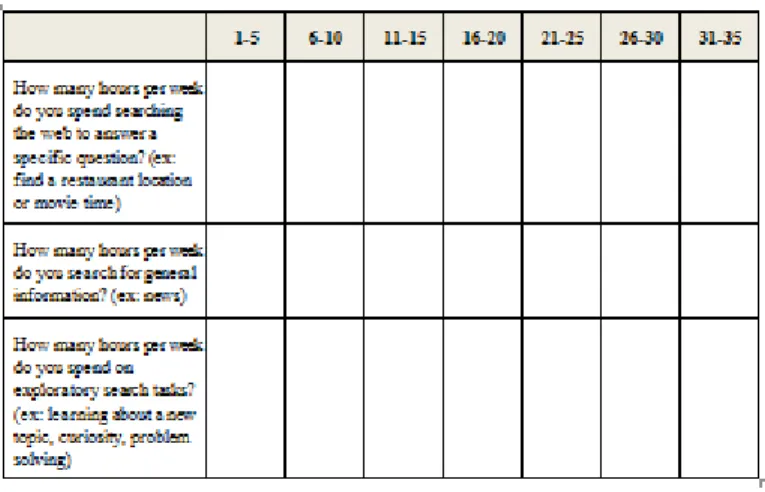
Subject search experience was measured with three questions (Table 1). The first
question measured subjects’ search experience with locating specific information such as
the address, the map, or the phone number of a restaurant. The second question measured
subjects’ search experience with searching for general information such as that found in a
news story, blogs, or electronic publications. The third and last question measured
subject’s search experience with exploring information to learn something new. Subjects
were asked to estimate the number of hours per week, in five-hour increments, they spent
Table 1. Search Experience Questionnaire
Computer/Internet/Web 2.0
Subject computer experience measured eight features associated with Internet and
web search (Table 2). The first four features were general use such as email, video, news
groups, and web search. The last four features were blogging, RSS feeds, collaboration
sites (Wikipedia), andsocial networking sites (Facebook). Subjects were asked to assess
their experience with each feature on a ten-point scale from 1 (No Experience) to 7
(Expert Experience).
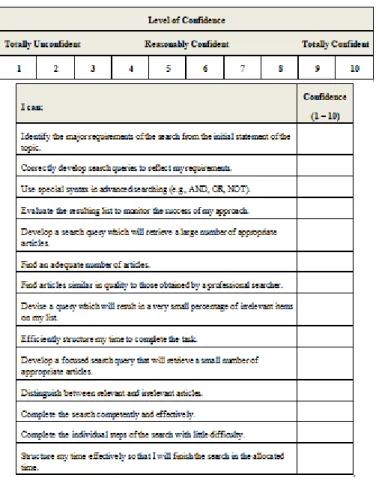
Search Self-Efficacy
Subjects’ search self-efficacy was measured with a questionnaire that was
modified from Debowshi (2001). This questionnaire measured subjects’ beliefs about
their search abilities. It contained fourteen questions (Table 3). Subjects were asked to
assess themselves in response to each statement on a ten-point scale from 1 (Totally
Unconfident) to 10 (Totally Confident).
Table 3. Search Self-Efficacy Questionnaire
Domain Knowledge
Subjects’ level of domain knowledge was measured with a single question (Table
4) that asked them to assess their domain knowledge of the topic based on a five-point
Table 4. Domain Knowledge Question
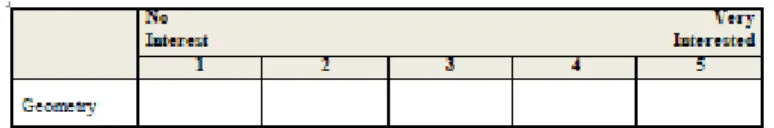
Domain Interest
Subject’sinterest level in a domain was measured with a single question (Table 5)
that asked subjects to assess their interest in the domain based on a five-point scale from
1 (No Interest) to 5 (Very Interested).
Table 5. Domain Interest Questionnaire
Search Tasks
Subjects were asked to conduct search tasks in four domain areas: Botany,
Geometry, English Literature, and Psychology. The domain knowledge areas used in this
research study were selected based on the coursework student should have completed
prior to their third-year of college at this particular university. Thus, the assumption was
that all subjects were familiar with these domains based on courses selected from the
first- and second-year curriculum but that some differences in knowledge and interest
existed.
Each of the four search tasks were developed for this study. Each task contained
instructions for the subjects to locate five pieces of information about a topic within a
domain, with examples of five possible questions included about which they could find
information. The tasks were placed in the context of a larger conceptual framework
within which someone might normally search for information. The questions ranged
contribution to modern life. Tasks were counter-balanced among the subjects to control
for any learning effects that might occur as subjects completed and proceeded from task
to task. The tasks are listed below:
• Search task 1: You are writing a short tourism piece for the state of North
Carolina. You have been requested to write about the Magnolia Grandiflora.
Write down five pieces of information about the Magnolia. A few suggestions
may be what is the Magnolia? What is the genus, where is it found, what are the
flowers like? What types of products are made from the Magnolia?
• Search task 2: You are creating a new dictionary about famous people. You have
been asked to collect some information about your favorite mathematician. You
choose Pythagoras. Write down five pieces of information about Pythagoras. A
few suggestions may be who was he, where was he born, why is he important,
what did he contribute to the world? How did his contribution affect modern life?
Who were his greatest influences?
• Search task 3: You have been tasked with collecting information about a book
you have not heard of: The Sand Pebbles. Write down five pieces of information
about this book and the author. A few suggestions may be who is the author,
when was he born, and why did he write the book? What were his influences and
who were his contemporary writers? What experiences did he draw on to write
the book? What is the significance of this book?
• Search task 4: Today, the field of Psychology has many branches. You are
investigating famous psychologists, such as Carl Jung. Write down five pieces of
psychological concepts credited to Jung? What was the psychometric instrument
created that was credited to the theories of Jung? Who were his contemporaries
and what other psychologists did Jung study with?
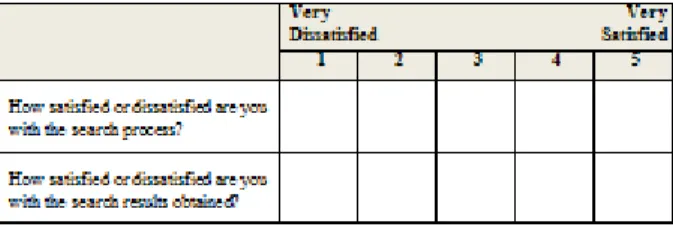
Search Satisfaction
Subjects’ satisfaction with the results of the search tasks was measured with two
questions (Table 6). The first question measured satisfaction with the search process
itself. The second question measured satisfaction with the search results obtained from
the search process. Subjects were asked to assess their satisfaction based on a five-point
scale from 1 (Very Dissatisfied) to 5 (Very Satisfied).
Table 6. Search Satisfaction Questionnaire
Reasons for Ending Searches
Subjects’ reasons for ending searches were measured with five statements
(Table 7): (1) the first statement measured the subject’s perception of using a
predetermined mental list of items in which all of the items on this predetermined list
were checked, much like a list of items was checked off of a to-do-list; (2) The second
statement measured the subjects’ perception of the degree to which the documents listed
were changing by the addition and removal of documents as the subject searched; (3) The
third statement measured the subjects’ perception of whether they were learning anything
new by implying they were no longer finding any new documents that were worth
reviewing; (4) The fourth statement measured the subjects’ perception that the
perception that the information provided an answer to a single-answer question. Subjects
were asked to rate each statement on a five-point scale from 1 (None) to 5 (Very Much).
These items were derived from cognitive stopping rules identified in previous work by
Brown et al., 2004, 2007.
Table 7. Reasons for Stopping a Search Questionnaire
Exit Interviews
An open-ended interview was conducted to draw forth information that might not
be captured in the self-assessment questionnaires or transaction logs (Table 8). Interview
information was developed under influence from interviews conducted by Zach (2005),
Berryman (2008), and Rieh (2004). The interviews were divided into two sections. The
first section contained five questions that were asked to assess how subjects made choices
about which links they selected from the search results displayed by the search engine.
Table 8. Pre-search results interview questions
Pre-results interview questions
1. How did you determine what information to search for to complete the task?
2. Where did you look for information?
3. What criteria did you use to evaluate the search results?
4. Did you know the answer to a question without searching for the answer?
The second set of four questions was asked to examine how subjects selected an
answer from within the documents they retrieved. These questions are displayed in Table
9. The interviews were audio-recorded using the Sound Recorder in the Accessories
folder on Windows Vista and then transcribed into a Word document.
Table 9. Post results interview questions
Post-results interview questions
1. What criteria did you use to decide the answer was the one you wanted?
2. Were you satisfied with the search results?
3. How did you determine the answer was good enough?
4. What did you learn about the topic?
Transaction Logs
The primary goal for using a transaction log was to collect the time when subjects
initiated a search, indicated by the search-task start time, and completed a search
indicated by the search-task end times. This method allowed the researcher to review the
subjects’ search behavior by examining recorded search terms, clicking behaviors, search
paths, and lastly, the URLs visited for each domain.
This method utilized a client-side collection tool, specifically, Jansen’s (2006)
Wrapper, because it was easy to use, it was accessible, and it was unobtrusive throughout
the research study. The transaction log software was created and designed by Jansen
(2006)specifically for researchers. This open-source software works on a Windows
9X/2K/XP platform. In this study, Wrapper was used in a Windows Vista environment in
an emulation mode.
Search tasks were timed using Wrapper transaction log (Jansen, 2006). Subjects
entered “task x” (x being task 1, 2, 3, or 4) before they read the search task. Task time
was measured based on the starting point, task x, and then the last search entry made
prior to starting the next task, task y. At the end of task four, subjects entered “stop now”
in the query box. The last search entered before “stop now” was considered the end time
of the fourth search task.
Results
To reiterate, the goal of this research study was to investigate whether subjects’
levels of domain knowledge influenced their decisions to end searches for information.
The research question asked if there was an association between the users’ level of
domain knowledge and their stopping behavior; specifically, to what extent does the
users’ level of domain knowledge influence when subjects chose to end a search for
information.
Subjects
A total of 15 people (10 females and 5 males) completed this study. One student
was a second-year, five were third-year, and nine were fourth-year students. Their ages
ranged from 19 to 22 with an average age of 20.33 years. All subjects had completed 60
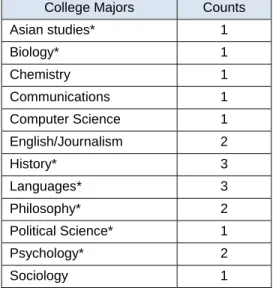
to 120 credits prior to participating in the study. Additionally, the subjects identified a
Table 10. Current college majors indicated by subjects. (*) indicates these major were associated with double-majors; thus, the total subject population displayed in the figure is greater than 15.
College Majors Counts
Asian studies* 1
Biology* 1 Chemistry 1 Communications 1
Computer Science 1
English/Journalism 2
History* 3
Languages* 3 Philosophy* 2
Political Science* 1
Psychology* 2 Sociology 1
While the goal was to recruit third- and fourth-year students, all students who
identified themselves as second-year had completed greater than sixty credits, which
qualified them as year status; thus they were retained and re-categorized as
third-year students for the study.
Subjects’ Self-Assessment of Search Experience for Three Types of Searches
Subjects were asked to estimate how many hours per week, in five-hour
increments, they performed the following three different types of searches:
• searches to answer specific questions (e.g. restaurant location, movie time);
• searches for general information (e.g. news); and
• exploratory searches for new information (e.g. learning about a new topic).
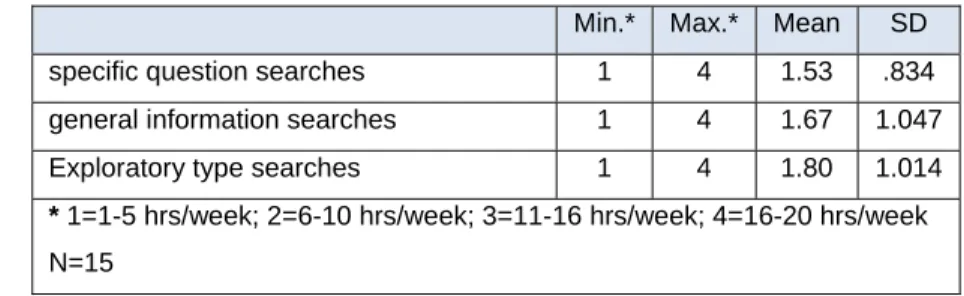
Subjects’ estimated that the time they spent conducting these three types of search
activities were similar. The means and standard deviations (SDs) are shown in Table 11.
Table 11. Means and SDs of hours/week subject spent on three types of searches
Min.* Max.* Mean SD
specific question searches 1 4 1.53 .834
general information searches 1 4 1.67 1.047
Exploratory type searches 1 4 1.80 1.014
* 1=1-5 hrs/week; 2=6-10 hrs/week; 3=11-16 hrs/week; 4=16-20 hrs/week
N=15
The mean data values translate to an approximate range of 1-5 to 16-20 hours per
week in which subjects estimated they conduct these three types of searches. However,
the mean data suggests that subjects spend more time performing exploratory searches
than performing searches to answer general or specific questions. Since exploratory tasks
often take more time due to the very nature of the task than specific question or general
information searches, it is expected that the mean for exploratory search is greater.
Subjects’ Self-Assessment of Computer Experience
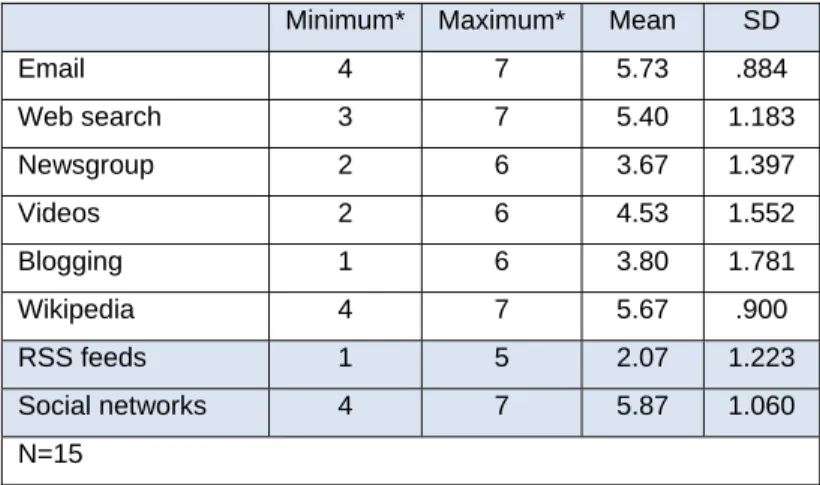
Subjects were asked to assess their computer experience for general uses such as
email, video, news groups, and web search and for their experience with social web
features such as blogging, RSS feeds, collaboration sites (e.g. Wikipedia), andsocial
networking sites (e.g. Facebook). Subjects rated their level of experience with RSS feeds
the lowest, 2.07, which was next to no experience (1) in the Table 12. Subjects rated their
experience with social networks the highest, 5.87, which was next to expert experience
Table 12. Means and SDs for subjects’ self-assessment of computer experience
Minimum* Maximum* Mean SD
Email 4 7 5.73 .884
Web search 3 7 5.40 1.183
Newsgroup 2 6 3.67 1.397
Videos 2 6 4.53 1.552
Blogging 1 6 3.80 1.781
Wikipedia 4 7 5.67 .900
RSS feeds 1 5 2.07 1.223
Social networks 4 7 5.87 1.060
N=15
Interestingly, subjects rated their web search experience as 5.4. Ratings of 5 and 6
were considered greater than average (4) experience but less than expert experience (7).
Web search was the activity in this study in which subjects were requested to engage.
Subjects Self-Assessment of Search Self-Efficacy
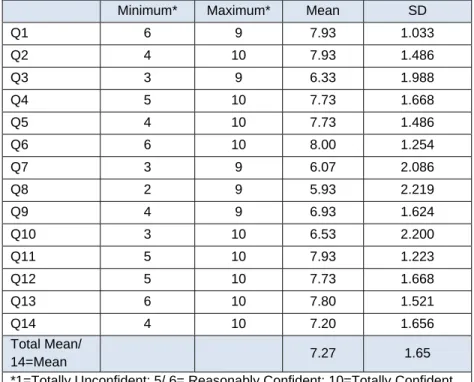
Subjects were asked to assess their own attitudes about how confident they felt
conducting searches for information on the Web. Their responses ranged from two to ten
with a range of means from 5.93 to 8.00 for each of the different items (Table 13). An
assessment of 5 and 6 was identified as reasonably confident and an assessment of 10
was identified as totally confident. An assessment of 1 was identified as totally
unconfident.
The average mean for all 15 responses to all 14 questions was 7.27 with an SD of
1.65. This meant that on the whole, subjects assessed themselves to be more than
reasonably confident to near expert in their abilities to perform different search tasks on
Table 13. Means and SDs for subjects' self-assessment of confidence in conducting searches
Minimum* Maximum* Mean SD
Q1 6 9 7.93 1.033
Q2 4 10 7.93 1.486
Q3 3 9 6.33 1.988
Q4 5 10 7.73 1.668
Q5 4 10 7.73 1.486
Q6 6 10 8.00 1.254
Q7 3 9 6.07 2.086
Q8 2 9 5.93 2.219
Q9 4 9 6.93 1.624
Q10 3 10 6.53 2.200
Q11 5 10 7.93 1.223
Q12 5 10 7.73 1.668
Q13 6 10 7.80 1.521
Q14 4 10 7.20 1.656
Total Mean/
14=Mean 7.27 1.65
*1=Totally Unconfident; 5/ 6= Reasonably Confident; 10=Totally Confident N=15
Subject’s Self-Assessment of Level of Domain Knowledge
Subjects were asked to assess their levels of domain knowledge about the four
search domains: Botany, Geometry, Literature, and Psychology (Table 14). Seven
subjects or 12% of the subjects indicated they possessed no knowledge about Botany and
Geometry. A total of 28% of subjects indicated low levels of knowledge about all four
search domains. A high percentage of subjects, 38% indicated they had an average level
of knowledge about the search domains. Lastly, 20% indicated high knowledge levels
about the search domains. Only one subject expressed expert-level knowledge in one of
Table 14. Counts for subjects’ self-assessments of level of knowledge about search domains Search Domains Knowledge No Knowledge
1 2
Average
3 4
Expert Knowledge
5 Total
Botany 6 8 1 0 0 15
Geometry 1 2 7 5 0 15
Literature 0 3 8 4 0 15
Psychology 0 4 7 3 1 15
Total 7 17 23 12 1 60
% 12% 28% 38% 20% 2% 100%
From the contingency table above, a Chi-square was calculated to examine
whether an association presented between the distributions for search domains and
subjects assessed level of knowledge about the search domains (Table 15). The
chi-square indicated an association between search domain categories and knowledge levels
expressed by the subjects (Chi-square=32.040, df=12, p=.001). The strength of the
association was measured with Cramer’s V=0.422, which indicated moderate strength in
association. Cramer’s V was measured on a scale of 0 to 1 with 0 meaning no association
to 1 meaning perfect association.
Table 15. Chi-square and Fisher’s Exact Test calculations for association between knowledge and domains
Value df
Asymp. Sig. (2-sided)
Exact Sig. (2-sided)
Pearson Chi-Square 32.040 12 .001
Fisher’s Exact Test 28.543 .001
N of Valid Cases 60
Additionally, because the numbers within many of the cells of the table were less
than five, precision was problematic with the chi-square calculation. To evaluate for
association more precisely, a Fishers’ Exact Test was calculated and indicated there was
attributed to chance (Fishers=28.543, p=.001). These tests showed that the distribution of
knowledge across the various domains was significantly different from one another.
Subjects’ Self-Assessment of Level of Domain Interest
Table 16 shows a comparison of subjects’ assessment about their level of interest
in the four domain areas. Many subjects, 45%, indicated they possessed no or low interest
(1, 2) in Botany and Geometry. Only one subject indicated no interest (1) in Literature.
Zero subjects indicated no or low interest in Psychology. The average interest in the four
domains was 27%. Lastly, 28% indicated they were interested or very interested in the
four search domains; however, only one was very interested in Botany and two in
Geometry.
Table 16. Counts for subjects self-assessments of interest in search domains
Search Domains
Interest No Interest
1 2 3 4
Very Interested
5 Total
Botany 4 5 5 0 1 15
Geometry 6 6 1 2 0 15
Literature 1 5 4 1 4 15
Psychology 0 0 6 5 4 15
Total 11 16 16 8 9 60
% 18% 27% 27% 13% 15% 100%
From the contingency table above, a Chi-square was calculated to examine
whether there was an association between the distributions for search domains and
subjects’ expressed interest in the search domains (Table 17). The chi-square indicated
there was an association between search domain categories and subjects’ interest levels in
those domains (Chi-square=29.939, df=12, p=.003). The strength of the association was
association between interest and the domains that is unlikely attributed to chance
(Fishers=29.893, p=.001).
Table 17. Chi-square and Fisher’s Exact Test for association between interest and search domains
Value df
Asymp. Sig. (2-sided)
Exact Sig. (2-sided)
Pearson Chi-Square 29.939a 12 .003
Fisher’s Exact Test 29.893 .001
N of Valid Cases 60
Subjects’ Self-Assessment of Satisfaction with the Search Processes/Results
After each search task, subjects were asked to assess their satisfaction with the
search process and with the search results obtained from the search process as they
completed the search task. The subjects’ rated their satisfaction on a scale of 1 to 5; the
subjects’ average rating was 3.87 for both the search processes and the search results
(Table 18).
Table 18. Means and SDs for self-assessment of satisfaction with search processes and search results
N Min. Max. Mean SD
Satisfied with process 60 2 5 3.87 .947
Satisfied with results 60 2 5 3.87 1.081
Subjects’ Self-Assessment of Satisfaction with the Search Processes
Table 19 displays the counts for the search domains and the subjects’
self-assessment ratings of their satisfaction with the domains for the search tasks. Zero
subjects reported being very dissatisfied (1) with the search process. Only 8% of subjects
indicated they were dissatisfied with the search process. For the most part, 65% of the
subjects were satisfied and very satisfied with the search process. Many subjects, 27%
Figure 1. Mean search satisfaction by domain category
4.0
3.7 3.9 3.9
1.0 2.0 3.0 4.0 5.0
Domain Categories
Mea n Sa ti sfa cti o n Botany Geometry Literature Psychology
Satisfaction levels were easily observable when one compared the mean
satisfaction ratings across the four different search domains as shown in Figure 1.
Clearly, Subjects indicated they were least satisfied with the search task in Geometry.
Table 19. Counts for subjects’ self-assessment of satisfaction with search processes
Search Domains
Satisfaction with Search Process Very
Dissatisfied
1 2 3 4
Very Satisfied
5 Total
Botany 0 0 6 3 6 15
Geometry 0 2 3 7 3 15
Literature 0 2 3 5 5 15
Psychology 0 1 4 6 4 15
Total 0 5 16 21 18 15
% 0 8% 27% 35% 30% 100%
The chi-square was calculated to examine if an association was present between
the search domains and subjects’ satisfaction with the search process. The chi-square
indicated no association between the distributions for the search domain categories and
Subjects’ Self-Assessment of Satisfaction with the Search Results
Table 21 displays results for subjects’ self-assessment ratings for satisfaction with
the search results that displayed as a result of the search process. Zero subjects were very
dissatisfied with the search results. Only 15% of subjects indicated they were dissatisfied
(2) with their search results. For the most part, 65% of the subjects were satisfied and
very satisfied with the search results. However, 20% of subjects indicated they were
neither satisfied nor dissatisfied with the search results.
Table 20. Counts for subjects’ self assessment of satisfaction with search results
Search Domains
Satisfaction with Search Results Very
Dissatisfied
1 2 3 4
Very Satisfied
5 Total
Botany 0 3 3 3 6 15
Geometry 0 2 3 5 5 15
Literature 0 4 3 5 3 15
Psychology 0 0 3 4 8 15
Total 0 9 12 17 22 15
% 0 15% 20% 28% 37% 100%
A chi-square was calculated to examine whether there was an association between
the distributions for the search domain categories and subjects’ satisfaction with the
search results obtained from the search process. Chi-square calculation indicated no
association (Chi-square=6.900, df=9, p=.648).
Correlations of Interest, Knowledge, Satisfaction, Results, and Task Times
A Pearson Correlation indicated there was a positive correlation between domain
knowledge and domain interest (Table 22). Subjects who expressed more interest in a
domain, expressed more knowledge about that domain (r=.418, p=.01). There was also a
strong positive correlation between subjects’ satisfaction with the search process and
Interestingly, there was not a correlation between task times and domain interest,
task times and search satisfaction, task times and knowledge. However, there was a
negative correlation between task times and the satisfaction with search results (r=-.290,
p= 05).
Table 21. Pearson Correlations for interest, knowledge, and satisfaction with search processes
Interest Knowledge
Sat-process Sat-Results task times
Interest Pearson C. 1 .418** .101 .124 -.067
Sig. (2-tailed) .001 .443 .344 .611
N 60 60 60 60 60
Knowledge Pearson C. .418** 1 -.078 .060 -.018
Sig. (2-tailed) .001 .552 .649 .894
N 60 60 60 60 60
Sat_process Pearson C. .101 -.078 1 .760** -.159
Sig. (2-tailed) .443 .552 .000 .225
N 60 60 60 60 60
Sat_results Pearson C. .124 .060 .760** 1 -.294*
Sig. (2-tailed) .344 .649 .000 .023
N 60 60 60 60 60
task times Pearson C. -.067 -.018 -.159 -.294* 1
Sig. (2-tailed) .611 .894 .225 .023
N 60 60 60 60 60
**. Correlation is significant at the 0.01 level (2-tailed).
*Correlation is significant at the 0.05 level (2-tailed).
Reasons for Stopping Searches
After the subjects conducted each of the search tasks for each domain, they were
asked to assess the extent to which each of the listed reasons affected their decision to
end a search. Five reasons for stopping were listed based on categories explicitly stated
from Brown et al. (2007). These are discussed in detail in the Methods section of this
paper. To better understand the subjects’ reasons for stopping an information search for
each of the search domains, a description of the reason follows along with the data in
Table 22. Means and SD of reasons per stopping per category (5-point scale where 1=none and 5=very much)
Botany Geometry Literature Psychology
A. I ended my search for documents
because I satisfied all the items I needed
from my mental list of items.”
Mean S.D 4.33 .976 4.27 .884 4.40 .910 4.13 .990
B. I ended my search for documents
because I retrieved a set of documents that
were no longer changing.
Mean S.D 3.07 1.486 2.60 1.352 2.67 1.345 2.47 1.407
C. I ended my search for documents
because I determined I was no longer
learning anything new.
Mean S.D 3.07 1.387 2.60 1.242 2.80 1.424 2.27 1.163
D. I ended my search for documents
because I skimmed the documents and
determined what I had was “good enough.
Mean S.D 4.53 .743 4.33 .724 4.13 .990 4.27 .704
D. I ended my search for documents
because I found the answer to a question
that required a single answer.
Mean S.D 3.20 1.656 3.40 1.352 3.20 1.568 3.13 1.302
Correlation of Reasons for Stopping Searches
There were no correlations between reasons for stopping and task times; however,
Table 24 shows a moderate positive correlation was calculated between reason B and
reason C (r=.797, p=.01). The means for reasons B and C across the four domains were
also very similar.
Table 23. Pearson Correlation for reason B and C
Reason b Reason c
Reason b Pearson C. 1 .797**
Sig. (2-tailed) .001
N 60 60
The reason for this correlation might be that conceptually similar events (e.g.
document not changing) were not clearly discernable enough for subjects to understand
the differences between the two reasons. One item stated documents were not changing
enough while the other item stated that documents were not changing enough for subjects
of documents and if the subjects changed their behavior based on these observations.
Thus, the idea was erroneously postulated that the subjects interpreted the two reasons as
a different way of stating the same idea.
Search Tasks
The primary purpose of this study was to assess whether there was an association
between users’ level of domain knowledge and whether it influenced search stopping
behavior which in this case was when people stopped an information search. Among the
15 subjects, a total of 60 search tasks were conducted within four different search
domains. The mean task time among the 60 tasks was 3.9759 minutes with a range of .20
to 16.75 minutes. The SD was 3.145 minutes. However, the variance was 10.015 minutes,
which was an unbiased estimate of the SD for the total 60 tasks without regard for
category (Babbie, 2007). This value means that the variation from the mean was greater
than the SD indicated for these tasks.
Thus the median task time was also calculated and was 3.36 minutes with ranges
from .32 to 6.50. Task-times were shown to present a multi-modal population as shown
in Table 25. For all 60 task times, each task time was unique with the exception of the
Table 24. Measures of Central Tendency and SD for the time taken to complete search tasks in all domains (time in minutes-no seconds).
N Min. Max. Mode* Median Mean SD Variance
Task Times
(in minutes) 60 .20 16.75
40, .68, .77,
3.60, 4.77,
6.85
3.3600 3.9759 3.16457 10.015
Valid N 60
(*) means that there are multi-modes for this set of data. Each mode represents 3.3% of the data points in
the data sets. All other data points represent 1.7% of the data set.
When the mean task times specific for each domain were calculated, Geometry,
showed the longest mean search times (4:37 min:sec) while Psychology showed the
shortest mean search times (2:42 min:sec). This information is shown in Figure 2.
Figure 2. Mean task times for domain-specific searches in minutes and seconds
4:08 4:37 4:28
2:42 0:00 1:12 2:24 3:36 4:48 6:00 Domain Categories Me an Task Ti m e (m in: se c) Botany Geometry Literature Psychology
The results indicated the mean shortest search time (2:42) was in Psychology. The
longest task time was in Geometry (4:37). Figure 3 displays the mean task times per
category and those data points within 95% of the means. Geometry displayed the greatest
Figure 3. Mean task time plus 2 SD per category
The ANOVA compared the means of categorical groups that represented the
independent variables (domains of Botany, Geometry, Literature, and Psychology) and
compared how much each group differed from one another in terms of a dependent
variable, in this case, task time (Table 26). The ANOVA showed that the results were
not significant.
Table 25. Between and within group ANOVA results
Sum of Squares df Mean Square F Sig.
Between Groups 34.024 3 11.341 1.154 .335
Within Groups 550.140 56 9.824
Total 584.164 59
Summary of Responses to Interview Questions
Because we do not really know the motivation for people to stop an information
search, it seemed to be reasonable to collect qualitative data to explore users’ thinking
processes for making such decisions. This study resulted in the collection of qualitative
Pre-results: questions about the process of investigating the answer to a task question
1. How did you determine what info to search for to complete the task?
Most of the subjects indicated they chose queries terms based on what seemed to
be most important in the search tasks presented. What seemed to be most important to the
subjects was that they obtain a general review or general knowledge about the terms
suggested in the scenarios. Searches were conducted mostly by reading the scenario and
then choosing the key terms to use as query terms in Google. From the sites listed by
Google, subjects identified those websites that would contain general information.
Subjects also indicated they looked for biographies. If the query terms did not retrieve
relevant documents, then they would add more search terms to the initial term.
2. Where did you look for information?
All subjects (100%) indicated they searched Google and then chose Wikipedia
form the list of retrieved results. One subject indicated Wikipedia was biased but it was
still usable for general information. Another subject stated Wikipedia provided a good
overview. And another subject stated he never exclusively relied on Wikipedia. Subjects
indicated they selected other sites from the list such as those that had an .edu extension,
Britannica, ask.com or reputable sources such as those associated with Stanford
University.
3. What criteria did you use to evaluate the search results?
One subject indicated he trusted Wikipedia completely, while another stated she
chose to trust Wikipedia although she knew it was not the safest. Others indicated they
scanned the headings for keywords and choose selections based on what seemed true.
ending with .edu, Britannica, scientific databases. One subjects indicated he choose by
what was most accessible and easily listed info he could process based on its
organization.
4. Did you know the answer to a question without searching for the answer?
Most subjects indicated they were familiar with Carl Jung. A few subjects
indicated they were familiar with Pythagoras and the Magnolia. None of the subjects
(100%) were familiar with The Sand Pebbles.
5. If you were familiar with the topic, where/how did you search for information?
Most of the subjects indicated they would still use the same search method and
use Google and Wikipedia as sources. A few subjects indicated they would place
bibliography next to the name of the person in the search field, or pair other search terms
to make the search more specific.
Post results: questions about the process of deciding upon the answer that will answer
the task question
1. What criteria did you use to decide the answer was the one you wanted?
Most subjects indicated they would choose the answer that seemed most relevant
and that would answer the question. Other subjects indicated they were more casual in
their responses and indicated if the answer seemed plausible, they would use it. A few
subjects indicated they would look for keywords that were the same as those in the search
tasks. And lastly, a few subjects indicated they would check two to three citations to
2. Were you satisfied with the search results?
All subjects were satisfied with their search results with a few exceptions. One
subject was frustrated because Google has a lot of “junk” and all search paths lead to
Wikipedia. One subject indicated he felt he was not as good a searcher as he thought he
was because he was not finding the results he wanted. Another indicated for the most part
he was satisfied but would not use Wikipedia if it was a research paper. The most
troublesome issue was to find information for The Sand Pebbles that was book-related
instead of the movie.
3. How did you determine the answer was good enough?
Most subjects indicated they felt the answer was good enough if it answered a
question that was basic information that someone would want to know, and was relevant
to the topic. Other subjects commented that if they felt there was enough information
there and they understood what they were reading and had no more questions. A few
subjects indicated they trusted the web site (one subject indicated he trusted Wikipedia),
or if the answer could be corroborated by another source and it made sense within the
scenario given. The implication is that if it is explained well, then the information might
be more credible and thus it was usable information.
4. What did you learn about the topic?
For the most part, all subjects (100%) indicated they learned new information
from completing these search tasks. About half of the subjects described all of the
information they learned and were somewhat enthused about the new information as they
described it. Other subjects indicated the keywords in the domains as having learned
stated that they learned basic information or one stated I learned the facts that I wrote
down during the search task or yes, I learned information about all of the domains.
Discussion and Conclusions
The literature review in this paper provided a discussion around some of the
influences that researchers proposed comprise part of the information search processes
and contributed to people ending information searches. Users’ complex behaviors were
influenced by many internal and external variables. This complexity was reflected in
those behaviors associated with search stopping behavior. Search stopping behavior had
become associated with those heuristics that people knowingly or unknowingly use to
end information searches.
This literature review examined the types of tacit thought processes that
influenced people throughout the search process resulting in their decisions to end
information search tasks. For example, the satiation rule stated that people ended searches
once they became satisfied with the search results while the disgust rule stated that people
ended searches once they became disgusted with the search. Researchers have also
investigated the idea that stopping behavior had a predicative quality that had not yet
been empirically investigated and measured. Brown et al. (2004, 2007) suggested levels
of complexity and levels of task experience were inversely proportional when they
influenced when people determined to end searches, thus lending a predictive nature to
stopping behavior. Lastly, researchers theorized about how people decide they have
enough information to end searches by conducting cost-benefit analyses and making
Empirical research suggested ways in which domain knowledge might
influence search behavior which supports thinking about search stopping behaviors.
Wildemuth (2009) conducted an empirical study to investigate how domain knowledge
influenced the search process. One idea from this study was that those users with greater
experience in a knowledge domain might approach the search process differently than
those who were novices to the domain so domain knowledge influenced the search
processes users employed. However, empirical research was lacking that serves to
address if and how users’ level of knowledge influenced their thinking processes to make
decisions to end an information search.
Assumptions about Subjects
Subjects enrolled in this study indicated they spent about 1-5 to 16-20 hours per
week in which they conducted three types of searches with more time spent on
exploratory search tasks. Subjects rated their computer experience, specifically their web
search experience as greater than average but less than expert level. Web search was the
activity in this study in which subjects were requested to engage. The mean self-efficacy
for all 15 subjects’ responses was 7.27. On the whole, subjects assessed themselves as
more than reasonably confident to near expert in their abilities to perform different search
tasks on the Internet. This suggested that the researchers might review the data from the
study in the context of a sample population who was considered skilled with computer
search activities and confident in their abilities to conduct search activities on the Web. It
Discussion of the Study Results
Because stopping behavior was a small but significant part of the search process,
the lack of empirical studies in search stopping behavior in the research literature fueled
the thinking for the design of this study. Additionally, as was found in this study, search
stopping behavior was complex and not reliant on any one variable. What is the
relationship between the subjects’ level of domain knowledge and their search stopping
behavior represented by task times?
The ANOVA (F ratio =1.154, p =.335) was calculated and indicated the between
group differences were sensitive to the intervention effects of the subjects’ levels of
domain knowledge (F value was greater than 1). This might mean that the intervention of
domain knowledge technically influenced search task times. However, the p value
indicated the differences between the means were not significant; therefore, levels of
domain knowledge might influence search stopping behavior, but if so, it was not a
statistically significant influence.
This means that the differences due to domain categories were not significant in
this study. Subjects’ knowledge about domains had little if any relation to the times taken
to complete search tasks. Geometry had the longest search time (as shown in Figure 1.).
Only 20% of subjects indicated they had an average or greater interest. Many subjects,
80%, indicated an average or greater than average knowledge level about Geometry.
However, subjects indicated they were least satisfied with their search results for
Geometry. To summarize, Geometry had long search times, high knowledge levels, low
does not support the notion that the subjects’ level of domain knowledge influences the
decision to end an information search.
In contrast, Psychology had the shortest search time. Subjects indicated they had
the greatest satisfaction with search results (as shown in Figure 1.). Interestingly, 73% of
subjects indicated average and greater than average knowledge about Psychology. To
summarize, Psychology had short search times, high knowledge levels, high interest
levels, and high satisfaction with the search results. However, the high knowledge level
does not account for the shorter search times. This data highlighted other relationships
and influences that might shed light on those influences people used to end information
searches.
Positive Correlations between Domain Knowledge and Interest Levels
Interestingly, the results obtained from this study indicate there was a moderate
association between subjects’ level of domain knowledge and their level of interest in a
domain. Subjects who expressed interest in a domain and knowledge about a domain
were positively correlated (r=.418, p<0.01). This might mean that subjects were
interested in domains for which they were knowledgeable or that they were
knowledgeable about those domains for which they were interested.
This interpretation might make sense if one expected that students enrolled in
courses for which they were interested and avoided those in which they were
uninterested. Hence, if they enrolled in courses of interest, then their level of knowledge
increased. The converse might also be true that courses in which students avoided due to