PARTNER SUPPORT AND POSTPARTUM WEIGHT RETENTION IN THE PREGNANCY, INFECTION AND NUTRITION (PIN) POSTPARTUM STUDY
by
Taylor Marie Snyder
A paper presented to the faculty of The University of North Carolina at Chapel Hill in partial fulfillment of the requirements for the degree of Master of Public Health in the Department of Maternal and Child Health.
Chapel Hill, N.C.
April 5, 2013
2 ABSTRACT
Objective: To examine the relationship between partner support and postpartum weight retention.
Methods: An analysis was performed on data from the Pregnancy, Infection and Nutrition (PIN) Postpartum Study. This data included medical records and responses to in-home interviews
conducted with 688 and 550 women at 3 and 12 months postpartum, respectively.
Results: One year after childbirth, unmarried women weighed an average of 14.63 lbs above their pre-pregnancy weight, 10.5 lbs more on average than married women. Among women with
men acting as their children’s father: 61.1% of experienced some positive partner support and
15.9% reported some negative partner support around weight goals.
Conclusions:General partner support was correlated with decreased weight retention. No specific partner behavior was identified as an independently significant predictor of weight
3 TABLEOFCONTENTS
ABSTRACT ... 2
PROBLEM STATEMENT ... 4
LITERATURE REVIEW ... 5
HYPOTHESES ... 7
FIGURE 1.CONCEPTUAL MODEL METHODS ... 8
DESIGN AND SAMPLING DATA COLLECTION DATA ANALYSIS RESULTS ... 12
TABLE 1.PARTICIPANT CHARACTERISTICS GENERAL SUPPORT:HELPS/HINDERS ACTIVITY FIGURE 2.GENERAL SUPPORT REASON FOR ACTIVITY AT 3MONTHS POSTPARTUM FIGURE 3.GENERAL SUPPORT REASON FOR ACTIVITY AT 12MONTHS POSTPARTUM TABLE 2.PARTNER SUPPORT AND WEIGHT RETENTION AT 3MONTHS POSTPARTUM TABLE 3.PARTNER SUPPORT AND WEIGHT RETENTION AT 12MONTHS POSTPARTUM FIGURE 4.GENERAL SUPPORT BARRIERS TO ACTIVITY AT 12MONTHS POSTPARTUM MARITAL STATUS:WEIGHT RETENTION TABLE 4.MARITAL STATUS AND WEIGHT RETENTION AT 3MONTHS POSTPARTUM TABLE 5.MARITAL STATUS AND WEIGHT RETENTION AT 12MONTHS POSTPARTUM FATHER SUPPORT:HELP YOU IN YOUR EFFORTS ACHIEVE AND STAY AT DESIRED WEIGHT FIGURE 5.FATHER SUPPORT FOR DESIRED WEIGHT AT 12MONTHS POSTPARTUM TABLE 6.FATHER DOESN'T DO ANYTHING TO SUPPORT WEIGHT AND WEIGHT TABLE 7. FATHER PROVIDES MOTHER WITH FREE TIME TO EXERCISE AND WEIGHT TABLE 8.FATHER EXERCISES WITH MOTHER AND WEIGHT TABLE 9.FATHER COOKS HEALTHY,LOW FAT MEALS AND WEIGHT FATHER SUPPORT:HINDER YOUR EFFORTS TO ACHIEVE AND STAY AT DESIRED WEIGHT FIGURE 6.FATHER HINDERS ACTIONS FOR DESIRED WEIGHT TABLE 10.FATHER DOESN'T DO ANYTHING TO HINDER AND WEIGHT TABLE 11.FATHER INFLUENCES POOR NUTRITION AND WEIGHT DISCUSSION ... 24
RECOMMENDATIONS FOR FUTURE RESEARCH ... 27
CONCLUSION ... 28
REFERENCES ... 31
4
PROBLEMSTATEMENT
The obesity epidemic is a dramatically increasing problem for women of childbearing
age, as 35.8% of US women over 20 are obese (2009-2010, age-adjusted) (1). The 7.3% increase
in the proportion of obese US women in just 10 years (1999-2000 to 2009-2010) calls for urgent
action to identify and resolve the underlying causes of this massive societal problem (1). This
includes uncovering elements contributing to weight retention postpartum, as mothers’
gestational weight retention is associated with overweight up to fifteen years post-pregnancy (2).
Women who retain postpartum weight are at elevated risk, not only for obesity, but also for
lifelong health complications, such as metabolic syndrome, and cardiovascular disease (2, 3).
Data from the 2004-2006 Pregnancy Nutrition Surveillance System (PNSS) found that women
retained 11.8 lbs on average six months or more after childbirth (4). About 25% retained over 20
lbs, with black women holding onto more weight than white and Hispanic women across all
weight categories (4).
Women who retain their gestational weight gain are likely to carry this excess weight into
subsequent pregnancies (2, 5), continuing a cycle of maternal obesity and related co-morbidities.
Obesity during pregnancy has been associated with increased risks of gestational diabetes,
gestational hypertension, pre-eclampsia, delivery by cesarean section, postpartum anemia, birth
defects, fetal macrosomia, perinatal deaths, and childhood obesity among offspring (6, 7). The
development of obesity is also incredibly concerning over the life course, as it can also
contribute to a variety of other health problems, such as type 2 diabetes, hypertension, and
cardiovascular disease (1, 2, 8). Thus, it is vital to identify factors that influence postpartum
weight retention in order to prevent pregnancy from being a pathway to overweight or obesity,
5
LITERATUREREVIEW
The impact of partner support on postpartum weight retention is a critical area of
research, as inadequate social support is one of the main variables correlated with weight
retention (9). Several studies support that married women retain less weight in the postpartum
period (8, 10). Whereas, women who have fewer supportive relationships have been shown to
have higher levels of postpartum weight retention (9). Social support, including support from
partners, is a major positive influence on both adult diet and exercise (1, 11). Evidence is lacking
on specific types of partner support’s influence on postpartum weight retention.
Partner support has been cited as a critical factor, and sometimes the most influential
social factor, in women’s decision to breastfeed (12, 13). Breastfeeding is often proposed as a
weight loss technique after childbirth due to the calories burned while breastfeeding (14). Several
studies concur that more frequent and longer durations of breastfeeding are associated with
lowering and eliminating postpartum weight retention in certain populations (10, 15, 16) It is
clear that breastfeeding provides numerous benefits for mothers and their offspring (17). Yet, Dr.
Allison Stuebe’s 2013 evidence review on breastfeeding and obesity came to an inconclusive
result on breastfeeding’s influence on maternal obesity (18). Until conclusive evidence is
available, understanding partner support for behaviors directly linked to obesity may further aid
women.
Decreasing the volume of calories consumed and increasing energy expenditure through
exercise are both associated with weight loss, as they can lead to the net calories consumed being
less than those expended (1). For women who are overweight or obese postpartum, substantial
energy restriction is required to achieve weight loss (15-18). Studies examining the first year
after delivery have demonstrated that moderate-intensity exercise has beneficial effects on
6
losing weight postpartum that include both nutrition and exercise proved more effective than
modifying diet alone at reducing postpartum weight retention (3, 20-22). Nuances of this
relationship were further explored by Davenport et al., who found that that nutrition control and
moderate-intensity exercise would have the greatest improvement in postpartum weight loss and
chronic disease risk factors, versus low-intensity exercise (3). Previous studies on exercise have
mostly been small and primarily focused on recreational physical activities, while few
ascertained information on overall physical activity (13).
Barriers to making good choices are uniquely experienced by women in the postpartum
period (2). Prospective and retrospective studies have inconsistently shown that decreased,
increased, or unchanged physical activity levels occur at postpartum compared to pre-pregnancy
or pregnancy activity levels (19, 20). The Physical Activity Guidelines for Americans that was
released in 2008 recommended women over six weeks postpartum engage in 150 minutes of
moderate aerobic activity spread throughout the week (20). Despite several attempts to make
these guidelines clearer in that they also apply to activity in the postpartum period, confusion
persists among mothers and health practitioners (20, 23).
Evidence indicates that the perinatal period is a particularly good time to influence
women’s nutritional decision making, as women report being more aware of choices they are
making that may influence their health, and the health of their infant, during this time than at
other times in their life (2). Mothers need support to understand and face the unique obstacles
they encounter. Thus, the primary purpose of this paper is to better understand how the presence
of partner support influences weight retained by mothers. The frequencies of several specific
supportive and hindering activities will be reviewed, as will how those activities correspond to
7 HYPOTHESES
It is hypothesized that positive partner support is correlated with decrease postpartum
weight retention. This paper defines having partner support in two ways: a woman being married
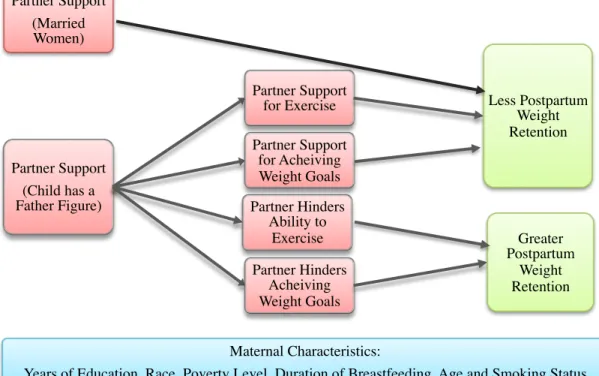
or a woman reporting that there is a man acting as the child’s father. Figure 1 indicates a
relationship between married women and less postpartum weight retention. The Conceptual
Model also highlights four factors predicted to mediate the degree of maternal weight retention
in women who have a man acting as their child’s father. Women with partner support for either
achieving their desired weight or for exercise are linked to less postpartum weight retention.
Inversely, women whose partners hinder their abilities to exercise or achieve their desired weight
are related to more weight retention. External influences on this model include the maternal
characteristics of: years of education, race, poverty level, breastfeeding duration, age, and
smoking status.
Figure 1. Conceptual Model
Partner Support (Child has a Father Figure)
Partner Support
for Exercise Less Postpartum Weight Retention Partner Support
for Acheiving Weight Goals
Partner Hinders Ability to
Exercise
Partner Hinders Acheiving Weight Goals
Greater Postpartum
Weight Retention Partner Support
(Married Women)
Maternal Characteristics:
Years of Education, Race, Poverty Level, Duration of Breastfeeding, Age and Smoking Status
8 METHODS:STUDYDESIGN&SAMPLING
Data used in these analyses are from the Pregnancy, Infection, and Nutrition (PIN)
Postpartum Study conducted with patients at University of North Carolina (UNC) Hospitals.
Women were recruited for PIN Postpartum from the prenatal cohort from 2000-2005 (PIN3 and
PIN3plus studies). Study staff approached eligible women at UNC hospitals during prenatal
visits occurring before 20 weeks gestation. Eligibility criteria included being over age 16,
speaking English, having a singleton pregnancy, being under 20 weeks gestational age, and
planning to continue care or delivery at the study site. Women signed informed consent forms
after agreeing to participate in the study and prior to data collection. Prenatal data were obtained
from clinical visits, telephone interviews, and self-administered questionnaires. Women who
delivered a live born infant and lived in the study’s catchment area (a two-hour driving radius
from UNC) between October 2002 and December 2005 were eligible to participate in the
postpartum study. Study protocols were reviewed and approved by the Institutional Review
Board of the University of North Carolina at Chapel Hill School of Medicine. (24)
Of the 2,006 expectant mothers recruited from the PIN3 in the prenatal study, 1,169
women were eligible for the PIN Postpartum Study, and 938 were invited to participate. 688
(73.3%) participated in the home interview at 3 months postpartum. 550 women completed the
interview at one year postpartum. Reasons for attrition included loss of pregnancy, becoming
pregnant prior to one year postpartum, moving out of the catchment area, and requesting no
further contact. There were no major differences between the sociodemographic characteristics
of those who remained in the group compared with those who left prior to the first interview. The
main difference between the populations was that nonparticipants experienced more preterm
9
METHODS:DATACOLLECTION
Medical charts and in-home interviews were used to ascertain a large volume of
information about the women in the postpartum period. Information obtained included
assessments of maternal height, weight, and body fat percentage; diet, physical activity,
breastfeeding, psychosocial measures, body image, behaviors, health, and work status.
Pre-pregnancy weight was self-reported, while weight at interview periods was systematically
obtained. Study participants received varying amounts of compensation in the form of money
and gifts for each study-related interview.
For the topic of general support, the study asked all participants a positive general
support question at two time periods. When asked: “(Since our last visit with you,) what is the
one main reason that helps you to be more active since delivery, either during work or
nonworking time?” participants could select from 17 different responses. Participants could
choose up 5 options, with choices including: “More Time” and “To improve my health”. A
general negative support question was also asked to all participants: “(Since our last visit with
you,) what is the one main reason that makes it harder for you to be more active, either during
work or nonworking time?” Participants could again select up to 5 answers. The 15 different
responses they could choose from included: “Carrying for Baby or Multiple Children” and
“Don’t enjoy or want to be active”. Both set of responses included an “other” category, allowing
for an open-ended response.
Women reporting having a man acting as the child’s father were asked: “Does he do
anything to help you in your efforts to get to and stay at your desired weight, such as…?” and
“Does he do anything to hinder you in your efforts to get to and stay at your desired weight, such
as…?”. There were seven possible responses to the positive support question and 8 possible
10
select up to 5 options for each response. Responses included an “other” category, allowing for
open-ended responses.
The qualitative data submitted in the “other” category was reviewed for all partner
support questions. Answers were recoded if qualitative responses matched a response listed as an
possible answer to that particular question. New variables were created if several matching
responses occurred that didn’t fit in a previously created category. For example, one category
was titled “Provides support, encouragement and/or advice”. In situations where a choice
received no responses, the response was illuminated from the bar graph corresponding to that
question. This reorganization of open-ended responses aimed to better describe response
frequency. Once the answers were reorganized, bar charts were created for each question based
on the number of responses to each answer. As participants had the opportunity to provide
multiple responses to each question, the answers were not mutually exclusive.
METHODS:STATISTICALANALYSIS
The final analyses were conducted using Stata version 12.0 and included data from 688
and 550 women at 3 and 12 months postpartum respectively (26). Analyses commenced by
calculating overall descriptive statistics of the population, including the mean amount of
postpartum weight retained at the pre-pregnancy at postpartum periods. For the purpose of this
analysis, weight retention (the dependent variable) is defined as the number of pounds retained
between a mothers’ self-reported pre-pregnancy weight and her weight at 3 months and 12
months postpartum. An overall understanding of the PIN Postpartum population was captured
through responses to two general support questions. The entire study population answered
questions on the main reasons that helped them be more active postpartum. Additionally, the
entire study population answered questions on the main reasons that hindered their postpartum
11
a motivator for activity and their weight retention over two time periods.
Bar charts provide a visual understanding of the frequency that mothers site certain
aspects of partner support, or lack of support, related to exercise and healthy eating. Regression
analysis and t-tests enumerate how populations experiencing certain factors compared to those
not experiencing them with regards to amounts of weight retained. In order to perform statistical
analyses, new variables were generated for each potential answer to the four main questions
support questions at each of the two time periods. For each answer option, respondents who had
ever selected that answer option were coded as “1”. Those who had never responded were coded
as “0”. For example, those who selected the option that “their husband exercises with them”
were coded as “1” and those who never selected were coded as “0” in the new variable of
“Exercising with You”. Once recoding was completed, t-tests were used to analyze the
relationship between participants selecting or not selecting “partner support” and weight
retention in the general population.
A simple linear regression analysis was performed between marital status and weight
retention at 3 and 12 months after childbirth. The population of women without a man acting as
the child’s father was too small to yield meaningful results, thus weight loss depending on only
the presence or absence of a father figure was not analyzed. For women reporting the presence of
a man acting as the child’s father, linear regression analyses were performed between weight
retention and several of the highest frequency responses to both positive and negative support
questions. If results were found to be significant, multiple linear regression tests were performed
for the potentially confounding variables of: maternal age, race, poverty level, years of
education, breastfeeding duration and smoking status. These analyses were done to ensure that
responses were of independent importance and that other variables didn’t change the significance
12 RESULTS
Descriptive Statistics
Table 1 gives an overview of the characteristics of PIN Postpartum Study participants.
The vast majority of participants at 3 months postpartum were non-Hispanic white (76.5%),
followed by non-Hispanic Black (14.8%), and Asian Pacific Islander (3%). 5% were of other
races, including 3 American Indians. At 3 months postpartum 17.2% had a high school degree or
less, 46.8% had at least some college education, and 36% had completed education beyond a
post-graduate degree. Under half of the women worked at 3 months and 64% worked one year
after childbirth. Most of the women had more than one child living with them at both time
periods. The average duration of breastfeeding was 27 weeks and large differences in the
duration (SD = 21.3) were experienced among women. More similarly, 64.5% were still
breastfeeding at 3 months and 66.0% were still breastfeeding at 12 months. While the vast
majority of women didn’t smoke, smoking increased from 90% to 91.1% between 3 and 12
13 Table 1. Participant Characteristics
3 Months 12 Months
Years of Education 8-12 13-16 17-20 17.2% 46.8% 36.0% 13.9% 48.3% 37.7% Race White Black Other 76.5% 14.8% 8.7% 78.7% 12.5% 8.7% Working Status Yes No 48.3% 51.7% 62.4% 37.6%
Maternal Age in Years
Average SD 31.0 5.5 32.23 5.4
Weeks of Breastfeeding
Stopped Still Breastfeeding Never Breastfed 26.5% 64.5% 9.0% 26.5% 66.0% 7.5% Smoking Status No Yes 90.0% 10.0% 91.1% 8.9% Other Kids Living at Home
1 2 >3 46.0% 37.0% 17.0% 46.2% 38.5% 15.3%
Mothers’ pre-pregnancy weight ranged from 80.0 lbs to 371.0 lbs, with an average of
152.73 lbs (SD = 42.9). The mean weight gained during pregnancy was 34.2 lbs (SD = 6.1).
Weight retention 3 months after delivery averaged 9.5 lbs (SD = 11.8), with a maximum change
of 50.3 lbs. At this time period the range of maternal weight was between 91.3 lbs and 365.4 lbs,
with a mean weight of 162.3 lbs. A year postpartum, mothers’ mean weight retention dropped to
5.8 lbs (SD = 13.3), with a maximum change of 67.9 lbs. Mothers’ average weight was 157.6 lbs
14 General Support: Helps You Be More Active
Figures 2 and 3 present the results when all participants (regardless of marital status or
presence of a father) were asked the multiple-choice question: “Since delivery, what is the one
main reason that helps you to be more active, either during work or nonworking time?”.
Respondents had the opportunity to select 5 of 17 possible responses to the question. The vast
majority only answered this question once, including 96% of survey respondents at three months
and 84% of survey respondents at 12 months postpartum.
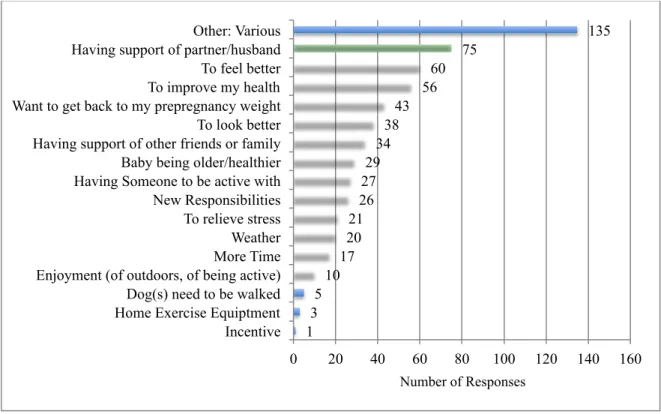
Figure 3 displays that 75 of 600 (13%) women three months postpartum listed partner
support as a main factor in encouraging their activity. This was the most frequently cited reason
for motivating physical activity besides the “other” category. Figure 4 displays that at 12 months
postpartum, 51 of 648 responses (7.8%) women surveyed listed partner support as the top reason
for encouraging activity. This was the third most popular of the 16 categories at the 12 month
period. The main reason selected for encouraging activity at the one-year time mark was the
“baby being older/healthier” (25.8%), followed by “to improve my health” (8.3%). The high
frequency of responses around partner support was consistent with the hypothesis that positive
15
Figure 2. What is the one main reason that helps you to be more active since delivery, either during work or nonworking time (3 months postpartum)?
Figure 3. What is the one main reason that helps you to be more active since delivery, either during work or nonworking time (12 months postpartum)?
1 3 5 10 17 20 21 26 27 29 34 38 43 56 60 75 135
0 20 40 60 80 100 120 140 160
Incentive Home Exercise Equiptment Dog(s) need to be walked Enjoyment (of outdoors, of being active) More Time Weather To relieve stress New Responsibilities Having Someone to be active with Baby being older/healthier Having support of other friends or family To look better Want to get back to my prepregnancy weight To improve my health To feel better Having support of partner/husband Other: Various
Number of Responses
1 3 11 14 16 17 17 23 24 29 30 31 38 51 54 167
0 20 40 60 80 100 120 140 160 180
Incentive Dog(s) need to be walked New responsibilities To relieve stress Want to get back to my prepregnancy weight To look better Enjoyment (of outdoors, of being active) Having someone to be active with Other: Various Weather More time Having support of other friends or family To feel better Having support of partner/husband To improve my health Baby being older/healthier
16
Based on the high response rate, partner support was a major factor in both time periods.
Yet, statistical analyses did not find that women who indicated partner support as a motivating
factor experienced greater actual weight loss. Table 2 outlines differences in average weight
retention of participants who selected “having support of partner/husband” and those who never
selected “having support of partner/husband”. Women who did not select “having partner/
husband support” retained an average of 2.12 lbs more than those who selected “having partner/
husband support” at 3 months postpartum. Despite the mean difference in weight loss, there was
an insignificant effect for partner/husband support, t(445) = 1.35, p = 0.179, at the three month
postpartum period.
Table 2. Support of Partner/Husband to be Active & Postpartum Weight Retention (3 Months Postpartum)
Group Obs
Mean
Std.
Err. Std. Dev.
95% Confidence Interval
Not Selected 385 9.83 0.60 11.74 (8.65 - 11.01)
Partner/Husband
Support 62 7.71 1.29 10.15 (5.13 -10.28)
All 447 9.54 0.55 11.55 (8.46 - 10.61)
Difference 2.12 1.58 (-0.98 - 5.23)
* t = 1.3456 Pr(T < t) = 0.910 Pr(|T| > |t|) = 0.179 Pr(T > t) = 0.090
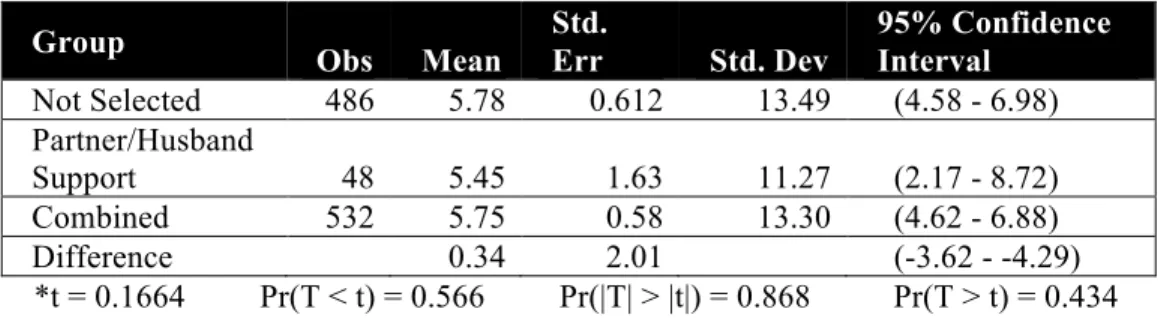
Table 3 compares mean weight loss between women who indicated that “having support
of partner/husband” was a main reason that helped them to be more active since delivery and
those who did not select “having support of partner/husband” one year after childbirth. There
was an insignificant effect for citing partner/husband support, t(532) = 0.17, p = 0.87, with those
citing the importance of partner support retaining only 0.34 lbs less weight that those who didn’t
select partner support. Thus, having support of a partner/husband support for exercise was not a
major contributor to decreased weight retention one year after childbirth. Adjustment of
17
relationship between participants who selected partner/husband support as a main reason to be
active and mean difference in weight loss.
Table 3. Support of Partner/Husband & Postpartum Weight Retention (12 Months Postpartum)
Group
Obs Mean
Std.
Err Std. Dev
95% Confidence Interval
Not Selected 486 5.78 0.612 13.49 (4.58 - 6.98)
Partner/Husband
Support 48 5.45 1.63 11.27 (2.17 - 8.72)
Combined 532 5.75 0.58 13.30 (4.62 - 6.88)
Difference 0.34 2.01 (-3.62 - -4.29)
*t = 0.1664 Pr(T < t) = 0.566 Pr(|T| > |t|) = 0.868 Pr(T > t) = 0.434
General Support: Barriers to Activity at 12 months
The Conceptual Model hypothesized that having a partner who provided positive
encouragement to exercise would be linked to decrease weight retention. Conversely, it
highlighted that having a partner who made it more difficult to exercise would be linked with
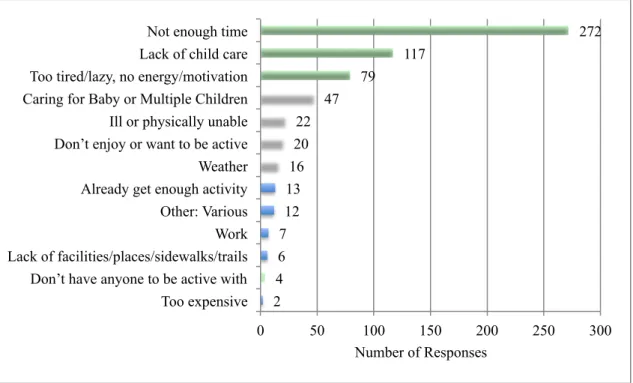
women’s inability to loose gestational weight. Figure 4 illustrates the main reasons that made it
harder for mothers to be more active in they year since giving birth. 272 women selected “not
enough time”, making it the top choice by a large margin. Lack of childcare followed with less
than half that number, 117 selections. The third choice was “too tired/lazy, not
energy/motivation”. No relationship was found between selecting any of these top three choices
and weight variance. The high frequency, 44%, of women citing not having enough time as the
18
Figure 4. Since our last visit with you, what is the one main reason that makes it harder for you to be more active since delivery, either during work or nonworking time (12 months postpartum)?
Marital Status and Weight Retention
Married women’s weight loss was compared to that of unmarried women, including those
who were single, widowed, or divorced at 3 and 12 months postpartum. In this sample,
approximately 82% of women reported being married at 3 months postpartum, whereas 18%
reported being unmarried (single (16%), widowed (1%), or divorced (1%)). As displayed in
Table 4, three months after childbirth, married women retained 3.83 lbs less weight, p < 0.01,
than women who were not married and this was very significant. Unmarried women retained
12.61 lbs on average and married women retained an average of just 8.76 lbs. The relationship
between marital status and weight loss remained independently significant, p < 0.05, after
adjusting for potentially confounding factors of maternal age, race, poverty level, years of
education, breastfeeding duration, and smoking status.
2 4 6 7 12 13 16 20 22 47 79 117 272
0 50 100 150 200 250 300
Too expensive Don’t have anyone to be active with Lack of facilities/places/sidewalks/trails Work Other: Various Already get enough activity Weather Don’t enjoy or want to be active Ill or physically unable Caring for Baby or Multiple Children Too tired/lazy, no energy/motivation Lack of child care Not enough time
19
Table 4. Marital status and weight retention (3 months postpartum)
Source SS df MS
Model 1,498.42 1 1,498.42 Prob > F = 0.00 Number of Obs = 685 Residual 88,538.93 683 129.63 R-squared = 0.02 Adj R-squared = 0.02 Total 90,037.35 684 131.63 Root MSE = 11.39 F(1, 683) = 11.56 Weight Change Coef. Std. Err. t P>|t| [95% Conf. Interval]
Married -3.83 1.13 -3.40 0.00 -6.04 -1.62 _cons 12.61 1.02 12.38 0.00 10.61 14.61
*Three months after delivery, the weight retention of PIN Postpartum Study participants who were married (81.54%) was compared to those who were not married (18.46%). Married women retained an average of 3.83 lbs less than women who were not married (p = 0.01).
At 12 months postpartum, 85% of study participants were married and 15% were not
married, including those who were single (12%), widowed (1%) or divorced (1%). On average,
women retained 5.7 lbs one year after delivery, and weight retention between individuals varied
greatly (SD = 11.4). Table 2 displays a significant effect, p < 0.01, for unmarried women who
retain 10.5 lbs more than married women one year after childbirth. After running numerous
multivariate regressions with potentially confounding factors, the relationship between marital
status and weight loss remained highly significant, p < 0.05.
Table 5. Marital status and weight retention (12 months postpartum)
Source SS df MS
Model 7,433.33 1 7,433.33 Prob > F = 0.00 Number of obs = 534 Residual 86,796.70 532 163.15 R-squared = 0.08 Adj R-squared = 0.08 Total 94,230.03 533 176.79 Root MSE = 12.77 F(1, 532) = 45.56 Weight Change Coef. Std. Err. t P>|t| [95% Conf. Interval] Married Women -10.45 1.55 -6.75 0.000 -13.50 -7.41 _cons 14.64 1.43 10.25 0.000 11.83 17.44
*One year after delivery, weight retention of PIN Postpartum Study participants who were married (84.9%) was compared to those who were not married (15.1%). Married women retained an average of 10.45 lbs less than women who weren't married one year after childbirth with p < 0.01. This weight retention indicator measures women’s weight prior to pregnancy and one year after giving birth.
Partner Support: Father Helps Efforts to Get to and Stay at Desired Weight
Figure 5 displays participant’s responses at 12 months postpartum to the question: “Does
he do anything to help you in your efforts to get to and stay at your desired weight, such as
20
support mothers’ in their weight goals, with 39% (205) of the respondents selecting this option.
The remaining 61.1% (322) of partners did at least one thing to help their partner’s weight goals,
be it exercising with them or providing other types of support.
Figure 5. Does he (the man acting as the child’s father) do anything to help you in your efforts to get to and stay at your desired weight, such as (circle all that apply)? (12 months postpartum)
Statistical analyses were performed to understand the relationship between weight
retention and women selecting the four most frequently selected choices: “He doesn’t do any of
those things”, “Providing you with free time to exercise”, “Exercising with you”, and “Cooking
healthy, low-fat meals”. Table 6 indicates that partners who do not provide support have a
somewhat significant effect, p < 0.1, on women’s likelihood of retaining an average of 1.96 lbs
more than women whose partners provide support. These women would retain an average of
approximately 6.46 lbs, instead of 4.5 lbs one year after childbirth.
5 7
16 34
96 124
191 205
0 50 100 150 200 250
Other, Don't Know Takes Actions to Support Healthy Eating Habits Provide you with a material reward or incentive (money, clothes, trip, exercise equipment, etc.) Provides Support, Encouragement and/or Advice
Cooking healthy, low fat meals Exercising with you Providing you with free time to exercise He doesn't do any of these things
21
Table 6. “Does he (the man acting as the child’s father) do anything to help you in your efforts to get to and stay at your desired weight, such as “He doesn’t do any of those things” (12 months postpartum)
Source SS df MS
Model 468.00 1 468.00 Prob > F = 0.09 Number of obs = 513 Residual 80,956.64 511 158.08 R-squared = 0.01 Adj R-squared = 0.00 Total 81424.64 512 158.43 Root MSE = 12.59 F(1, 511) = 2.95 Weight Change Coef. Std. Err. t P>|t| [95% Conf. Interval] None of These 1.96 1.14 1.72 0.086 -.28 4.20 _cons 4.50 0.71 6.33 0.000 3.10 5.90
Women selecting “fathers who provide women with free time to exercise” weigh 2.33 lbs
less, p < 0.05, than women whose partner doesn’t provide them with time to exercise. Those who
were given this free time to exercise retained 3.78 lbs, as outlined in Table 7. Table 8 displays
the interesting finding that women selecting “exercising with you” actually weighed 0.34 lbs.
more, p < 0.10, than those who didn’t state that their partner exercising with them helped their
weight loss efforts.
Table 7. “Does he (the man acting as the child’s father) do anything to help you in your efforts to get to and stay at your desired weight, such as “Providing you with free time to exercise” (12 months postpartum)
Source SS df MS
Model 6433.37 1 643.37 Prob > F = 0.04 Number of obs = 513 Residual 80,781.26 511 158.08 R-squared = 0.01 Adj R-squared = 0.01 Total 81,424.64 512 159.03 Root MSE = 12.57 F(1, 511) = 4.07 Weight Change Coef. Std. Err. t P>|t| [95% Conf. Interval] Free Time -2.33 1.16 -2.02 0.044 -4.60 -0.61 _cons 6.11 0.69 8.79 0.000 4.74 7.47
Table 8. “Does he (the man acting as the child’s father) do anything to help you in your efforts to get to and stay at your desired weight, such as “Exercising with you” (12 months postpartum)
Source SS df MS
22
The fourth most frequently sited supportive behavior impacting nutrition for women was
partners who were “cooking healthy, low fat meals”. Table 9 depicts that the linear regression
analyses found a trend, p = 0.10, between weight retention of the 17.45% who selected this
indicator at 12 months postpartum. Women whose partners cooked healthy, low fat meals lost an
average of 2.36 lbs.
Table 9. “Does he (the man acting as the child’s father) do anything to help you in your efforts to get to and stay at your desired weight, such as “cooking healthy, low fat meals” (12 months postpartum)
Source SS df MS
Model 432.13 1 432.13 Prob > F = 0.10 Number of obs = 513 Residual 80,992.51 511 158.50 R-squared = 0.01 Adj R-squared = 0.00 Total 81,424.64 512 159.03 Root MSE = 12.59 F(1, 511) = 2.73 Weight Change Coef. Std. Err. t P>|t| [95% Conf. Interval] Cooking Meals -2.36 1.43 -1.65 0.10 -5.17 .45 _cons 5.70 0.62 9.26 0.00 4.49 6.91
Based on simply the results in Tables 5, 6, 7 and 8 various associations could be made.
The strongest relationship between weight retention and one variable was: that women whose
partners provide them with free time to exercise loose the most weight 2.33 lbs, p < 0.05, at one
year postpartum. Multivariate regression was done with a variety of sociodemographic variables,
similar to those displayed in Table 1, in order to verify an independent relationship between the
partner support variable and association with weight retention. However, all four results were
rendered insignificant, p > .1, when age was included in multivariate analyses.
Father Support: Hinder you in your Efforts to get to and Stay at your Desired Weight
Figure 6 shows a bar graph of the frequency of responses to: “Does he (the man acting as
the baby’s father) do anything to hinder you in your efforts to get to and stay at your desired
weight, such as (select all that apply)?” The vast majority, 84%, of respondents selected the
option indicating that their partner does not do any of the things listed (including other) to hinder
23
partners’ influence on weight was mostly positive. The second and third most frequently reported
responses were that partners hinder reaching and maintaining desired weight because they:
“Bring home high calorie food, sweets or alcoholic beverages that tempt you” or “Encourage you
to join him in dining out or going our drinking on frequent occasions”. 76 women (14.4%)
responded positively to either the second or third response.
Figure 6. Does he (the man acting as the child’s father) do anything to hinder you in your efforts to get to and stay at your desired weight; such as (circle all that apply)? (12 months postpartum)
Women selecting that the man acting as the child’s father doesn’t do any of the negative
things listed was related, p < 0.10, to weight reduction. Those who selected this option lost 2.8
lbs more than those who didn’t, as indicated in Table 10. However, once the variable of age was
included into a multivariate linear regression, the results were no longer significant, p > 0.10.
As indicated in Table 11, mothers with partners who encouraged either eating out
frequently, bringing home unhealthy food and drinks, or both retain 2.84 lbs more than those
2 3 3 8
22 67
443
0 50 100 150 200 250 300 350 400 450 500
Other Say things to discourage you from your desire or efforts to get to and stay at your desired weight Seem afraid or jealous of your returning to and/or staying at your desired weight
Doesn't give you the opportunity to exercise Encourage you to join him in dining out or going out drinking on frequent occasions
Bring home high calorie food, sweets or alcoholic beverages that tempt you
24
who didn’t have those influences. However, these results were not statistically significant, p >
0.10, so no conclusions can be drawn from those seemingly negative partner behaviors.
Table 10. “Does he (the man acting as the child’s father) do anything to hinder you in your efforts to get to and stay at your desired weight, such as “he doesn’t do any of these things” (12 months postpartum)
Source SS df MS
Model 556.72 1 556.72 Prob > F = 0.06 Number of obs = 513 Residual 80,867.92 511 158.25 R-squared = 0.01 Adj R-squared = 0.00 Total 81,424.64 512 159.03 Root MSE = 12.58 F(1, 511) = 3.52 Weight Change Coef. Std. Err. t P>|t| [95% Conf. Interval] Doesn’t Hinder -2.84 1.52 -1.88 0.06 -5.82 0.13 _cons 7.65 1.39 5.51 0.00 4.92 10.38
Table 11. “Does he (the man acting as the child’s father) do anything to hinder you in your efforts to get to and stay at your desired weight, such as “Brings home high calorie food, sweets or alcoholic beverages that tempt you” or “Encourage you to join him in dining out or going out drinking frequently” (12 months postpartum)
Source SS df MS
Model 416.76 1 416.76 Prob > F = 0.11 Number of obs = 513 Residual 81,007.88 511 158.53 R-squared = 0.01 Adj R-squared = 0.00 Total 81424.64 512 159.03 Root MSE = 12.59 F(1, 511) = 2.63
Weight Change Coef. Std. Err. t P>|t| [95% Conf. Interval] Negative Influence 2.57 1.58 1.62 0.106 -.54 5.67 _cons 4.89 0.60 8.14 0.000 3.71 6.07
DISCUSSION
The framework of analyzing associations between postpartum weight retention both with
partner support generally and with partner support specifically for weight loss and physical
activity is unique. The large sample size, of 688 and 550 participants at 3 and 12 months
postpartum respectively, in conjunction with a high response rate, adds power to this field of
study (24). Most research on similar topics was conducted with smaller sample sizes (19). The
major weakness in the cross-sectional study methodology is that it does not allow for causality to
25
Study questions focused on postpartum weight retention and included an examination of
diet, physical activity, infant feeding, psychosocial factors, and health behaviors (24). The vast
amount of information collected during pregnancy allowed for a tailored selection of questions
that best fit the secondary data analysis’ original hypothesis. It also permitted these questions to
be tracked over two time periods, and compared to baseline reports. Another positive aspect of
the research design was that PIN Postpartum includes all forms of postpartum activity (24).
While previous studies focused on certain types of exercise and made the large omission of not
including walking, which is the primary form of activity during this time period (19).
Weight measurements came in a variety of forms, yielding both strengths and major
flaws of the study. An assessment of weight, height and percent body fat using bioelectrical
impedance occurred at each home visit (24). This rigorous measurement of weight makes
information on postpartum weight loss a strong unit of measure. Actual measurements during
home visits provide more rigorous data than other measurement indicators. However,
pre-pregnancy weight was a self-reported measure, which is a slight weakness in the study’s ability
to measure actual change from baseline as self-reported data was checked for biological
implausibility (24). A flaw of weight measurement in this analysis, while not of the overall
study, is that it does not include information on gestational weight gain. As increased weight
gain is related to increased weight retention, the availability of this data would have strengthened
the study’s ability analyze external variables’ potential impact on the degree of partner influence.
In terms of sociodemographic relationships for weight retention, this secondary data
analysis was consistent with several previous studies on this topic. The relationship between
participants of the black race retaining higher levels of weight compared to other races confirmed
findings from previous studies (4). Lower levels of education, poverty and smoking status also
26
impact on postpartum weight retention. When maternal age was included into multiple linear
regressions, it often rendered previously significant support indicators’ relationship with weight
retention insignificant. Despite inconclusive evidence to date, perhaps considering age-related
weight changes when calculating these results would have altered the degree to which maternal
age modified the experience of weight retention (9).
A major weakness of this study was that its sample population made it unclear if study
results would be generalizable to the larger North Carolina or American population. The sample
size was limited to women who were mostly married, had a father figure and were middle to high
income (26). Having a larger proportion of the sample size be unmarried women or without a
father figure for their child would have allowed for deeper analysis between solely having a
partner and weight retention. Further exclusion criteria included women with multiple gestations,
women initiating prenatal care after week 29, and women not planning to continue care or
delivery at the study site (24). Characteristics of women initiating prenatal care after week 29
would likely be different than those who sought care prior to such data, thus perhaps illuminating
a group of study participants at higher risk for poor health outcomes, which impact weight
retention (27).
As the prevalence of excessive weight retention in minority women is extremely high,
gaining information on their causal pathways to weight retention is of extreme importance (9).
Importantly, and likely due to disqualification criteria of not being English-speaking, there were
no Latino indicators (24). Thus, this study doesn’t include adequate representation of many of
the individuals who are most at risk for excessive weight retention and concurrently most in need
of interventions. As this lack of diversity does not represent the North Carolina or US
population, it it may have created bias within the results. Thus, sample bias may have occurred,
27
RECOMMENDATIONSFORFUTURERESEARCH
Discovering the underlying causes of overweight and obesity in women of childbearing
age is vital to improving American health, as this knowledge can lead to the implementation of
strategies to stop and prevent this epidemic for growing further. Further research should be
conducted on the pathways between gestational weight gain, retention and long-term weight. It is
evident that partner support has a role in postpartum weight retention, however the exact impact
is not easily discernable based on the findings shared in this paper. Research should be
conducted on the many potential pathways between partner and other support, including more
research on their influences on eating, activity and breastfeeding. As breastfeeding’s relationship
to obesity is still in question; more rigorous studies are need to conclude the debate surrounding
breastfeeding and weight loss.
As minorities are most at-risk for weight retention, future research should be sure to
over-sample for minorities (especially blacks and Latinos). For all of these future studies, rigorous
weight measurements should be utilized at all steps of the research process. Longitudinal data
following women over several years and over multiple births would also contribute greatly to
this field, as longer-term relationships with weight fluctuations could be examined
A multiplicity of avenues for research between partner and/or social support more
broadly and gestational weight retention needs to be done. These research areas could be
explored by further analyzing PIN Postpartum data, furthering PIN Postpartum data, or by
conducting separate research. The PIN Postpartum data set contains a multitude of variables that
could be used to continue to test hypothesis around weight retention. As important results
emerge from this data set, these results should lead to more in depth research.
For example, women cited being able to exercise more when their child is older as a
28
change allows them to be more active. Perhaps they are more comfortable leaving their baby
with others or perhaps they can take the baby with them when they exercise. Following up with
these women in focus groups or key informant interviews could help discover themes and
patterns around why the selection of certain circumstances is connected with to more health
promoting behaviors.
The ultimate goal in this research area is to utilize the results to implement
evidence-based interventions to decrease maternal weight retention. Thus, it is recommended that
researchers design programs capitalizing on decreasing frequently cited barriers and increasing
the health promoting behaviors in the research. After these programmatic ideas are developed,
further research on interventions could be done where previous participants could reconvene,
either in a group or individually, to give their opinion on the strengths, weaknesses, and
feasibility of proposed programs. Translating ongoing research into postpartum weight reduction
programs would provide the link between weight retention and creating population-specific
interventions to improve maternal and child health outcomes.
CONCLUSION
Postpartum weight retention is an important public issue that has the potential to
negatively impact mothers and their offspring. PIN Postpartum data indicates that there is a
correlation between women with partner support and decreased gestational weight at both the 3
and 12 months postpartum periods. Additionally, maternal responses made it apparent that
women value partner support in their efforts to loose weight and sustain that loss during the
postpartum period.
The majority of men acting as children’s fathers support, and do not hinder, women’s
29
do one or more things to help their weight goals, be it exercising together or providing support.
84% of respondent’s partners did not do things to hinder their efforts to attain their
pre-pregnancy weight. The mostly positive influence of partners on achieving weight goals is
important. However, as varying responses didn’t result in a major difference in actual amounts of
weight retained, the nuances of what aspects of this partner support lead to weight reduction
remain unclear based on these analyses alone.
This high volume of responses around partner support encouraging activity was
consistent with the hypothesis that positive partner support for exercise was important for
encouraging exercise. The importance of support for activity was clear when women ranked the
support of a partner as the top reason for encouraging activity at 3 months postpartum and the
third most important at 12 months postpartum. The main reason at 12 months was the “baby
being older/healthier” which correlates directly with the top three reasons that made it harder to
be more active at the 3 months after childbirth. The main activity hindering reasons were: “not
enough time”, “lack of childcare”, and “being tired/lazy/no energy/no motivation”. There is the
potential that exercise post childbirth could be accelerated if mothers had more free time,
childcare, and/or enough energy for physical activity. Its also possible that partners could be in a
position where they could provide childcare in order to allowing their wives/partners time to
exercise, time to energize and more free time in general.
Several sociodemographic factors influenced weight retention in a way that rendered the
association between specific health promoting behaviors of partners and weight retention
unclear. Yet, it is clear that a strong relationship exists between weight retention and partner
support. Partner support for exercise and other healthy behaviors was frequently cited as a main
reason motivating activity postpartum. Barriers to activity and weight retention are also lifestyle
30
maternal overweight and obesity in the US mandates that further research be conducted on the
31 REFERENCES
1. Healthy People 2020: Obesity. Available at:
http://www.healthypeople.gov/2020/topicsobjectives2020/overview.aspx?topicid=29 Accessed
March 31, 2013.
2. Ohlendorf JM, Weiss ME, Ryan P. Weight-management information needs of postpartum
women. MCN Am J Matern Child Nurs. 2012 Jan-Feb;37(1):56-63.
3. Davenport MH, Giroux I, Sopper MM, Mottola MF. Postpartum exercise regardless of
intensity improves chronic disease risk factors. Med Sci Sports Exerc. 2011 Jun;43(6):951-8.
4. Institute of Medicine (US) and National Research Council (US) Committee to Reexamine
IOM Pregnancy Weight Guidelines; Rasmussen KM, Yaktine AL, editors. Weight Gain During
Pregnancy: Reexamining the Guidelines. Washington (DC): National Academies Press (US);
2009. 2, Descriptive Epidemiology and Trends. Available at:
http://www.ncbi.nlm.nih.gov/books/NBK32810/ Accessed March 31, 2013.
5. Ruchat SM, Davenport MH, Giroux I, Hillier M, Batada A, Sopper MM, Hammond JM, Mottola MF. Nutrition and exercise reduce excessive weight gain in normal-weight pregnant
women. Med Sci Sports Exerc. 2012 Aug;44(8):1419-26.
6. ADA/ASN. Position of the American Dietetic Association and American Society for
Nutrition: Obesity, reproduction, and pregnancy outcomes. J Am Diet Assoc 2009;109:918-927.
7. Kim SY, Dietz PM, England L, Morrow B, Callaghan WM. Trends in pre-pregnancy obesity
in nine states, 1993–2003. Obesity (Silver Spring). 2007;15:986–93.
8. Siega-Riz AM, Herring A, Carrier K, Evenson KR, Dole N, Deierlein AL. Sociodempgraphic,
perinatal, behavioral, and psychosocial predictors of weight retention at 3 and 12 months
postpartum. Obesity 2010;18:1996-2003.
32
women: A review of the evidence. 2003. Annals of Behavioral Medicine, 26(2), 149-159.
10. Kac G, Benício MH, Velásquez-Meléndez G, Valente JG, Struchiner CJ. Breastfeeding and
postpartum weight retention in a cohort of Brazilian women. Am J Clin Nutr. 2004
Mar;79(3):487-93.
11. Healthy People 2020: Physical Activity Available at:
http://www.healthypeople.gov/2020/topicsobjectives2020/overview.aspx?topicid=33. Accessed
March 31, 2013.
12. Hatsu IE, McDougald DM, Anderson AK. Effect of infant feeding on maternal body
composition. Int Breastfeed J. 2008 Aug 6;3:18.
13. Johnson AM, Correll A, Greene JF, Hein D, McLaughlin T. Barriers to Breastfeeding in a
Resident Clinic. University of Connecticut School of Medicine, Hartford, Connecticut.
Breastfeed Med. 2012 Aug 7.
14. U.S. Department of Health and Human Services. The Surgeon General’s Call to Action to
Support Breastfeeding. U.S. Department of Health and Human Services, Office of the Surgeon
General: Washington DC. 2011.
15. Siega-Riz AM, Deierlein A, Stuebe A. Implementation of the new institute of medicine
gestational weight gain guidelines. J Midwifery Womens Health 2010;55(6):512-9.
16. Baker JL, Gamborg M, Heitmann BL, Lissner L, Sørensen TI, Rasmussen KM.
Breastfeeding reduces postpartum weight retention. Am J Clin Nutr. 2008 Dec;88(6):1543-51.
17. Mason G, Roholt, S. Promoting, protecting and supporting breastfeeding. A North Carolina
Blueprint for Action. North Carolina Division of Public Health: Raleigh, NC 2006.
18. Stuebe, A. (2013) Breastfeeding and Maternal Health. (Powerpoint Slides)
19. Borodulin K, Evenson KR, Herring AH. Physical activity patterns during pregnancy through
33
20. Evenson KR, Aytur SA, Borodulin K. Physical activity beliefs, barriers, and enablers among
postpartum women. J Women Health 2009;18:1925-34.
21. The American College of Sports Medicine. Impact of physical activity during pregnancy and
postpartum on chronic disease risk. Med Sci Sports Exerc. 2006 May;38(5):989-1006.
22. Amorim AR, Linne YM, Lourenco PM. Diet or exercise, or both, for weight reduction in
women after childbirth. Cochrane Database Syst Rev. 2007 Jul 18;(3):CD005627.
23. ACOG Committee Obstetric Practice. ACOG Committee opinion. Number 267, January
2002: Exercise during pregnancy and the postpartum period. Obstet Gynecol. 2002
Jan;99(1):171-3.
24. PIN Postpartum Study. Available at http://www.cpc.unc.edu/projects/pin/design_postpart.
Accessed September 20, 2012.
25. Siega-Riz AM, Herring AH, Carrier K, Evenson KR., Dole N, Deierlein A.
Sociodemographic, Perinatal, Behavioral, and Psychosocial Predictors of Weight Retention at 3
and 12 months Postpartum Obesity. Silver Spring. 2010 October; 18(10):1996–2003.
26. StataCorp. 2011. Stata Statistical Software: Release 12. College Station, TX: StataCorp LP.
27. Friedman, S, Heneghan, A, Rosenthal, M. (2009). Characteristics of women who do not seek
prenatal care and implications for prevention. JOGNN: Journal Of Obstetric, Gynecologic &
34 ACKNOWLEDGEMENTS
This secondary data analysis would not have been made possible without Professor Anna
Maria Siega-Riz, and those involved in the PIN Postpartum study allowing me analyze their data.
The feedback and ideas received from Professors Anna Maria Siega-Riz, Trude Bennett, and Jon
Hussey were all essential to this paper’s substance. The Odum Institute and staff were an
important resource for their computer software and guidance. I appreciate everyone’s time and