i^v!?''T^"'
ABSTRACT
MARIA V. FREY. Use and Evaluation of the Toxicity
Identification Evaluation, Phase I, of a Toxicity Reduction
Evaluation (Under the direction of DR. FRANCIS A. DIGIANO).
The Environmental Protection Agency (EPA) has developed
a Toxicity Reduction Evaluation (TRE) protocol to assist
NPDES permittees unable to meet biomonitoring standards.
The Toxicity Identification Evaluation (TIE) part of a TRE
consists of three phases, which successively identify
toxicity-causing compounds with greater specificity. Phase
I of the TIE is designed to classify toxicants as to broad
generic group according to the results of simple
physical/chemical manipulations performed on effluent
samples.This research evaluated the Phase I TIE manipulations
using target compounds selected to ascertain the validity of
each test to characterize the generic group of the toxicant
correctly. Target compound testing produced expected
results in most instances, but sufficient deviation occurred
to reveal that each test may involve overlooked mechanisms
that produce unintentional effects.
Other project objectives focused on applying the TIE
feasability of application to municipal NPDES violations. The Highpoint, N.C.Westside Wastewater Treatment plant
(WWTP) and the Fayetteville, N.C. Cross Creek WWTP were selected as typical WWTP's with industrial wastewater contribution and experiencing at least sporadic toxic
episodes. In addition to Phase I TIE studies, this research
examined biomass as a source and sink for toxicants which
can biosorb. Returned activated sludge (RAS) samples from High Point Westside, Cross Creek and Burlington South Side WWTP's was to measure centrate toxicity and to conduct desoption experiments.
Many effluent samples from High Point displayed an
unexplained disappearance of toxicity through time. Phase I manipulations pointed to metals as the toxicant in the only sample tested with persistant toxicity. Phase I testing on four Fayetteville effluent samples collected over a 3-month period produced varying results. Only the C18 column
consistently removed toxicity, indicating non-polar
IV
TABLE OF CONTENTS
Page
LIST OF FIGURES ...vii
LIST OF TABLES ...X
ACKNOWLEDGEMENTS ...xii
1. INTRODUCTION...1
1 • 1 Background...1
1. 2 Ob j ectives...2
2 . LITERATURE REVIEW...3
2.1 Toxicity-based Approach to Solving Effluent
Toxicity Problems...3
2.1.1 The TIE Component of a TRE...4
2.2 Phase I Studies Using Prepared Solutions...10
2. 3 TIES Conducted at POTWs...11
2.3.1 Patapsco WWTP in Baltimore, Maryland...11
2.3.2 Cross Creek WWTP in Fayetteville, NC...15
2 .4 Biomass Toxicity Studies...24
2.4.1 Importance of Biomass Studies in Controlling
Toxicity Problems...24
2.4.2 Modeling of the Removal of Organic Compounds
by Biosorption...25
2.4.3 Biomass Studies Conducted at WWTPs...30
2.4.4 Recommendations for Further Biomass Studies..36
2 .5 Evaluation of Phase I TRE Protocol...37
3 . EXPERIMENTAL METHODOLOGY...39
3 .1 Overview of the TIE Protocol...39
3 . 2 Target Compound Testing...40
3.2.1 Selection of Target Compounds...40
3.2.2 Preparation of Target Compound Solutions...43
3.2.3 Verification of TIE Protocol with Target
Compounds...45
3.3 Initial Effluent Toxicity Testing: High Point
Westside WWTP...523.3.1 Description of Westside WWTP, High Point, NC.52
3.3.2 Sample Collection, Handling and Screening....54
3.3.3 TIE Scheme for Initial Phase I Effluent
Toxicity Testing...54
TABLE OF CONTENTS (continued)
Page
3.4 Phase I Testing at Cross Creek WWTP, Fayetteville,
NC ...58
3.4.1 Description of Cross Creek WWTP...58
3.4.2 Sample Collection, Handling and Screening.... 61
3.4.3 Phase I Testing Protocol Used...61
3 . 5 Biomass Toxicity Studies...63
3.5.1 Importance of Biomass Toxicity Studies...63
3.5.2 Biomass Toxicity Testing: High Point, NC....63
3.5.3 Biomass Toxicity Testing: Burlington, NC....65
3.5.4 Biomass Toxicity Testing: Fayetteville, NC..68
4 . RESULTS AND DISCUSSION...69
4.1 General Approach to TIE Data Interpretation...69
4.1.1 Measurements of Acute Toxicity...69
4.1.2 Definition of Significant Decrease in
Toxicity...77
4.2 Target Compound Testing: Verification of Phase I
Tests...81
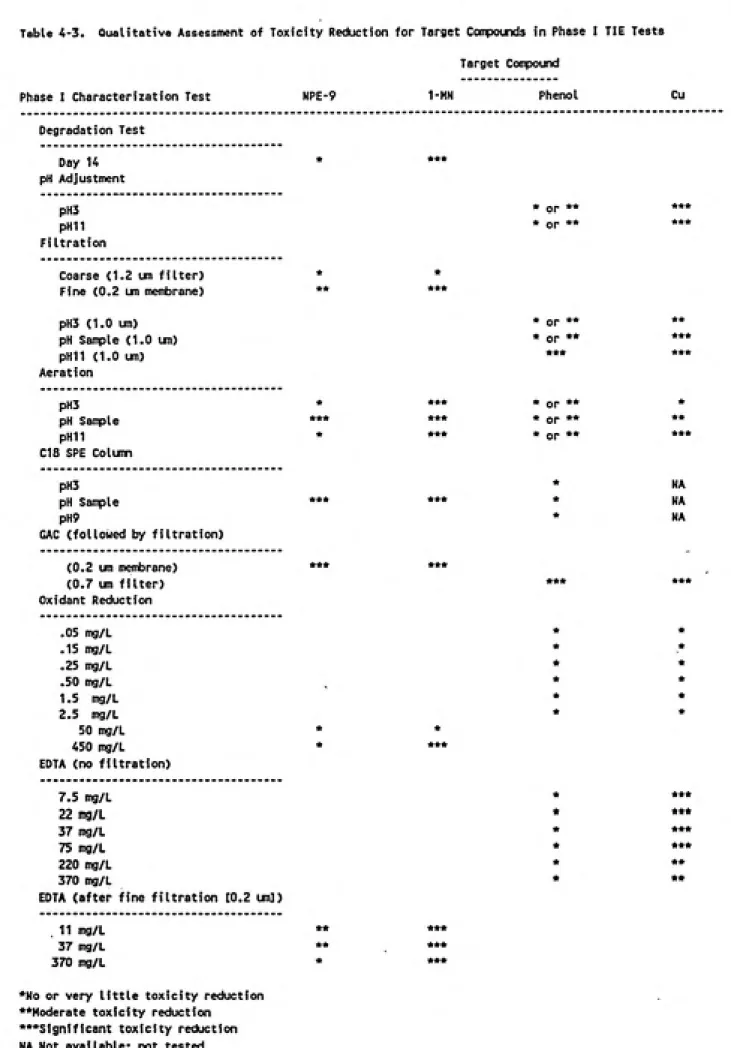
4.2.1 Results of Phase I TIE Tests...81
4.3 Characterization of Whole Effluent Toxicity...90
4.3.1 General Comments...90
4.3.2 Results of Phase I Testing on High Point
Westside WWTP Effluent Samples...96
4.3.3 Results of Phase I Testing on Fayetteville
Effluent Samples...106
4 .4 Characterization of Biomass Toxicity...126
4.4.1 High Point Westside WWTP...126
4.4.2 South Burlington WWTP...128
4.4.3 Fayetteville Cross Creek WWTP...132
4.4.4 Trends in Final Effluent and RAS Toxicity....133
4.4.5 Suggestions for Improved Experimental
Methods for Toxicant Desorption Examination
of RAS...138
4.5 Critique of the EPA TIE Phase I Protocol ...141
4.5.1 Feasibility of Conducting Phase I Tests...141
4.5.2 Critique of Phase I Testing Procedures...143
4.5.3 Inconsistancies in the EPA TIE Phase I
Protocol...144
5. CONCLUSIONS AND RECOMMENDATIONS...147
5.1 Conclusions...147
5.2 Recommendations...148
REFERENCES...150
VI
TABLE OF CONTENTS (continued)
Page
APPENDIX B: Toxicity Test Data Tables for Target
r»5?r-3«3
Vll
LIST OP FIGURES
Figure Description Page
2-1 Flow Chart for Toxicity Reduction Evaluations(Norberg-King, et al. . 1991)...5
2-2 Overview of Phase I Effluent Characterization
Tests (Mount & Anderson-Carnahan, June, 1988)....6 2-3 Toxicity Identification Procedure Schematic Used
in Phase I Effluent Characterization at Patapsco WWTP (Botts, Braswell & Sullivan, 1988)... 13 2-4 Sorption Isotherm of Lindane onto Activated
Sludge (Bell & Tsezos, 1987)...26
3-1 Initial EPA Draft Procedure for Phase I Effluent
Characterization Tests (Anderson-Carnahan &
Mount, 1987)...46
3-2 Test Scheme Used to Evaluate Phase I
Characterization Tests Using Target Compounds
NPE-9 and 1-MN...47
3-3 Schematic of Westside Wastewater Treatment
Plant, Highpoint, N.C. (Champlin, 1989)...53
3-4 Test Scheme Used for Initial Phase I Effluent
Characterization...55 3-5 Schematic of Fayetteville - Cross Creek
Wastewater Treatment Plant, Fayetteville, N.C.
(Champlin, 1989)...60
4-1 Typical "S"-shaped or Sigmoid Curve Resulting
from Linear Plot of Percent Mortality vs.
Toxicant Concentration (Peltier & Weber, 1985)...70
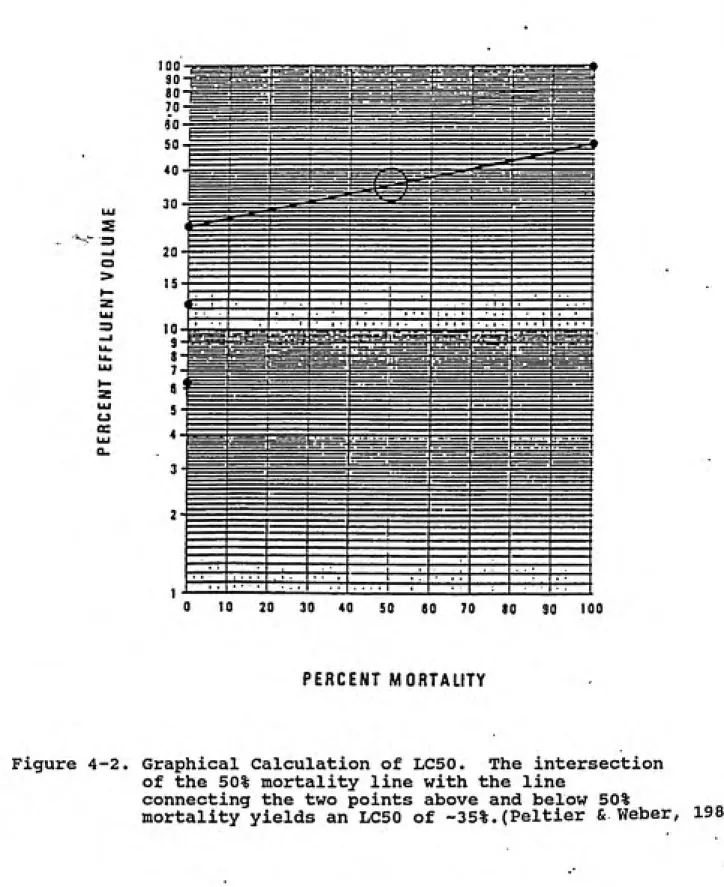
4-2 Graphical Calculation of LC50. The intersectionof the 50% mortality line with the line
connecting the two points above and below 50% mortality yields an LC50 of-35% (Peltier &
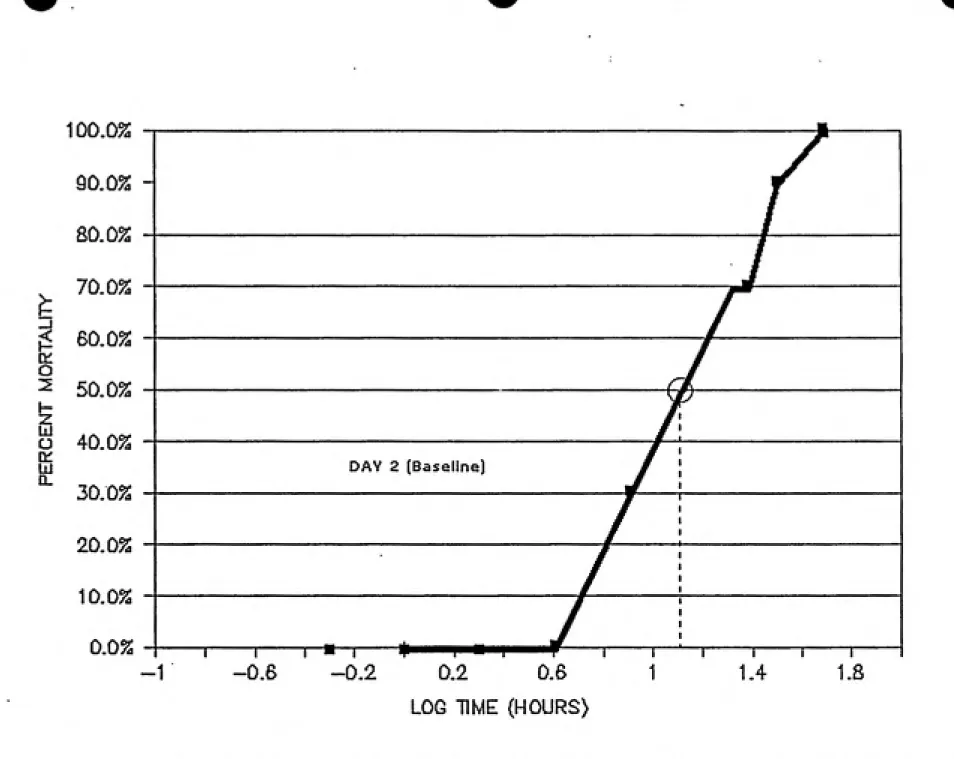
Weber, 1985)...71 4-3 Illustrative Example of an ET50 Calculation
Using Graphical Method. Intersecting the 50%
mortality line with the line connecting the two data points above and below 50% mortality yieldsan ET50 of approximately 12. 5h...74
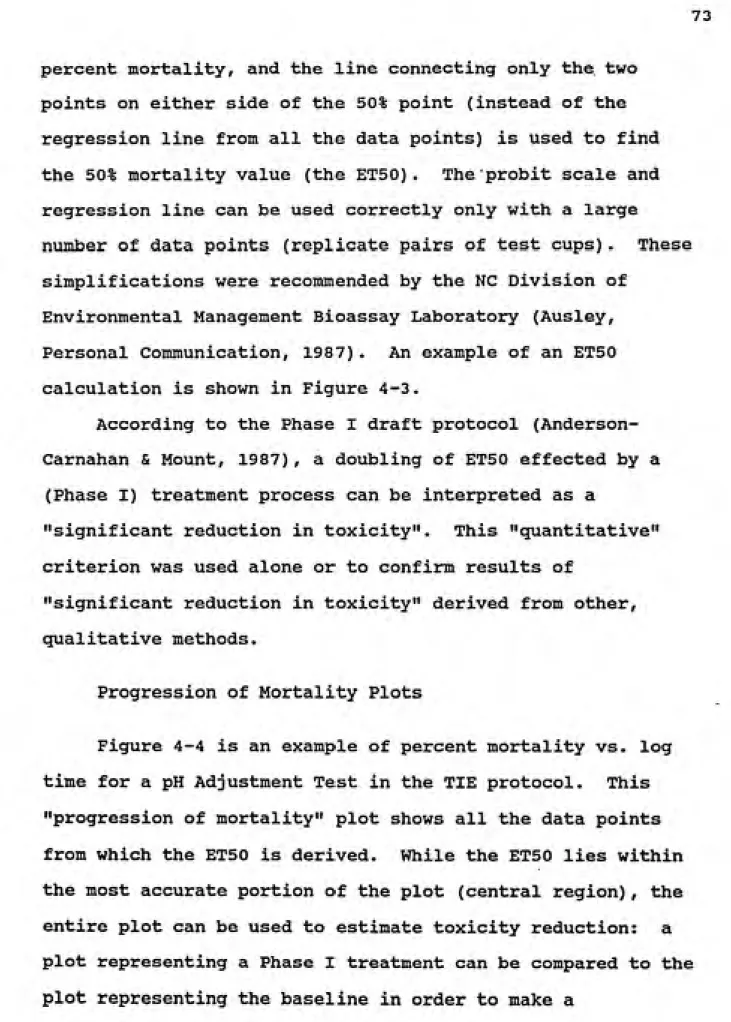
4-4 Graph of Percent Mortality vs. Log Time for a pH
Adjustment Test. A significant reduction in
'?K!^-'^^ai5?T?™!WW"~'''" -"" --yJTSfyass^'y.JSM.afete'
Vlll
LIST OP FIGURES (continued)
Figure Description Page
4-5 Results of Phase I Toxicity Testing Expressed
in Time Toxicity Units (TTU's). For each treatment the TTU value is compared to the
Baseline (Day 2)...78
4-6 Results of Modified Phase I Procedure for
Filtration, C18, Oxidant Reduction and Aeration Tests Performed on High Point Westside WWTP
Effluent Composite 3/7/88 ...100
4-7 Results of EDTA Additions to Filtered and
Unfiltered Aliquots of High Point Westside
WWTP Effluent Composite 3/7/88...101
4-8 Effect of EDTA Addition on Control Water and
on Effluent Sample 3/7/88 (Filtered and
Unfiltered)...102
4-9 Toxicity Test Results Expressed in TTU's forPhase I TIE Treatments of Cross Creek WWTP
Whole Effluent Sample 1/16-1/17/89...107
4-10 Phase I TIE Oxidant Reduction Test Results
Expressed in TTU's for Cross Creek WWTP
Effluent Composite Sample 1/16-1/17/89...108
4-11 Phase I TIE Chelation Test Results Expressedin TTU's for Cross Creek WWTP Effluent
Composite Sample 1/16-1/17/89...109
4-12 Toxicity Test Results Expressed in TTU's for
Phase I TIE Treatments of Cross Creek WWTP
Whole Effluent Sample 1/30-1/31/89...110 4-13 Phase I TIE Oxidant Reduction Test Results
Expressed in TTU's for Cross Creek WWTP
Effluent Composite Sample 1/30-1/31/89...Ill
4-14 Phase I TIE Chelation Test Results Expressed
in TTU's for Cross Creek WWTP Effluent
Composite Sample 1/30-1/31/89...112
4-15 Toxicity Test Results Expressed in TTU's for
Phase I TIE Treatments of Cross Creek WWTP
Whole Effluent Sample 2/20-2/21/89...113 4-16 Phase I TIE Oxidant Reduction Test Results
Expressed in TTU's for Cross Creek WWTP
IX
LIST OF FIGURES (continued)
Figure Description Page
4-17 Phase I TIE Chelation Test Results Expressed
in TTU's for Cross Creek WWTP Effluent
Composite Sample 2/20-2/21/89...115
4-18 Toxicity Test Results Expressed in TTU's for
Phase I TIE Treatments of Cross Creek WWTP
Whole Effluent Sample 3/20-3/21/89...116
4-19 Phase I TIE Oxidant Reduction Test Results
Expressed in TTU's for Cross Creek WWTP
Effluent Composite Sample 3/20-3/21/89...117
4-20 Phase I TIE Chelation Test Results Expressed
in TTU's for Cross Creek WWTP Effluent
^ͣS?^**^ '-'S?^' -'i^ ~"- ' >.*»ͣ V^.'T: ''W5;s5H3«&* ͣK"'?^ ͣ
LIST OF TABLES
Table Description Page 2-1 Acute Toxicity of Fractions of Primary Effluent
and Secondary Effluent Wastewaters from Patapsco WWTP (Botts, Braswell & Sullivan, 1988)...16 2-2 Summary of TIE Phase I Characterization
Results-September, 1989, Fayetteville Cross Creek WWTP
(Fillmore, et al. . 1990)...19 2-3 Summary of TIE Phase I Characterization
Results-October 1989, Fayeteville Cross Creek WWTP
(Fillmore, et al . 1990)...20 2-4 Summary of TIE Phase II Analyses, Fayetteville
Cross Creek WWTP (Fillmore et al. , 1990)...23 2-5 Freundlich Parameters for Sorption Isotherms
(Bell & Tsezos, 1987)...28 2-6 Toxicity of Patapsco Activated Sludges (after
Botts, Braswell & Sullivan, 1988)...31 2-7 Comparison of Occurrence of Priority Pollutants in
POTW Sludges, Patapsco WWTP vs. 40 Other POTWs
(Botts, Braswell & Sullivan, 1988)...33
2-8 Results of Buffered Saline Treatment to Remove
RAS Toxicity (after Botts, Braswell & Sullivan, 1988)...32 2-9 Results of Synthetic Substrate Treatment to Remove
RAS Toxicity (after Botts, Braswell & Sullivan, 1988)...34
2-10 Results of Solids Removal Treatments to Remove
RAS Toxicity (after Botts, Braswell & Sullivan, 1988)...35 3-1 Target Compounds—Summary of Physical and Chemical
Properties...42
3-2 The 48-h LC50 and Initial Concentration of Each
Target Compound Used in Phase I TIE Protocol
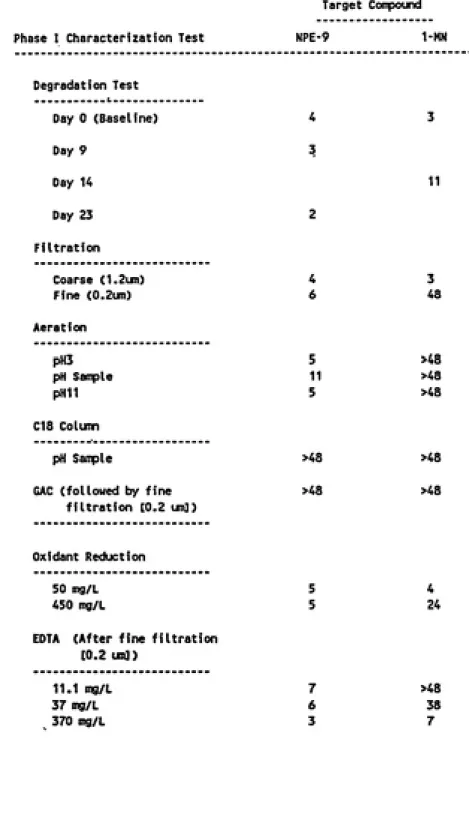
Testing...43 4-1 ET 50 Values (in hours) for Target Compound
Solutions of NPE-9 and 1-MN in Modified TIE Phase
XI
LIST OF TABLES (continued)
Table Description Page
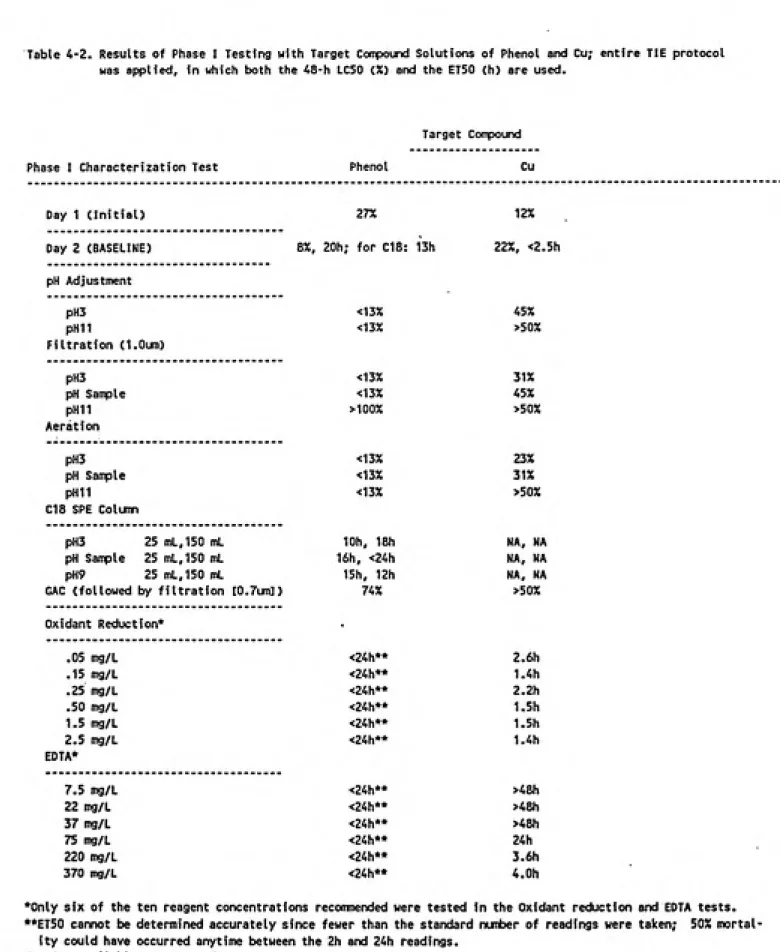
4-2 Results of Phase I Testing with Target Compound Solutions of Phenol and Cu; entire TIE protocol was applied, in which both the 48-h LC50 (%) and the ET50 (h) are used...83 4-3 Qualitative Assessment of Toxicity Reduction for
Target Compounds in Phase I TIE Tests...84 4-4 Acute Toxicity Characterization of WWTP Samples...91 4-5 Acute Toxicity Testing of Whole Effluent from
High Point Westside WWTP...97 4-6 ET 50 Values in Hours for Phase I Testing at
Fayetteville, N.C...119 4-7 Change in Toxicity Effected by Phase I
Characterization Tests Performed on Fayetteville
Effluent Samples...120
-*W?SWSW^aBf'''wWr-.
Xll
ACKNOWLEDGEMENTS
I wish to extend a special thanks to Dr. Francis A. DiGiano, my advisor, for guidance in this project.
Appreciation is given to Dr. Charles M. Weiss, Dr. Donald E. Francisco and Stephen R. Shoaf for project ideas. Thanks also to C.L. Lassiter and Tory L. Champlin for their
invaluable aid.
This report is dedicated to the memory of Marilyn J. Maerker, chemist and laboratory technician, whose personal assistance and dedication to this project were indispensible to the completion of my graduate studies.
1. INTRODUCTION
1.1 Background
The Toxicity Reduction Evaluation (TRE) was developed by the Environmental Protection Agency (EPA) to address the problem of NPDES permittees in violation of state water quality-based toxicity standards. The TRE approaches the
problem initially through testing of whole effluent toxicity
(using bioassay) as opposed to traditional chemical-specific analyses for the 126 "priority pollutants".The TRE consists of a Toxicity Identification
Evaluation (TIE) and a Toxicity Source Evaluation (TSE). The TIE comprises three phases: Phase I utilizes simple treatment processes in order to characterize the
physical/chemical properties of the toxicants into broad groups—volatiles, metals, solids, non-polar organics, and compounds with pH-dependent toxicity; Phase II specifically identifies these constituents analytically. Phase III
confirms the identity of the suspected compounds through various methods such as the addition of suspected toxicants
to non-toxic controls. The TSE tracks the source of
specific industries. This biological treatment approach, designed to simulate performance of the POTW, is termed a refractory toxicity assessment (RTA).
1.2 Objectives
This study addressed Phase I of the TIE. The specific research objectives are as follow:
1. Evaluate the validity of the Phase I toxicity
characterization test results by using target chemicals. 2. Conduct a TIE, Phase I at two POTW's with variable
effluent toxicity.
3. Study return activated sludge (RAS) as a possible source of toxicity.
2. LITERATURE REVIEW
2.1 Toxiclty-based Approach to Solving Effluent
Toxicity Problems
Under Title IV of the Clean Water Act of 1977, the
National Pollutant Discharge Elimination System (NPDES) sets
chemical and toxicity limits for point-source dischargers
through permit programs. These permits were initially based
on physical factors such as suspended solids and biological
oxygen demand (BOD) concentrations. Later, when toxicity
was considered a major concern, the 129 priority pollutants
were monitored through chemical-specific analyses. However,
since other compounds may also be toxic, limiting the
concentrations of the priority pollutants did not ensure
compliance with the Clean Water Act. Consequently, in 1984
the EPA recommended the inclusion of toxicity limits in
effluent permits: whole-effluent toxicity tests are used in
addition to chemical-specific analyses as the best approach
to point-source discharge permitting. Periodic monitoring
of effluent discharges with toxicity tests is required for
implementation of the NPDES permit program. Failure to
comply with toxicity limits may necessitate a TRE to take
measures to eliminate or treat toxicity-causing compounds
4
Figure 2-1 shows the components of a TRE. The
overall objectives of a TRE are to assess the source(s) of
toxicity, determine the fate of toxicity during treatment,
and to evaluate the pass-through of toxicity after
treatment.
2.1.1 The TIE Component of a TRE
The purpose of the TIE is to identify the specific
chemicals causing toxicity. The TIE'S toxicity-based
approach has many advantages over the conventional chemical
-specific approach (Burkhard & Ankley, 1989):
• The toxicity-based approach measures toxicity by
observing the direct effect on the test organism.
Tracking toxicity through sample manipulations by
using the test organism as detector is easier, faster and cheaper than the chemical-specific
method.
• The analytical approach may fail if the
instrumentation used is incorrect or not sensitive enough to detect the toxicant(s).
• Toxicity data bases for chemicals identified
analytically are often limited.
• For complex mixtures of toxicants detected,
methods for predicting toxicity are extremely
limited in evaluating the effect of synergistic
and antagonistic interactions as well as matrix
effects.• The presence of hundreds or even thousands of
chemicals may make the tasks of identification
and toxicity evaluation extremely impractical and
expensive.
Figure 2-2 shows an overview of the TIE Phase I
TREATABILITY
APPROACH
l
Effluent Sample
Phase
Toxicant Characterization Tests
Treatability Approach
or Identify Toxicant
IDENTIFY TOXICANT(S)
Phase II
Toxicant Identification Analyses
Toxicity Treatability
Evaluations
Phase
Toxicant Confirmation Procedures
Based on Site Specific
Considerations
I
Source
Investigation
J
Control Method Selection
and Implementation
J
Post Control Monitoring
Figure 2-1. Flow Chart for Toxicity Reduction Evaluations
Toxic Effluent Sanple
Baseline
Toxicity Test
(Day 2)
Initial
Toxicity Test
(Day 1)
Aeration
Test (Day 2)
Acid PHl Base
Filtration
Test (Day 2)
Acid PHl Base
pH Adjustooent Test (Day 2)
r
Acid Base
i
EDTA
C2ielation
Test
(Day 2)
Oxidant
Reduction Test
(Day 2)
Cj^g Solid Phase
Extraction Test
(Day 2)
Acid PHl Base
Graduated pH Test (Day 2)
pH 6 FH 7 pH 8
Figure 2-2 Overview of Phase I Effluent Characterization
Tests. (Note: pHi stands for initial pH.)
1988). Aliquots of effluent samples are subjected to the
Phase I Characterization tests and are subsequently used in
toxicity tests using Ceriodaphnia dubia fC. dubia) or
Daphnia maqna as the test organism.
The LC50 toxicity test is conducted using serial
dilutions of the whole sample for different exposureconcentrations. The LC50 value is the concentration
estimated by interpolation which produces 50% mortality at
the end of the 48-h test period.
The ET50 test is a timed-lethality test conducted on
the 100% concentration sample. Mortality readings are taken
at specified intervals, and interpolation is made to find
the ET50 value, which is the time required for 50% mortality
of the test species.
The Initial Test screens effluent samples for toxicity
and is used to provide an estimate of the 24 hour LC50 forpurposes of choosing exposure concentrations for subsequent
testing.
The Baseline Toxicity Test (performed on Day 2)
determines the toxicity of the whole, untreated sample. It
is used as the standard to which results of toxicity testing
on aliquots carried through characterization treatments are
compared. Differences in toxicity resulting from atreatment manipulation are used to obtain an indication of
the physical/chemical nature of the toxicants present.
The pH Adjustment Test examines the effect of pH on the
8
volatility, stability and speciation of a compound can be
affected by changes in pH, affecting its toxicity as well as
its bioavailability. Acids, bases, metal ion complexes and
organics are particularly affected by pH changes. The pH
Adjustment test also serves as a control for other Phase I
treatment tests performed at low and high pH. NaOH and HCl
are used to change the pH of two aliquots of the whole
effluent sample to pH 11 and pH 3, respectively. After
completion of all Phase I manipulations involving
pH-adjusted effluent samples, the pH of each aliquot is
returned to the initial sample pH for toxicity testing.
The Aeration Test is designed to remove toxicity
attributable to volatile and/or oxidizable compounds.
Compressed air is filtered and bubbled through effluent
samples using glass diffusers. The test is conducted on
aliquots at pH3, sample pH and pHll.
The Filtration Test provides information on toxicants
associated with filtrable particles. Compounds sorbed to
solids may or may not be available to aquatic organisms
depending on whether or not the route of exposure includes
ingestion. The test is performed at low and high pH (as
well as sample pH) to examine changes in toxicity due to the
removal of precipitates and organics which sorb to solids at
extreme pHs due to change in polarity or ionic strength.
The EDTA Chelation Test indicates to what extent
toxicity is due to heavy metals present in an effluent
^^^^^^^^^s-T-^:i^..i^i^h
with most cationic metal ions to form a relatively non-toxic
complex. A range of EDTA concentrations are added to ten
aliquots of sample in an attempt to titrate the sample near
the midrange concentraton. /
In the Oxidant Reduction Test, sodium thiosulfate
(Na2S203) is used as the reagent to reduce oxidants in the
effluent sample tested. Chlorine, bromine, iodine, chlorine
dioxide and chloramine are all oxidants found in wastewaterwhich may contribute significantly to toxicity. To perform
the test, increasing quantities of Na2S203 are added to ten
aliquots of whole sample to bracket the exact concentration
needed to remove oxidant toxicity.
The C18 Solid Phase Extraction Test is designed to
determine to what extent toxicity is caused by non-polar
organics and metal chelates. The effluent sample is passed
through a small column packed with an octadecyl (C18)
sorbent. After passage of the sample through the column,
aliquots are collected for toxicity testing. Sorption of
the effluent sample adjusted to extreme pH's may extract
organic acids and bases.
If the C18 significantly reduces toxicity. Phase II may
be used to identify the nonpolar organic toxicants retained
by the column. This is accomplished by sequentially eluting
the CIS column with small volumes of 25, 50, 75, 80, 85, 90,
95 and 100 percent MeOH/H20 mixtures. These eluted
10
passed through a smaller C18 column. This column is eluted using a small volume of 100 percent MeOH in order to
concentrate the toxic analytes further. This eluent is then injected into a reversed-phase HPLC column which is
subsequently eluted with a concentration gradient of
MeOH/H20 mixtures. The toxic fractions eluted are further concentrated through a small C18 column in final preparation for GC/MS analyses.
The Graduated pH Test is designed to determine if ammonia should be further investigated as a toxicant in a particular effluent. It addresses ammonia specifically because of its frequent presence in effluents. Ammonia
toxicity is largely dependent on pH because it is the NH3
rather than the NH4''' species which causes toxicity. The
test compares the toxicity of the sample at pH 6, 7 and 8. A trend of increasing toxicity with pH (and thus greaterfraction of NH3) indicates the presence of ammonia toxicity.
2.2 Phase I Studies Using Prepared Solutions
In designing the TIE protocol, EPA conducted some Phase I and Phase II experiments using solutions of control water spiked with known toxicants as well as limited studies with effluent samples in order to evaluate the performance of the Phase I Characterization tests. (Anderson-Carnahan, Personal Communication, 1988) This work included EDTA chelation with metals, filtering at pH3 and pHll, ammonia and chlorine
11
using synthetic effluent as well as solutions of
organo-phosphates. These studies were not available to the public
but were in the form of prepublication memoranda andlaboratory notes. Ms. Anderson-Carnahan (Personal
Communication, 1988) emphasized that toxicants may behave
very differently in an effluent solution matrix than they
would in control water.In order to avoid toxicity caused by excessive
reagent-addition concentrations in the Phase I manipulations, thePhase I protocol includes acute toxicity data generated by
the EPA Environmental Research Laboratory in Duluth, MN(ERL-MN) for Ceriodaphnia dubia (C. dubia) and other
bioassay test organisms in solutions of NaCl (for the pHadjustment test), EDTA and Na2S203. (Norberg-King et_al,
1991)
2.3 TIES Conducted at POTWs
2.3.1 Patapsco WWTP in Baltimore, Maryland
One of the first TREs conducted at a POTW was initiated
in April, 1986 at the Patapsco WWTP in Baltimore, MD and
completed in September of 1987 (Botts, Braswell & Sullivan,
1988). The Patapsco plant was selected for the EPA project
as a typical urban plant with a large industrial
contribution, because of Microtox-toxicity (defined as a
reduction in light output capability of a strain of marine
photoluminescent microorganisms that resemble photobacterium
12
effluent, and because plant personnel had toxicity
monitoring experience. The research conducted at Patapsco by Engineering-Science, Inc. (ESI) and EA Engineering, Science and Technology (EA) was intended to provide
technical support for toxicity management under the NPDES system by evaluating and developing appropriate protocols for TREs at municipal WWTPs.
The Patapsco WWTP consists of primary settling, oxygen-activated sludge treatment (started up in 1983), secondary clarification and finally disinfection with chlorine
dioxide. The plant design flow is 70 million gallons per day (MGD) but currently operates at an average flow of 45 MGD.
The waste stream toxicity and plant performance were characterized by examining both grab and composite samples of influent; primary, secondary and final chlorinated effluents; as well as primary sludge, mixed liquor and RAS
from the aeration basins.
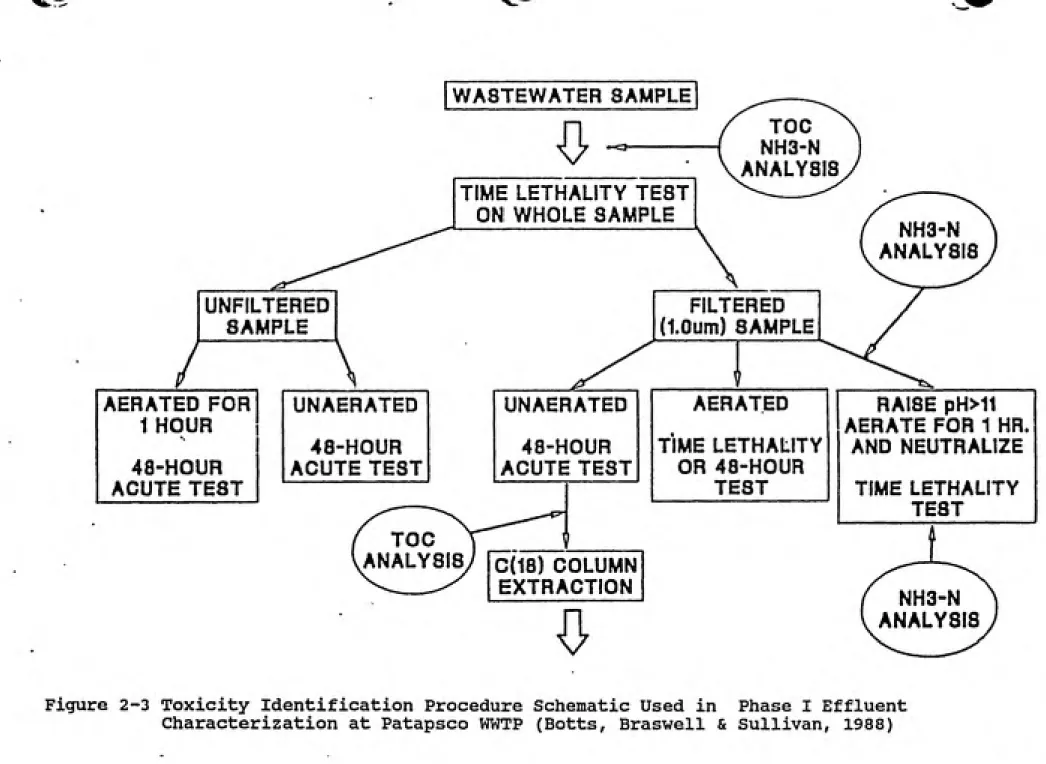
As shown in Figure 2-3, the wastewater effluent samples were subjected to TIE fractionation according to a modified version of the Anderson-Carnahan test procedure then
available in draft form. (See Figure 3-1). It may be noted that in addition to fractionation (by methanol elution) of non-polar organics sorbed by the CIS, acid and base exchange
resins were used to isolate both cationic and anionic
m
^
WASTEWATER SAMPLE
f)
TIME LETHALITY TEST
ON WHOLE SAMPLEUNFILTERED SAMPLE
/
\
AERATED FOR 1 HOUR 48-HOUR ACUTE TEST
UNAERATED 48-HOUR ACUTE TEST
UNAERATED 48-HOUR ACUTE TEST
TOC
ANALYSIS
rc(18) COLUMN
EXTRACTIONJ}
TOC NH3-N ANALYSIS
NH3-N ANALYSIS
FILTERED
d.Oum) SAMPLE
AERATED TIME LETHALITY
OR 48-HOUR TEST
RAISE pH>11
AERATE FOR 1 HR.
AND NEUTRALIZE
TIME LETHALITY TEST
NH3-N ANALYSIS
Figure 2-3 Toxicity Identification Procedure Schematic Used in Phase I Effluent
Characterization at Patapsco WWTP (Botts, Braswell & Sullivan, 1988)
C(16) COLUMN
EXTRACTIONEFFLUENT FROM COLUMN
1
TIME LETHALITY TEST
IF TOXICITY OCCURS
V
SEPARATION OF SAMPLE USING ANION AND CATION
EXCHANGE RESINS
i
48-HOUR ACUTE TEST
TOC ANALYSIS
COLUMN
V
ELUTED WITH INCREASING CONCENTRATIONS
OF METHANOL
J
TIME LETHALITY TEST
1
48-HOUR ACUTE TEST
15
inductive coupled plasma (ICP). Table 2-1 shows the TIE results (as LC50's) for one primary effluent and five secondary effluent samples. While filtration and ammonia stripping produced a noticeable reduction in toxicity in some cases, non-polar organics were strongly indicated in all samples as the major toxicant group according to the results of the C18 pass-through. Furthermore, compounds eluted from the column at 80 to 95 percent methanol
concentrations proved to be the most toxic. Although the specific sorbed compounds were not identified, the
octanol/water partition coefficient, Kow, of the compounds
in the most toxic fractions was estimated to be
approximately 3.6 to 9 expressed as log Kow (Botts, Braswell & Sullivan, 1988).
Interestingly, chemical-specific analyses of priority pollutants for the six samples yielded results contrary to those of the TIE: while four of the samples showed no high concentrations of any priority pollutant, two of the samples contained high metal concentrations.
2.3.2 Cross Creek WWTP in Fayetteville, N.C.
In July, 1989, Engineering-Science, Inc. (ESI) in Fairfax, VA., in cooperation with EA Engineering, Science and Technology (EA) of Sparks, MD were employed by EPA to conduct a TRE at the Cross Creek WWTP in Fayetteville, N.C.
Table 2-1 AOTTE TOXICITY OF FRACTIONS OF PRIMARY EFFLUENT AND
SECONDARY EFFLUENT WASTEWATERS FROM PATAPSCO WWTP
(Botts, Braswell & Sullivan, 1988)
Ceriodaphnia dubia 48-hr LC^^^ (as percent sample)
Sample Fraction SE* 7-9-86 PRI EFFL** 7-23-86 SE 7-23-86 SE 12-10-86 SE 1-6-87 SE 1-8-87 Whole sample + 1.7 (1.2-2.3) 0.6 (0.5-1.0) 1.9 (1.1-3.4)
Whole sample, aerated
to constant pH
4.8
(3.8-6.6)'
1.1 (0.8-1.6) 4.6 (3.2-6.5) 2.7 (1.8-4.2) 0.7 (0.4-1.6) 1.0 (0.3-1.8) Filtered sample(1.0 um), unaerated
5.9 (3.2-13.5) 4.6 (3.2-6.5) 14.6 (6.5-40.5) 5.5 (3-10) 2.3 (1.5-3.4) 4.6 (3-7) Filtered sample
aerated to constant pH
9.4 (6.5-13.5) 2.9 (1.6-6.5) 9.4 (6.5-13.5) 5.5 (0.4-10) 4.6 (3-7) 2.5 (1.6-4.0)
Filtered sample, raised
pH >11, aerated 1 hr.
— — 5.5
(3-10) 19.4 (15-25) 7.5 (4.3-26.2) and neutralized
Cjj Column Extraction:
C^j pass-through
>100 >100 >100(41.0-68!4)
51.5 >100>100
C., column eluted with
Table 2-1 (Continued) Sample Fraction SE 7-9-86 PRI EFFL 7-23-86
Ceriodaphnia dubia 48-hr LC^^ (as percent sample)
SE 12-10-86 SE 7-23-86 SE 1-6-87 SE 1-8-87
C column eluted with
80% MeOH 273.0
(100-500) 70.2 (50-100) 70.2 (50-100) 24.0 (21.2-34.8) 22.0 (19.4-25.0) 1.5 (1.0-2.8)
85% MeOH 76.1
(50-100) 22.6 (20.4-25.2) 35.4 (25-50) 15.6 (12.5-19.4) 10.8 (9.4-12.6) 1.3 (0.8-2.6)
90% MeOe 10.8
(9.5-12.6) 7.0 (5.0-8.8) (6 9.8 .1-14.3) 158.1 (100-250) 133.4 (50-250) 345.4 (250-500)
95% MeOH 38.0
(25-50) 32.9 (25-50) 32.9 (25-50) >500 353.5 (250-500) 500 (250->500)
' 100% MeOH >500 353.6
(250-500)
>500 >500 426.8
(250-500)
426.8
(250-500)
Dowex 50W-X8
(cation exchange resin)
+
50.0
(25-100)
Dowex 2-X8
(anion exchange resin)
51.5
(41.0-68.4)
«
SE » Secondary effluent wastewater sanple. PRI ht'tL " Primary effluent wastewater sample.
* Acute toxicity test not performed on this fraction.
18
research included two Phase I and two Phase II TIE analyses
to study the nature and variability of acute effluent
toxicity and to confirm the TIE results reported here and in DiGiano, et al. (February, 1992).
The results of the two Phase I studies are presented in
Tables 2-2 and 2-3. The September, 1989 sample was
analyzed by EA toxicology laboratory; the October, 1989 sample was tested by the EPA Ecological Support Branch, Environmental Research Laboratory in Athens, GA. Results are presented as "acute toxic units" (100%/48-h LC50 value).
The TU of the Baseline sample taken in September was 2.8; this corresponds to an LC50 of 36% (100/2.8). The C18 column reduced toxicity at all three pH's, suggesting that non-polar organics were the major toxicant characterization group present. The pH Adjustment Test performed at pH3 also reduced toxicity, although to a lesser degree than the
column.
The October 1989 sample displayed a Baseline toxicity of 2.2 toxic units to C.dubia-nearly the same as that of the September sample. Bioassays using Pimephales promelas
(fathead minnow) produced an LC50 > 100% (acutely non¬
toxic) . Again, the C18 column greatly reduced toxicity, as
seen in Table 2-3. Lesser reductions occurred with
Filtration after adjustment to pH3 and with Aeration at pH3 and pHll.
Table 2-2 Summary of TIE Phase I Characterization
Results-September, 1989, Fayetteville Cross Creek WWTP. 19
(Fillmore, et al.. 1990)
TIE Phase I 48-hour Ceriodaphnia Acute Toxic Units* Treatment*
Sample Collection*
9/13/89-9/14/89
Initial Toxicity 3.0
Baseline Toxicity 2.8
pH Adjustment
pH 3 1.9
Original pH 2.8
pH 11 2.8pH Adjustment/Filtration
pH 3 1.8
Original pH 2.8
pH 11 2.8 pH Adjustment/Aeration
pH 3 2.0
Original pH 2.8
pH 11 2.8pH Adjustment/Filtration/Ci8 SPE Column
pH 3First 30 ml < 1.0
Last 3 0 ml < 1.0
Original pH
First 30 ml < 1.0
Second 30 ml < 1.0
pH 9
First 30 ml < 1.0
Table 2-3 Summary of TIE Phase I Characterization
Results-October 1989, Fayetteville Cross Creek WWTP. 20
(Fillmore, et al.. 1990)
TIE Phase I 48-hour Ceriodaphnia Acute Toxic Units*
Treatment*
Sample Collection* 10/16/89-
10/17/89Initial Toxicity 2.8
Baseline Toxicity 2.2
pH Adjustment
pH 3 2.5
Original ,pH 2 . 2
pH 11 . 2.8
pH Adjustment/Filtration
pH 3 1.6
Original pH 2.8
pH 11 2.5
pH Adjustment/Aeration
pH 3 1.6
Original pH 2.5
• pH 11 1.4
pH Adjustment/Filtration/Ci8 SPE Column
pH 3
First 25 ml . < 1.0
Last 950 ml < 1.0
Original pH
First 25 ml < 1.0
Second 950 ml < 1.0
pH 9First 25 ml < 1.0
21
Anderson-carnahan of EPA suggested that the results could be interpreted more specifically to indicate non-polar
organophosphate pesticides for the following reasons (Fillmore, et al.. 1990):
• "The effluent was non-toxic to fathead minnows.
Fathead minnows are reportedly at least 100 times more resisitant to some organophosphate pesticides
(e.g., diazinon) than Ceriodaphnia (USEPA, 1988a and USEPA 1987).
• Organophosphate pesticides (e.g., diazinon,
malathion) typically elute in the 80%, 85%, and 90% methanol/water fractions (USEPA, 1988a and USEPA
1987).
• The reduction in toxicity following pH 3 adjustment may be due to hydrolysis of organophosphate
pesticides (Meier, et al., 1979).
• Organophosphate pesticides are widely used in the
southeastern United States. Diazinon has been
observed to be a cause of acute effluent toxicity to Ceriodaphnia at effluent concentrations as low as 0.35 ug/L (USEPA 1989e) and has been found to
contribute to acute effluent toxicity at other WWTPs throughout the nation."
Further work was conducted on February and March, 1990 effluent samples from the Cross Creek WWTP using only Phase
II identification procedures for non-polar organic
compounds. The National Effluent Toxicity Assesssment Center (NETAC) in Duluth, MN, under the direction of Dr. Donald Mount conducted analyses on the February sample; EA toxicology laboratory performed the Phase II work on the March sample (Fillmore, et al.. 1990).22
of varying methanol concentrations. After this elution process, each fraction was tested for toxicity. Toxic fractions were further concentrated and identified using GC/MS and HPLC. The combined results of the Phase II work, shown in Table 2-4 show that passage of the effluent through the C18 again greatly reduced toxicity in both samples.
Fractions eluted at 85% and 90% methanol/water solutions showed the greatest toxicity. The sum of the toxic units of each of the two fractions was nearly equivalent to the toxic units of the whole effluent, confirming that the ClB-sorbed toxicants accounted for the majority of the toxicity present in the effluent sample.
GC/MS analysis of the toxic fractions (after HPLC concentration techniques) identified the pesticide,
diazinon, as the major constituent present in both samples. Other constituents identified in the March sample included N, N-diethyl-3-methylbenzamide and
2-(methylthio)-benzothiazole, as well as traces of four phthalate compounds and seventeen unknown peaks. Recovery-corrected diazinon concentrations in the whole effluent samples for February and March were 0.58 ug/L and 0.35 ug/L respectively. (The reported diazinon LC50 range for C.dubia is 0.30 ug/L to 0.50 ug/L) .
Table 2-4 Summary of TIE Phase II Analyses, Fayetteville
Cross Creek WWTP. (Fillmore, at al.. 1990)
23TIE Phase II
Treatment
Secondary Effluent Sample*
2/5/90-2/6/90
3/19/90-3/20/90
Whole effluent acute
toxic units*
1. 6 1.25
Ci8 SPE column treatment* < 1.0 < 1.0
Toxic Ci8 SPE fractions^ 85% and 90% 85% and 90%
Toxic units for combined
toxic fractions
1.33 100%**
Recovery corrected whole effluent
diazinon concentration (/ig/1)**
0.58 0.35Diazinon toxic unitsaa 1.2 - 1.9 0.7 - 1.2
Secondary effluent composite sanple.
* Acute toxic units for Ceriodaphnia (100/48-hour LC50)
Acute toxic units following Cig SPE colunn treatment.
Toxicity to Ceriodaphnia was observed in the 85X and 90X C18 SPE colum eluates. Acute toxic units for toxicity test for the combined 85X and 90X toxic fractions.
** IpOX mortality was observed in lOOX concentration of the combined 85X and 90X C18 SPE coluin eluates
(i.e., > 1.0 toxic units).
Value considers concentration steps, and elution, extraction and recovery efficiencies.
Diazinon chemical toxic units were calculated using 0.30 pg/l to 0.50 //g/l as a range of diazinon LC50
24
suspected as a possible cause of acute effluent toxicity to Ceriodaphnia at the Cross Creek WWTP." In addition,
organophosphate pesticides (e.g. diazinon, malathion,
dichlorvos, chlorfenvinphs) were cited as one possible type of non-polar organics contributing toxicity. Finally, the report recommends further TIE Phase II testing to identify other non-polar toxicants present in the Cross Creek
effluent and determine their concentrations and variability. 2.4 Biomass Toxicity Studies
2.4.1 Importance of Biomass Studies in Controlling Toxicity Problems
Accumulation onto biomass or other sludges in a WWTP has been shown to be a significant removal mechanism
for many toxic compounds found in the wastewater (Bell & Tsezos, 1987). While this biosorption phenomenon may be a cost-effective removal method for biorefractory organic pollutants, ultimate disposal of the waste sludges poses another toxicity problem, since the sorbed pollutants may desorb into the new environment. An accurate prediction of the fate of toxicants in a treatment plant requires further study of the processes and mechanisms that control their biosorptive behavior (Bell & Tsezos, 1987; Bell & Tsezos,
25
2.4.2 Modeling of the Removal of Organic Compounds by Biosorption
Bell and Tsezos (1987) studied the removal of five toxic organic compounds by sorption onto inactive biomass from solutions of low pollutant concentration in water. A Freundlich isotheirm model was developed for adsorption of lindane, pentachlorophenol, diazinon, malathion and 2-chlorobiphenyl onto both activated sludge and Rhizopus
arrhizus by contacting solutions of different concentrations of each compound with different masses of biomass. After three days contact time on an orbital shaker, the solute of each sample was extracted from the water solution using
hexane or iso-octane and its concentration was measured.
The quantity of solute sorbed by the biomass was determined by a mass balance calculation. Figure 2-4 shows the
sorption isotherm for lindane onto activated sludge. Desorption experiments were also conducted using
biomass exposed to each of the five organic compounds in the manner described for the adsorption experiments. After
settling of the biomass, the supernatant liquid was decanted and replaced with an equal volume of distilled/deionized water and the samples were left on the shaker for three days. Compound extraction and analysis and mass balance were employed, as in the sorption experiments, to yield the concentrations of compound retained by the biomass and that released into solution, from which Freundlich isotherms were
26
10'
ͣ
^10'
^10'
'To'
, MillTfT TT]---1---r—T~t-rTTX
10' 10' 10'
Liquid Phase Concentration (jig/L)
ͣ
' ͣ ͣ I 11111
10'
Figure 2-4. Sorption Isotherm of Lindane on Activated Sludge
27
It was generally found that desorption equilibrium isotherms were nearly identical to those of the sorption isotherms, indicating reversibility.
The parameter 1/n in the Freundlich equation:
q = KfCeVn
whereq = equilibrium concentration of adsorbate on biomass, ug/g
Cg = equilibrium concentration of adsorbate in solution, ug/L
was calculated to be close to one in most of the samples tested, producing a linear isotherm and suggesting
partitioning in another phase in contrast to adsorption on specific sites. Table 2-5 gives the experimental values of Kf and 1/n for the compounds tested. It was also found that the equilibrium sorptive uptake was independent of the
biomass concentration in solution.
While sorptive uptake might be expected to be inversely proportional to water solubility of the compound, this study showed that water solubility of the five compounds tested was not a reliable indicator of partitioning phenomena onto biomass. However, the octanol/water partition coefficients
(log Kow) of four of the five adsorbates tested proved to correlate well with adsorptive uptake onto the biomass.
Since hazardous compounds seldom exist alone in a wastewater. Bell and Tsezos (1988) did further work to examine whether competitive effects were involved in
28
Temperature,
Compound Biomass °c K, I/n
Lindane R. arrhizus 34.5 , 1.6 1.0 20.0 2.3 1.0 5.0 3.2 1.0
Activated 34.5 0.7 1.1
sludge 20.0 1.5 1.0
6.0 1.8 1.0
Pentachlorophenol R. arrhizus 20.0 28.8 0.9 Activated 20.0 10.1 0.8
sludge
Diazlnon R. arrhizus 20.0 1.9 0.8
5.0 0.1 1.3
Activated 20.0 0.4 1.0
sludge 5.0 0.1 1.2
Malathion R. arrhizus 20.0 3.7 1.2 5.0 0.04 1.2
Activated 20.0 403.0 0.6
sludge 5.0 0.5 0.9
2-Chlorobiphenyl R. arrhizus 20.0 62.6 1.1 Activated 20.0 20.5 0.8
sludge
29
Again, activated sludge as well as R.arrhizus were the selected biomass species, and lindane, pentachlorophenol, diazinon and malathion were used to study the selectivity of the biosorption process. The biosorption of each compound
in competition with one or more additional compounds in solution was then compared to the single solute uptake
isotherm found in earlier work.
The results indicated that, for the combination of chemicals tested, biosorptive uptake of a particular
compound was virtually unaffected by the presence of other compounds in solution. Calculation based on cell size and
the number of molecules of each solute biosorbed indicated
that at the higher pollutant concentrations tested,
multilayer surface coverage must have occurred. With all surface sites loaded, any competitive effects should have been observed, if one assumes a mechanism of simple surface coverage is in effect. The authors suggest the presence of an absorption mechanism to explain the apparent absence of competitive effects. The fact that competitive effects are minimal allows for modeling of specific organic compounds removal by biomass in a WWTP using the single solute
30
2.4.3 Biomass Studies Conducted at WWTPs
A Pilot System Study Using Influent Spiked with Selected Compounds
The EPA has conducted pilot studies of the ability of various wastewater treatment processes to remove toxic
organics from an influent spiked with selected compounds of known concentrations. (Hannah et al.. 1986; Hannah et al.. 1988) One such study of the performance of an activated
sludge system noted the impact of removal by adsorption onto the secondary sludge. Analysis of the liquid phase of the waste activated sludge (WAS) revealed that concentrations of the volatile organics were low and nearly equivalent to
those found in the secondary effluent; concentrations of semi-volatiles were found in much higher concentrations than those present in the process effluent. This indicates that volatile organics have a low affinity to wastewater solids and do not accumulate in the sludge, while the semi-volatile compounds tend to concentrate in the solid phase of the
sludge.
Patapsco WWTP, Baltimore, MD
Patapsco WWTP RAS and MLSS biomass were tested for toxicity using the time-lethality test (Botts, Braswell & Sullivan, 1988). First the sludges were aerated to remove CO2. Then each sample was filtered through a glass-fiber
31
Results of toxicity testing with the RAS and MLSS
coarse-filter filtrates are shown below in Table 2-6. A
toxic unit (TU) was used to evaluate the degree of toxicity: complete survival of the test organism was assigned a value of zero (no toxicity); no survival, a value of 100 (extreme toxicity).
Table 2-6 Toxicity of Patapsco Activated Sludges (after Botts, Braswell & Sullivan, 1988) Sample Date Sludge Type Sludge Filtrate Toxicity*(TU)
7/7/87 RAS 46
MLSS 62
7/8/87 RAS 63 MLSS 66
7/9/87 RAS 61
MLSS 15
Samples were filtered through a coarse glass-fiber filter (Whatman 934-AH) and the filtrates were tested for toxicity.
The coarse filtrates of both sludge types exhibited toxicity. The mean TU value for the RAS was 57; the mean TU value for the MLSS was 34. A wide variability in
toxicity of the MLSS was seen between the 7/8/87 and 7/9/87 samples.
The sludge filtrates were also analyzed for acid-extractable organics, base-neutral organics and
pesticides/herbicides. No measurable concentrations of any
'ͣiv^^^?^^^^0!^^w-!~r'
32
Table 2-7 shows the concentrations of priority
pollutants found in the dewatered WAS/primary sludge mixture. Most of the maximum levels found at Patapsco exceeded the maximum concentrations observed in a previous EPA survey. The concentrations of pesticides, nitrobenzene and 2,4 dimethylphenol are much higher in the sludge than in the influent, suggesting that these compounds tend to
accumulate in the sludge.
Several treatment tests were performed on the Patapsco RAS to remove toxicity. In one test, the RAS was washed repeatedly in a series of buffered-saline solutions of decreasing ionic strengths. After several rinses in the citrate-phosphate buffer, the treated sample was filtered through a coarse glass-fiber filter and the filtrate was tested for toxicity. As shown in Table 2-8, the citrate-phosphate buffer rinse did not significantly reduce the toxicity of the three RAS samples treated.
Table 2-8 Results of Buffered Saline Treatment to Remove
RAS Toxicity* (after Botts, Braswell & Sullivan, 1988)
______________________Sludge Filtrate Toxicity fTU)**
Sample Date Whole RAS Treated RAS
7/15/87 65 56 7/20/87 46 23 7/22/87 42 44
* Samples were filtered through a coarse glass-fiber filter (Whatman 934-AH) and the filtrates tested for toxicity.
**Toxic Units; toxicity measured by time lethality test
33
Table 2-7 Comparison of Occurrence of Priority Pollutants
in POTW Sludge* Patapsco WWTP vs. 40 Other POTWs
(Botts, Braswell & Sullivan, 1988)
Patapsco WWTP 40 Cities
Concent
Study-Summary Priority Concentration (mg/1) Number of ration (mg/1)
Pollutants Mciximum Minimum Observations Maximum Minimum
Cadmium 20 11 6 95 0.004
Chromium 402 315 6 160 0.11
Copper 964 382 6 180 0.1
Lead 185 9 6 170 0.031
Mercury 1.99 0.001 3 0.69 0.0001
Nickel 156 <0.02 6 84 0.012
Selenium 50 <0.05 6 140 0.001
Silver 55 <0.05 6 24 0.015
Thallium 34 <0.075 6 0.031 0.001
Zinc 855 452 6 1100 0.07
alpha-BHC 0.03 — 1 ND ND
beta-BHC 0.043 — 1 ND ND
delta-BHC 0.011 0.0020 2 ND . ND
Bis (2-ethyl hexyl)
Phthalate 0.082 0.022 3 0.47 0.002
2,4 Dimethylphenol 0.829 — 1 0.298 0.014
Heptachlor Epoxide 0.007 0.0027 2 ND ND
Nitrobenzene 0.075 . 0.028 3 ND ND
ND =ͣ Not Detected
34
Another attempt to remove toxicity from the RAS samples
involved batch treatment of the biomass in solution with a
non-toxic synthetic substrate. The intent was to biodegrade the residual organic material in the sludge that may be the source of toxicity. Again, the filtrates of each sample, before and after treatment, were tested for toxicity and compared, as presented in Table 2-9.
Table 2-9 Results of Synthetic Substrate Treatment to Remove RAS Toxicity* (after Botts, Braswell & Sullivan, 1988)
Sludge Filtrate Toxicity (TU)**
65 61 88
46 39 75
42 __
80 Sample Date Whole RAS Day 1 Day 2
7/15/87
7/20/87 7/22/87
* Samples were filtered through a coarse glass-fiber filter (Whatman 934-AH) and the filtrates tested for toxicity.
**Toxic Units; toxicity measured by time lethality test
with C dubia.
The results indicate that the synthetic substrate treatment failed to reduce RAS biomass toxicity. Toxicity actually increased over a 2-day period. The synthetic substrate itself was not toxic to C.dubia (0 TU).
A third treatment test was used to determine if the
sludge toxicity was associated with particulate or soluble phases of the RAS. This Particulate Toxicity Evaluation
35
technique involved filtering the RAS successively through a glass-fiber filter, a 0.45 um. cellulose-nitrate filter
followed by a 0.2 um cellulose-nitrate filter. Toxicity tests were used to compare the original (glass-fiber filter) and final filtrates. Use of this technique recognizes that cellulose filters may absorb soluble organic toxicity.
Another technique involved centrifugation of the RAS original filtrate to remove colloidal-sized particles. Toxicity of the original filtrate was compared to that of
the centrate.
Table 2-10 shows the results of treatments to remove
colloidal-sized particles from the RAS samples in the Particulate Toxicity Evaluation.
Table 2-10 Results of Solids Removal Treatments to
Remove RAS Toxicity (after Botts, Braswell & Sullivan, 1988)
Sludge Toxicity (TU)**
Sample Date Whole RAS* Filtrate(0.2um.) Centrate
7/15/87 65 12 19 7/20/87 46 10 13 7/22/87 42 0 8
* Samples were filtered through a coarse glass fiber filter (Whatman 934-AH) and the filtrates tested for toxicity.
**Toxic Units; toxicity measured by time lethality test
36
•
The final filtrate (0.2 um-cellulose-nitrate filter) as well as the centrate of each sample are compared to the
"initial filtrate" (glass-fiber filter filtrate of whole RAS
sample). The toxic units can be used to express percentreduction of sample toxicity: the 0.2um. filter removed
from 78 to 100% initial RAS filtrate toxicity;
centrifugation removed from 71 to 81 per cent of same.
The results of the above test, which indicate that the
RAS toxicity was largely associated with particulates, agree
with the findings of the Patapsco WWTP effluentfractionation characterization tests. That is, acute toxicity in the wastewater was found to be due mainly to non-polar organic compounds, which would be expected to
adsorb onto solids.
2.4.4 Recommendations for Further Biomass Studies
Slattery (1988) pointed out the importance of choosing
the test organism for effluent toxicity evaluation, noting
that an effluent with negligible soluble toxicity-but with
significant toxicity associated with biomass particles that
escaped removal by settling-will usually produce no toxic
response in a species which does not ingest toxic
particulates. He feels that distinction should be made
between "solution toxicity" and "particulates toxicity"
through development of techniques to measure each
37
measuring "whole toxicity", claiming that the result would
be dependent on the choice of test organism.
Based on the findings of the Patapsco study, the EPA
recommended testing enhanced solids removal techniques (such
as coagualation/precipitation or filtration) on final
effluent for sorbable toxicity reduction (Bishop, Botts &
Dobbs, 1990).2.5 Evaluation of Phase I TRE Protocol
The case study conducted at Fayetteville by EA and ESI
indicated that all the components of the TRE protocol are
important and necessary, and the results of each must be
considered together in assessing the nature and sources of
compounds causing whole effluent toxicity (Fillmore, et al..
1990). Slattery (1988), commenting on the Patapsco study,
concluded that solution toxicity and particulates toxicity
should be distinguished and techniques developed to measure
both separately.
Current research at the University of North Carolina is
directed at development of the TRE to insure greater success
in conclusively identifying toxicity-causing compounds at
WWTPs. As shown by this literature review, the documented
results of TRE programs is sparse. More experience is
needed with the protocol. In addition, past studies have
rarely identified a specific toxicity-causing compound.
Municipalities need a greater rate of success from the TRE
38
The results of the research to be discussed in this
report have been published as part of a larger study of the
TRE protocol in case histories at High Point and
Fayetteville, NC (DiGiano, et al.. Feb., 1992).
A follow-up study at UNC was supported by the EPA
Center for Waste Minimization at NC State University and
focused on application of the TRE protocol to specific
industrial waste dischargers important in EPA Regions IV and
VI. A textile dyestuff manufacturer was selected for a case
history (DiGiano, et al.. 1992).
Another recent project, sponsored by the University of
North Carolina Water Resources Research Institute, dealt
with identifying the source of chronic toxicity at municipal
WWTPs. This research also examined the practicality of
using the chronic toxicity test given that it is much more
sensitive than the acute toxicity test. In particular,
considerable effort focused on the effect of diet and
culturing conditions on obtaining reproducible results in
the chronic test protocol (LaRocca, et al.. 1992).
ͣ
.".T?w-!?^':_=»^*-T
3. EXPERIMENTAL METHODOLOGY
3.1 Overview of the TIE Protocol
The TIE protocol incorporates a sequence of whole
effluent manipulations followed by bioassays. In order to
characterize the toxicants into physical/chemical groups,
the toxicity of a treated aliquot is compared with that of
the baseline measurement. A treatment producing a
significant reduction in toxicity indicates the presence of
a corresponding generic group of compounds. In some areas
of this research the sequence of manipulations was altered
from the EPA protocol and/or several manipulations were
added or deleted, as will be explained subsequently.
All bioassays were conducted in duplicate, 30-mL
medicine cups using five Ceriodaphnia Dubia (C. Dubia) and
10 mL of sample per cup. Mortality of the test organisms
was observed, in most cases, at 0.5, 1, 2, 4, 8, 24 and 48h.
These data were interpreted in four different ways, as
explained in section 4.1.2, in order to define a
"significant reduction in toxicity".
All laboratory glassware was washed with detergent,
40
this project was prepared initially by immersion in 10%
nitric acid for three days. Bioassay cups were rinsed in tap water, de-ionized water and sample before use.3.2 Target Compound Testing
3.2.1 Selection of Target Compounds
Target compounds were selected for verification of
Phase I toxicity characterization test methods according to
two criteria: their impact as toxicants at the High Point Westside WWTP and their physical/chemical characteristics. The physical/chemical characteristics of several compounds were reviewed with the objective of selecting an array of chemicals such that each would be removed by a different Phase I test and only by that test. For example, avolatile, non-adsorbable organic would supposedly be removed by air stripping alone; a cationic metal would be chelated by EDTA but not removed by any other Phase I test.
Parameters used to determine the physical/chemical
characteristics relevant to the Phase I tests were the
Henry's Constant (Ku), the log of the octanol/water partition coefficient (log Kow), solubility and the
molecular weight (MW). Unfortunately, it was not always
possible to find a target compound of significance to
domestic wastewater toxicity with properties that would
limit its removal to only one characterization test.
The target compounds chosen were the following:
41
mole hydrophobe (NPE-9), 1-methylnaphthalene (1-MN), copper (Cu) and phenol. NPE-9, a surfactant used industrially, had been identified consistently in the High Point Westside WWTP effluent (Storm, DiGiano & Christman, 1989) and was
suspected to be a major contributor to acute toxicity. A non-ionic compound, it was chosen as a toxicant that would be removed by the C18 column and through adsorption onto activated carbon. Earlier work (Storm, DiGiano & Christman, 1989) cited 1-MN as a suspect toxicant and the compound found in the Westside influent with greatest frequency. Also, 1-MN was representative of compounds which are both
volatile and adsorbable. To evaluate the metal chelation
test of Phase I, copper (Cu)-a highly toxic metal- was a logical choice for a target compound, based on earlier studies (Storm, DiGiano & Christman, 1989) at Westside, in which it was found present in high concentrations (0.10 mg/L) in the influent. Phenol, found in the Westside WWTP influent by the NC Division of Environmental Management
(DEM) in 1983 was the target compound candidate for
evaluating the reliability of the Granular Activated Carbon (GAC) Adsorption Test. Phenol is "readily adsorbed" onto activated carbon (James M. Montgomery, Consulting Engineers, Inc., 1985). Table 3-1 shows a summary of the target
compounds used for EPA TIE Phase I test verification and their respective parameters and physical/chemical
Table 3-1
Target Coinpounds
Summary of Physical and Chemical Properties
Nonylphenol Ethoxylate with 9 Moles Ethylene Oxide per Mole Hydrophobe
(NPE-9)
1-Methylnaphthalene
(1-MN)
Copper
(Cu)
Phenol
Chemical
Formula
C H .^0 (Union Carbide
aa L(i Iff
^^ Corporation, 1981)
^11 "lO Cu C . H, 0b 6
Molecular
Weight
616.4 gm/mole 142.2 gm/mole 63.54 gm/mole 94.11 gm/mole
Solubility
in Water
>111,000 mg/L (Union Carbide
Corp., 1981)
26-2S mg/L (Grady, Jr., Personal Communication, 1993)
93,000 mg/L (Volskay, Jr.& Grady, Jr., 1988)
Henry's
Constant
atm.nr/molc
5.8x10 (Tabak, Personal Com¬
munication, 1989)
4.5x10 (Volskay. Jr & Grady, Jr., 1988)
Log Octanot/Water
Partition Coefficient
7.8 (Chanplin, 1989) 3.9 (Goodman, 1985) 1.46 (Callahan)
43
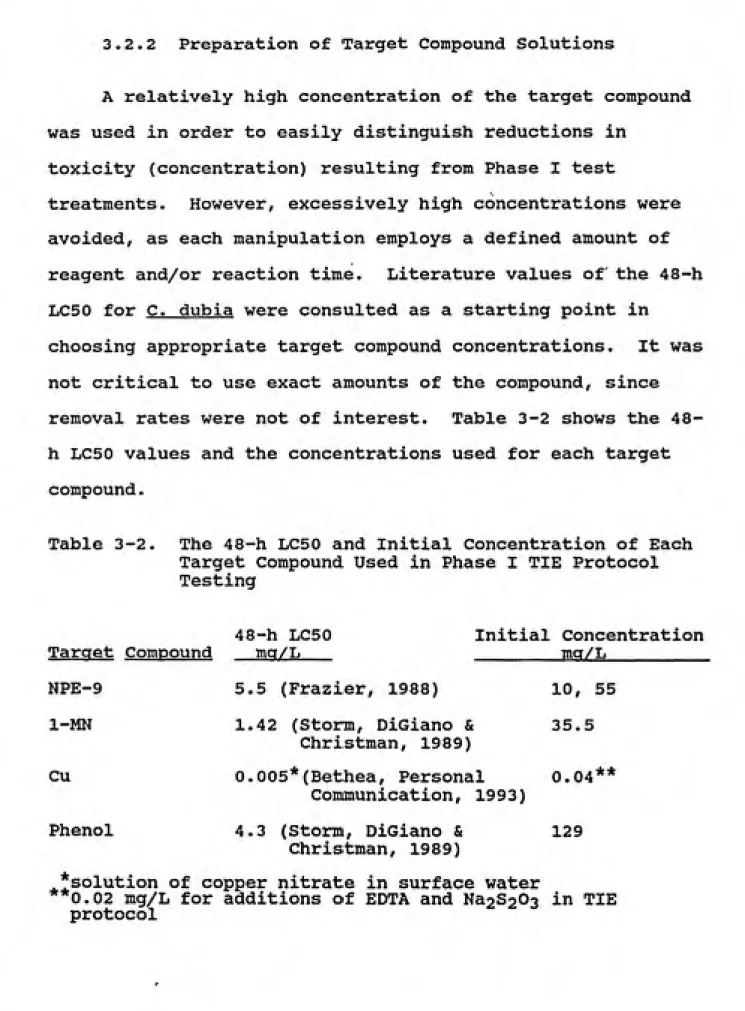
3.2.2 Preparation of Target Compound Solutions
A relatively high concentration of the target compound
was used in order to easily distinguish reductions in
toxicity (concentration) resulting from Phase I test
treatments. However, excessively high concentrations were
avoided, as each manipulation employs a defined amount of
reagent and/or reaction time. Literature values of the 48-h
LC50 for C. dubia were consulted as a starting point in
choosing appropriate target compound concentrations. It was
not critical to use exact amounts of the compound, since
removal rates were not of interest. Table 3-2 shows the
48-h LC50 values and t48-he concentrations used for eac48-h target
compound.
Table 3-2. The 48-h LC50 and Initial Concentration of Each
Target Compound Used in Phase I TIE Protocol
Testing48-h LC50 Initial Concentration
Target Compound ma/L _______mg/L_________
NPE-9 5.5 (Frazier, 1988) 10, 55
1-MN 1.42 (Storm, DiGiano & 35.5
Christman, 1989)
Cu 0.005*(Bethea, Personal 0.04**
Communication, 1993)
Phenol 4.3 (Storm, DiGiano & 129
Christman, 1989)
**
solution of copper nitrate in surface water
0.02 mg/L for additions of EDTA and Na2S203 in TIE
protocol
44
The stock solution for each target compound was
prepared using non-toxic (LC50 >48 hrs.) effluent from the Westside WWTP as the solvent (rather than control water) in order to simulate the background matrix in which the
representative target compounds would be found.
The NPE-9 stock solution was prepared by weighing out the correct amount of NPE-9 (a viscous compound) and adding it to the non-toxic background wastewater. The compound 1-MN, which is relatively insoluble in water, required an intermediate solvent. Methanol was chosen, since it is nontoxic to Ceriodaphnia in small concentrations (1.5
percent) (Champlin, 1989). After using the specific gravity of 1-MN (1.02) to determine the volume needed, a syringe was used to spike methanol at a concentration of 5000 x LC50. Both solvent and solute were chilled prior to spiking to
reduce volatilization. This intermediate solvent solution
was stored in the freezer (in order to reduce
volatilization) until needed. For the TIE, a wastewater
solution with a 1-MN concentration of 25 times the LC50 was
prepared by adding 5 mL of this 1-MN, methanol solution to 995 mL of non-toxic effluent. Again, both solvent and solute were chilled prior to mixing. It is noted that the MeOH concentration is about 0.5%, well below the toxic level. A solution of copper nitrate was prepared by weighing out and dissolving cupric nitrate crystals in
distilled water. This solution was then diluted in a
45
concentration of 40 ug/L. The phenol solution was prepared
by weighing out crystalline phenol, adding the crystals to a
volumetric flask containing non-toxic wastewater and heating
the solution to dissolve the crystals.3.2.3 Verification of TIE Protocol with Target
Compounds
The four target compounds used to evaluate the Phase I
TIE protocol were processed according to two different test
schemes as explained in this section. The objective was to
determine if any of the TIE tests in the EPA protocol
produced either false negative or false positive results.
For example, if Cu is the target compound, then the only
test that should reduce toxicity is chelation. A reduction
in toxicity produced by any other test(s) would be
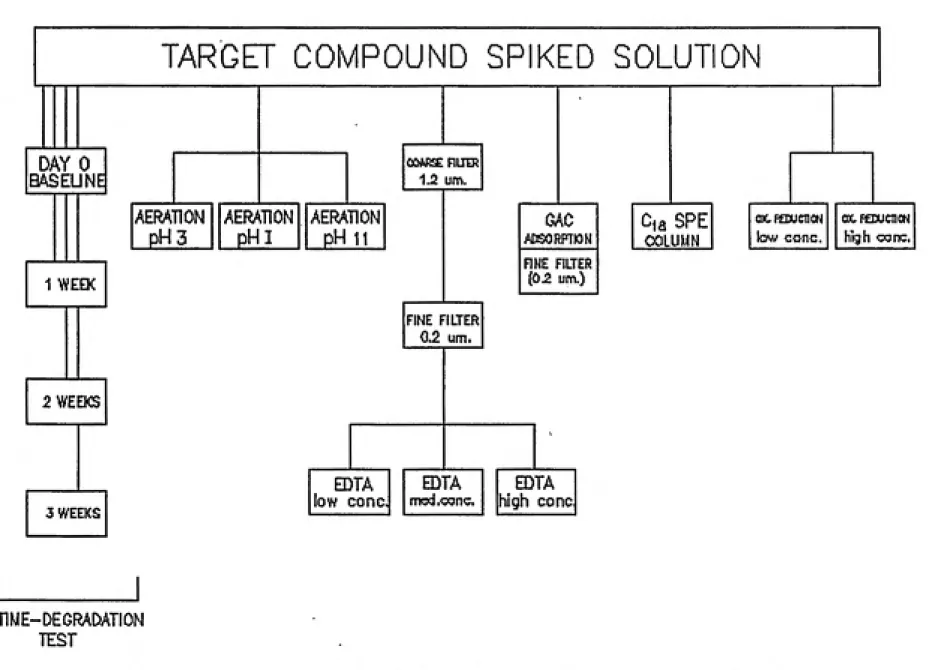
considered a false positive.TIE Scheme for NPE-9 and 1-MN
EPA's first draft protocol for the Phase I
Characterization Tests (Anderson-Carnahan & Mount, 1987) was
used as a starting point to design a test scheme for NPE-9
and 1-MN in evaluating the Phase I tests. Figure 3-1 shows
the TIE scheme proposed in this EPA draft protocol. The TIE
scheme used for these target compounds is presented in
Figure 3-2. The ET50 was used for the toxicity tests as
recommended by EPA. Comparison of Figures 3-1 and 3-2 shows
that the (light/dark) Degradation Test was deleted and that
Time-46
Baseline
Toxicity
Tests
Toxic Effluent Sample
Degradation
Test
Ai r Stripping
Test '
Acid Rase Neutral
Filtration Test
Reducing
Agent
Test
Chelation Test
Cig Solid Phase
Extraction TestAcid Base Neutral
Figure 3-1 Initial EPA Draft Procedure for Phase I Effluent Characterization Tests (Anderson-Carnahan &
TARGET COMPOUND SPIKED SOLUTION
DAY 0 B^SEUNB
AERATION
pH3
AERATION
pHl
OOARSERUIR
1.2 um.
AERATION
pHll
1 WEEK
GAC
ADSORRION RNE FILTER
[02 urn.)
Cia SPE
OOLUMN0«,F£]XiaiON
low cone. high cone.
FINE FILTER
0.2 um.
2 WEEKS
3 WEEKS
EDTA
low cone.
EDTA mod .CQDc.
EDTA
high cone
TIME-DEGRADATION
TEST