R E S E A R C H A R T I C L E
Open Access
Characterizing the spatial mismatch
between intimate partner violence
related healthcare services and arrests
in Miami-Dade County, Florida
Jessica Williams
1*, Nick Petersen
2and Justin Stoler
3,4Abstract
Background:Routine screening and intervention for intimate partner violence (IPV) in healthcare settings constitutes an important secondary prevention strategy for identifying individuals experiencing IPV early and connecting them with appropriate services. Considerable variation in available IPV-related healthcare services exists and interventions are needed to improve the quality of these services. One way to prioritize intervention efforts is by examining the level of services provided in communities most at risk relative to local incidence or prevalence of IPV. To inform future interventions, this study examined the spatial relationship between IPV-related healthcare services and IPV arrests in Miami-Dade County, Florida, and identified predictors of the observed spatial mismatch. Methods:Survey data collected in 2014 from 278 health facilities pertaining to IPV services were geocoded, computed into a density layer, and aggregated at the census tract level to create a population-based normalized comprehensiveness score (NCS) as a proxy for IPV-related healthcare resources. IPV arrests from 2011 to 2015, collected from the county court, were geocoded and summarized by census tracts to serve as a proxy for IPV prevalence. These measures were combined into a resource disparity score (RDS) that compared relative service density to relative arrest rates, where positive RDS represented over-resourced neighborhoods and negative RDS corresponded to under-resourced neighborhoods. We used correlation analyses and a two-phase spatial modeling approach to evaluate correlates of NCS and RDS.
Results:A spatial lag model did not yield an association between NCS and IPV arrests, demonstrating a spatial mismatch, which we visualized using a Geographic Information System (GIS). A spatial error model revealed that the percentage of white Hispanic residents was positively associated with RDS, while percent black non-Hispanic, median age, ethnic heterogeneity, and economic disadvantage were negatively associated with RDS. Conclusions:These findings underscore the need to further evaluate the adequacy of IPV-related healthcare resources for secondary prevention relative to local IPV arrest rates, particularly within economically disadvantaged neighborhoods. Our approach demonstrates the utility of GIS for identifying potential priority regions for IPV prevention efforts and resource allocation.
Keywords:Domestic violence, Health services accessibility, Healthcare disparities, Geographic information systems
* Correspondence:[email protected]
1School of Nursing, University of North Carolina at Chapel Hill, 5004
Carrington Hall, Campus Box 7460, Chapel Hill, North Carolina 27599-7460, USA
Full list of author information is available at the end of the article
Background
The relationship between intimate partner violence (IPV) victimization and adverse health outcomes is well established [1–4]. These outcomes not only include acute injury as a result of the violence, but also chronic, long-term physical and mental health consequences. Victims of IPV are more likely to seek health services compared to those with no history of victimization [5,6] and health care seeking is often driven by the availability of resources within a community [7,8]. As such, it is im-portant to understand how resources for addressing IPV within healthcare settings are distributed given that healthcare visits provide an opportune time to identify patients with a history of IPV and intervene.
Over the last decade, there has been an unprecedented increase in support for the integration of routine screening and intervention for IPV into healthcare settings in the United States (U.S.) and around the world. Numerous government and professional organizations have developed recommendation statements and guidelines for routine screening and intervention for IPV [9–12]. These services constitute an important secondary prevention strategy for identifying individuals experiencing IPV early and connecting them with appropriate services to mitigate further adverse consequences.
Recent research demonstrates a general awareness among health providers of their role in identifying and responding to IPV, but with considerable variation in the level of services provided. Through a survey conducted with 288 healthcare facilities in Miami-Dade County (MDC), Florida, Williams and colleagues [13] found that a majority of facilities (78.1%) provided some type of screen-ing and/or intervention for IPV, yet only 35.3% offered comprehensive IPV services following evidence-based recommendations [14].
It is important to continue exploring this variation in available IPV-related healthcare services because the degree of service availability or comprehensiveness can produce variable results on patient outcomes. For example, some IPV prevention resources have been found to be re-lated to an increasein partner homicide, as interventions that insufficiently reduce exposure can lead to retaliation behavior by the aggressor [15]. There is a need for inter-ventions to promote evidence-based IPV screening and re-sponse services within healthcare facilities. In addition, there is a need for methods to target healthcare facilities most in need of these types of interventions. One way to prioritize resources for healthcare facilities is by examining the level of services provided in communities most at risk relative to local incidence or prevalence of IPV.
Geographic Information Systems (GIS) are increasingly being used as a framework for explicitly analyzing the spatial factors associated with IPV rates and experiences [16]. Spatial frameworks have been applied to study drivers
of IPV, such as concentrated poverty [17], neighborhood disorder [18, 19] and access to IPV resources [20, 21]. These studies find higher rates of IPV incidence in low-income and minority neighborhoods as well as those with less access to resources. Unequitable distribution of health care resources can result from numerous factors, in-cluding political drivers (e.g., allocating resources to areas deemed preferable by local leadership) and financial drivers (e.g., designating services to areas based on profit rather that public health need). Prior research has shown that IPV-related healthcare services are geographically concen-trated due to institutional processes such as zoning, and social processes such as residential segregation [21]. As a result, IPV resources are often less concentrated in eco-nomically disadvantaged and minority communities [21].
Despite research showing that minority and low-income communities often havebothhigher rates of IPV [22, 23] and fewer IPV-related resources [21], these topics remain disconnected in the literature. To the best of our know-ledge, no previous studies have evaluated the availability of IPV-related healthcare services relative to IPV arrests as a means for evaluating the extent of spatial concordance between IPV-related need and resources, and what factors are associated with any observed spatial mismatch. This is an important omission in the literature because we do not currently know whether IPV resources are being directed to the communities that need them most, although in-sights from the previous research suggest that there is likely a spatial mismatch. The current study attempts to fill this gap by comparing a measure of IPV-related health-care service comprehensiveness to IPV arrest rates in MDC, Florida, utilizing these variables as proxies for IPV-related healthcare service availability and IPV preva-lence. We evaluate the relationships between these mea-sures by testing three interrelated hypotheses:
1. Census tract-level IPV arrest rates will be associated with local comprehensiveness of IPV-related healthcare services, quantified as anormalized comprehensiveness score(NCS), after controlling for socio-demographic factors;
2. Regardless of the strength or direction of this association, we hypothesize that there will be some spatial mismatch between NCS and IPV arrest rates, with some areas being over- and under-resourced relative to local IPV arrest rates; 3. This spatial mismatch, quantified as aresource
disparity score(RDS), will be associated with indicators of racial/ethnic composition and concentrated disadvantage. More specifically, we hypothesize that whiter and wealthier neighborhoods will be over-resourced, while areas with a larger racial/ethnic minority and economically
This spatial approach will help identify neighborhoods that have higher IPV arrest rates yet are relatively under-resourced with respect to available IPV-related healthcare services. Doing so will also highlight any socio-demographic characteristics associated with high disparities between IPV arrests and healthcare services so that relevant interventions and resources can be better targeted to communities in need.
Methods Study site
MDC is an important research site to investigate the spatial relationship between IPV-related healthcare ser-vices and arrests given its racial, ethnic, and socioeco-nomic diversity. With over 2.7 million residents, MDC is the seventh-largest US county by population [24]. The county’s geographic location in South Florida and its di-verse Hispanic majority population have earned MDC a reputation as the“Gateway of the Americas.” MDC has a legacy of displacing the black non-Hispanic (hereafter referred to as black) population to accommodate urban development projects, while the wealthier white non-Hispanic (hereafter referred to as white) population has tended to settle along coastal and beach areas. The resulting trends yield distinct geographic patterns of residential segregation and economic inequality charac-terized by the“new geography of inequality”[25].
MDC’s demography and stark segregation made it something of an outlier throughout much of the twenti-eth century. However, new research has shown that as American cities diversify, they also tend to become more segregated [26, 27], increasingly resembling the pattern produced by MDC’s waves of immigration and racially-driven politics. MDC’s rich diversity and global economy now position it as a prototypical twenty-first century metropolis [28], and thus a representative model for studying violence in an American city.
Data
This study overlaid data from health-care providers, law enforcement agencies compiled by the courts, and the U.S. Census in a GIS to examine the relationship be-tween IPV-related health services and arrests in MDC. Information on IPV-related policies and practices were obtained from phone surveys of health-care providers [13], while IPV arrest rates come from the MDC Clerk of the Court’s office. These data sources were aggregated to the census tract level and combined with a subset of neighborhood demographic variables from the 2010 cen-sus for analysis. Our analytic sample of 503 cencen-sus tracts excluded tracts with low populations outside of MDC’s urban development boundary, as well as those contain-ing Miami International Airport, Miami-Opa Locka Ex-ecutive Airport, and Miami ExEx-ecutive Airport.
Normalized comprehensiveness score (NCS)
The first dependent variable was a census tract’s mean NCS of IPV-related healthcare services. The NCS measure, de-veloped through previous work by two of the authors (JW and JS), was derived from phone surveys conducted in 2014 of 278 randomly selected primary care (n= 72), ob-stetrics/gynecology (n= 93), pediatric (n= 106), and emer-gency department (n= 17) facilities out of a county-wide sampling frame of 1208 [13]. The NCS represents the geo-graphic density of a screening comprehensiveness index that classified facilities as offering high, medium, low, or no IPV screening comprehensiveness [full methodology is reported elsewhere [13,21]]. A Gaussian kernel density sur-face was generated from the index values at each healthcare facility location in a GIS using a 1 km kernel density and inverse-distance weighting, and then the mean value of all pixels within a census tract was extracted and normalized by population. We thus conceptualized NCS as a proxy measure of IPV-related healthcare service availability.
Resource disparity score (RDS)
Our second dependent variable, developed by the authors specifically for this study, measured the mismatch between IPV-related healthcare services and IPV arrests. We con-ceptualized this mismatch as the resource disparity score (RDS), which we calculated by subtracting theZ-score of a census tract’s IPV arrest rate from the NCSZ-score. Thus, tracts with a positive RDS can be considered relatively over-resourced with respect to IPV-related health service density, while tracts with a negative RDS can be consid-ered relatively under-resourced. Tracts with the lowest RDS are not necessarily those with the worst IPV arrest rates, but rather those with the most extreme disparity be-tween resources and arrests. The tracts of highest priority for anti-violence interventions would, therefore, be those with the highest arrest rates and the lowest RDS.
IPV arrest rates
IPV arrest data, which we obtained from the MDC Clerk of Courts through a public records request, contains every misdemeanor IPV arrest involving adults during the five-year period from January 1, 2011 to December 31, 2015. The MDC Clerk’s Office acts as a centralized data collection point by compiling arrest information from over 30 police departments across the county into a standardized format. IPV arrests were geocoded based on the arrest location and aggregated by census tract as an arrest rate per 1000 residents.
because they constitute the majority of domestic violence cases. For example, Wooldredge and Thistlethwaite [29] found that felonies constitute only 7% of domestic vio-lence cases in Ohio, and thus their analysis focused on misdemeanors. In addition, misdemeanor IPV cases are more systematically coded by the MDC Clerk’s Office. In MDC, misdemeanor IPV cases are sent to a specialized domestic violence court and, thus, are carefully tracked. Felony IPV cases, on the other hand, are prosecuted in the court’s general felony division and classified as assault, homicide, etc., making it difficult to determine which fel-ony cases specifically involve IPV.
Socio-demographic control variables
We controlled for a subset of neighborhood socio-demographic factors using data from the 2010 Census and American Community Survey (2006–2010) that may be related to NCS and RDS. We selected demographic characteristics that have been previously linked to disparities in access to health services [30,31] and IPV prevalence [32,33]. Neighborhood racial/ethnic composition is measured as the percentage of white, black, and Hispanic residents in each census tract. Add-itional races/ethnicities (e.g., Asian, Native Americans, etc.) were too small to power separate analyses, and thus were included in the reference category along with His-panics. Racial and ethnic diversity is captured using the Herfindahl dissimilarity index. The Herfindahl index is computed as 1 minus the sum of squared proportions of each race/ethnicity, such that higher values indicate a higher degree of racial/ethnic diversity. We also included median age to control for the local age structure. To capture variability in the housing and employment mar-kets, we included median gross rent and the percentage of social security benefits recipients. Generally following Sampson et al. [34], we constructed a concentrated dis-advantage index via principal components analysis using the following indicators (eigenvalues in parentheses): percent below poverty line (λ= 0.84), median house value (λ=−0.80), median household income (λ=−0.88), percent single family households (λ= 0.74), and percent receiving public assistance (λ= 0.58). In contrast to Sampson et al. [34], we do not include the percentage of Black residents in this index, instead measuring this vari-able separately. Higher values on the index indicate a greater degree of disadvantage.
Statistical analysis
We began by calculating bivariate Pearson’s correlations and conducting exploratory, aspatial stepwise regression models using the two dependent variables (NCS and RDS) and the set of possible independent variables to assess potential multicollinearity and guide the multivariable spatial modeling process. Bivariate correlation analyses
and stepwise models were performed using SPSS version 24 as an initial step (IBM Corp, Armonk, NY).
We then performed separate spatial regression models on NCS and RDS using data aggregated to 503 Miami-Dade census tracts. First, we built upon a spatial lag model of NCS from prior work, which observed that NCS was associated with ethnicity, age, median gross rent, and the percent of the population receiving Social Security benefits [21], by replicating the original model and then introducing IPV arrest rate. This model helped to establish whether there was a spatial mismatch between IPV arrests and IPV-related healthcare services. Second, we modeled RDS, using the same variable set used to model NCS in addition to new potential predic-tors such as the Herfindahl and concentrated disadvan-tage indices, to identify sociodemographic factors that were associated with any observed spatial mismatch.
Spatial regression analyses were performed in Open-GeoDa version 1.0.1 (University of Chicago, Chicago, IL) using spatial regression models estimated by maximum likelihood that adjust for spatial autocorrelation (i.e., the degree of spatial similarity or dissimilarity of nearby values) [35], with spatial weights constructed using first-order rook-contiguity (i.e., a neighborhood defin-ition characterized by the sharing of some length of border). We relied on Lagrange multiplier diagnostic tests in OpenGeoDa, which indicated whether a spatial lag or spatial error model was more appropriate for modeling NCS and RDS [35, 36]. Lagrange multiplier diagnostic tests indicated that a spatial lag model was a better fit for estimating NCS, and that a spatial error model was a better fit for estimating RDS. The spatial lag model for NCS takes the basic form in Eq.1:
y¼ρWyþΧβþϵ ð1Þ
where W is the spatial weights matrix, ρ measures the degree of spatial autocorrelation (between −1 and 1), and thusρWymeasures the spatial dependence in y. The spatial error model for RDS takes the basic form shown in Eq.2:
y¼λWμþΧβþϵ ð2Þ
be associated with a given outcome measure but helped to reduce multicollinearity. All associations were inter-preted using a significance threshold of α= .05, and spatial data were managed in ArcGIS 10.3 (ESRI, Redlands, CA). The local institutional review board reviewed the study and determined that the data did not constitute human subject research.
Results
Descriptive statistics
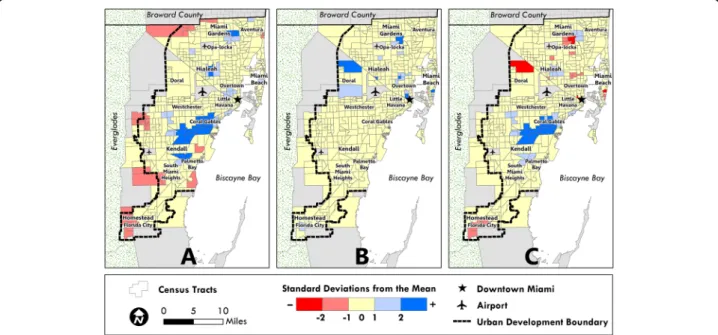
Figure1 displays standard deviation maps that highlight tracts with extreme values (above or below 2 standard deviations) in each panel. IPV-related healthcare services are primarily located in white neighborhoods to the southwest and south (panel A), while IPV arrests are mostly concentrated in black neighborhoods in the northern and central parts of the county (panel B). Given this spatial mismatch along racial lines, it is not surprising that white census tracts are over-resourced in terms of IPV-related healthcare services, while predom-inately black census tracts are typically under-resourced according to RDS (panel C).
Table 1 presents bivariate Pearson’s correlation coeffi-cients for candidate predictors of NCS and RDS. The IPV arrest rate and NCS were not significantly correlated (r=−.002), suggesting that other factors aside from IPV arrests are related to where IPV screening and responses within healthcare facilities occur. To this point, NCS is correlated with several demographic variables included in Models 1–2. NCS is positively correlated with % white and % social security benefits, while NCS is negatively
related to % black and median gross rent. RDS is posi-tively correlated with % white and median gross rent, whereas RDS is negatively related to % black and the concentrated disadvantage index. The variables corre-lated with NCS and RDS provide preliminary informa-tion on factors that may be related to the geographic distribution of IPV-related healthcare services.
Model results
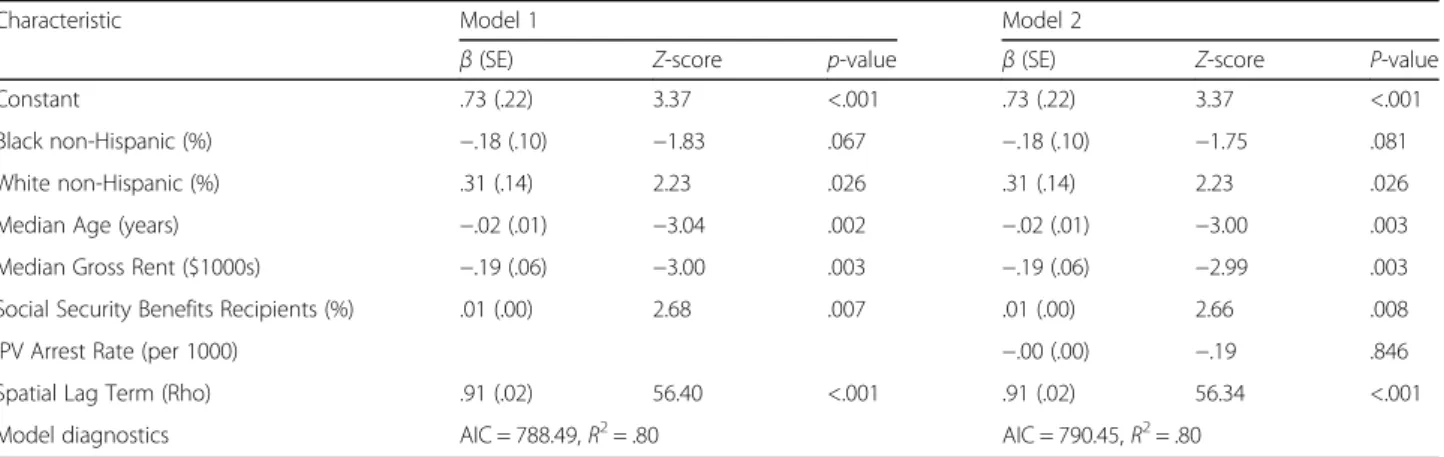
According to Model 1 (Table2), IPV-related health services are concentrated in areas with a larger population of indi-viduals who are white, as compared to Hispanics and Other groups (β= .31, Z= 2.23, p= .026), or on social security benefits (β= .01, Z= 2.68, P= .007). In contrast, IPV re-sources are less concentrated in census tracts with a larger population of residents who are younger (β=−.02, Z=− 3.04,P= .007), low-income (β=−.19, Z=−3.00,P= .003), and to a lesser extent, black, as compared to Hispanics and Other groups (β=−.18, Z=−1.83,P= .067). Model 2 in-cluded all of the covariates from Model 1, but also inin-cluded the IPV arrest rate. None of the significance levels for these relationships changed when the IPV arrest rate was in-cluded in Model 2. The IPV arrest rate was not significantly associated with NCS, thus revealing a spatial mismatch between IPV arrests and resource comprehensiveness.
Model 3 (Table 3) explored these spatial mismatches and identified five key predictors of the RDS. In a spatial error regression model, RDS was positively associated with percent white as compared to percent Hispanic/ Other (β= 1.40,Z= 2.06,P= .039) and negatively associ-ated with percent black as compared to percent
Fig. 1Distribution of Key IPV Indicators across 503 Census Tracts in Miami-Dade County, Florida. Distribution ofamean normalized
Hispanic/Other (β=−.84, Z=−1.98, P= .048), median age (β=−.07, Z=−6.68, p< .001), ethnic heterogeneity (β=−.95, Z=−2.01, P= .045), and concentrated disad-vantage (β=−.35,Z=−3.23, P= .001) after adjusting for the spatial error term. These findings indicated that black and economically disadvantaged areas were more likely to be under-resourced, while white areas were generally over-resourced.
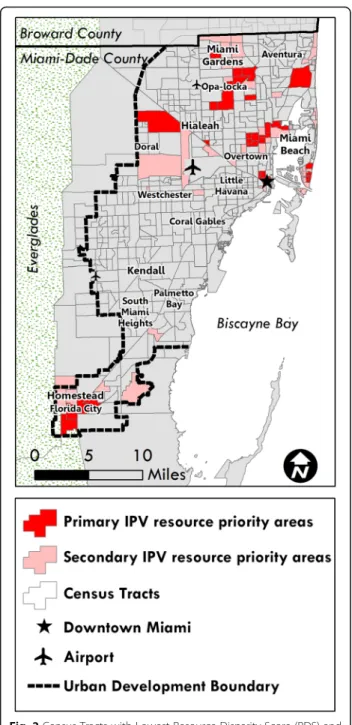
Figure2 displays areas with high rates of IPV that may also be under-resourced. Because tracts with the lowest RDS represent the most extreme disparity between IPV-related health resources and arrests, but not necessar-ily the highest IPV arrest rates, we queried tracts that are in the lowest quartile and decile of RDS as well as the highest quartile and decile of IPV arrest rates. These areas are concentrated in predominately black neighborhoods Table 1IPV arrest rates and census tract characteristics for Miami-Dade County (n= 503), and Pearson’s correlations (r) with the normalized comprehensiveness score (NCS) and resource disparity score (RDS)
Characteristic Tract Mean (SD) Pearson’s Correlation (r) with NCS Pearson’s Correlation (r) with RDS
IPV Arrest Rate (per 1000) 4.55 (9.06) −.002 –
Black non-Hispanic (%) 16.86 (26.20) −.042 −.203**
White non-Hispanic (%) 17.36 (17.23) .108* .155**
Hispanic (%) 63.16 (26.93) −.036 .088*
Median Age (years) 38.78 (5.73) .076 .068
No High School Diploma (%) 21.79 (13.51) −.008 −.215**
Limited English Proficiency (%) 32.88 (18.01) .002 −.148**
Median Gross Rent ($) 1170.97 (370.69) −.123** .097*
Median House Value ($) 298,677.93 (170,667.53) .179** .251**
Per Capita Income ($) 23,581.29 (14,932.11) .089* −.180**
Employed in Service Industry (%) 20.24 (11.03) −.103* −.340**
Renter-Occupied Housing Units (%) 38.46 (20.54) .089* −.135**
Population Below Poverty Line (%) 17.30 (12.39) .013 −.283**
Receives Social Security Benefits (%) 26.67 (11.22) .129** .052
Female-Headed Households (%) 18.81 (8.29) −.087 −.150**
Mobile Home Housing Units (%) 1.89 (8.82) −.088* −.188**
Housing Units with No Automobile (%) 11.39 (11.80) .043 −.187**
Ethnic Heterogeneity Index .36 (.20) .027 −.023
Concentrated Disadvantage Index .06 (.73) −.091* −.257**
*P< .05; **P< .01
IPVintimate partner violence,NCSnormalized comprehensiveness score,RDSresource disparity score
Table 2Spatial lag regression models of the mean normalized comprehensiveness score (NCS) on select sociodemographic characteristics (model 1), and on IPV arrest rate controlling for select sociodemographic characteristics (model 2) for 503 census tracts in Miami-Dade County
Characteristic Model 1 Model 2
β(SE) Z-score p-value β(SE) Z-score P-value
Constant .73 (.22) 3.37 <.001 .73 (.22) 3.37 <.001
Black non-Hispanic (%) −.18 (.10) −1.83 .067 −.18 (.10) −1.75 .081
White non-Hispanic (%) .31 (.14) 2.23 .026 .31 (.14) 2.23 .026
Median Age (years) −.02 (.01) −3.04 .002 −.02 (.01) −3.00 .003
Median Gross Rent ($1000s) −.19 (.06) −3.00 .003 −.19 (.06) −2.99 .003
Social Security Benefits Recipients (%) .01 (.00) 2.68 .007 .01 (.00) 2.66 .008
IPV Arrest Rate (per 1000) −.00 (.00) −.19 .846
Spatial Lag Term (Rho) .91 (.02) 56.40 <.001 .91 (.02) 56.34 <.001
Model diagnostics AIC = 788.49,R2= .80 AIC = 790.45,R2= .80
to the north and south, as well as in white areas in the north near Miami Beach and the Aventura area.
Discussion
Based on prior work [21], we know that IPV-related health services are more concentrated in areas with higher proportions of white residents and those receiv-ing social security benefits and less concentrated in areas with higher proportions of black, younger, and low-income residents. In the current study, we expanded on previous research by examining the role of IPV arrest rates in the availability of IPV-related health services. This study evaluated the degree of spatial mismatch be-tween IPV-related health services and IPV arrest rates in MDC. We find that IPV arrest rates are not associated with the density of IPV-related health services, and fac-tors associated with race and socio-economic class help explain the largest relative disparities between arrest rates and service availability. A GIS enabled us to visualize these disparities and identify communities that should be prioritized for IPV-related resources and inter-ventions. These findings provided further insights about the geographic availability of IPV-related health services in MDC and community-level characteristics related to this availability. Our approach also demonstrates the utility of GIS for identifying potential priority regions for IPV prevention efforts and resource allocation not only for MDC but other regions as well.
Ideally, IPV-related health resources should be driven by the level of need within the local community. The matching of health resources based on community need is a mainstay of public health practice and more recently has been advocated for in clinical practice [37, 38]. Our findings, however, show this is not the case. A statisti-cally significant relationship was not found between NCS and IPV arrest rates, indicating a mismatch be-tween IPV-related healthcare services and local commu-nity needs. Several factors were found to be related to
this mismatch. Specifically, our findings indicated that communities with higher percentage of black residents, younger residents, ethnic heterogeneity and economic disadvantage were more likely to be under-resourced with regards to IPV-related health services, and areas with a higher percentage of white residents tended to be over-resourced.
Table 3Spatial error regression model of the mean resource disparity score (RDS) on select sociodemographic characteristics for 503 census tracts in Miami-Dade County
Characteristic β(SE) Z-score P-value
Constant 3.17 (.51) 6.16 <.001
Black non-Hispanic (%) −.84 (.43) −1.98 .048
White non-Hispanic (%) 1.40 (.68) 2.06 .039
Median Age (years) −.07 (.01) −6.68 <.001
Ethnic Heterogeneity Index −.95 (.47) −2.01 .045
Concentrated Disadvantage Index −.35 (.11) −3.23 .001
Spatial Error Term (Lambda) .67 (.04) 17.15 <.001
Model diagnostics AIC = 1536.87,R2= .46 AICAkaike information criterion. % Hispanic/Other is reference category for race/ethnicity variable
There are several possible explanations for this observed discrepancy in resource allocation and need. First, this may reflect a general lack of awareness among healthcare facilities as to the needs of local communities. The imbal-ance between individual-level clinical services and popula-tion health needs is well established [39, 40]. Increased efforts have been made to promote congruency in this area, such as provisions in the Patient Protection and Affordable Care Act (Pub. L., No. 111–148, 124 Stat. 119) requiring tax exempt hospitals to conduct community health needs assessment and implement strategies to meet identified needs. While several resources have been developed to assist hospitals in meeting this requirement [37,38], our results indicate that more support is needed, especially for non-hospital clinics, which constituted the majority of facilities in this study, and often have limited resources compared with hospitals. In addition, health facilities located in economically disadvantaged neighbor-hoods are also affected by limited resources and compet-ing demands [41, 42], which may prevent them from providing comprehensive IPV-related services. Finally, while responsibility for the delivery of healthcare services often falls on individual healthcare providers and facilities, it is important to acknowledge the complex system in which these services are delivered. The healthcare system is often driven by political and financial processes, which in turn shape and interact with the policies and practices of providers and facilities. Interventions designed to ad-dress these multilevel contributors are likely to be most successful in promoting equitable allocation of health care resources [43–45].
Finally, it is critical to consider racial/ethnic inequalities, particularly among women of color, when interpreting the results of this study. Our findings suggest that, in MDC, the provision of IPV-related healthcare services is not sim-ply a function of need but is also influenced by race and class. These findings are consistent with overwhelming evidence that women of color are often most at-risk for health problems but are least able to access key health ser-vices [46–48], and data which show that black communi-ties have disproportionately higher arrest rates [49], including for IPV [29]. Observed disparities among women of color are often the result of a complex intersec-tion of inequalities and discriminaintersec-tion across multiple levels including race, sex, and class [50,51].
As such, IPV resource disparities are important to address as they can further fuel racial, economic, and health inequalities at the individual and neighborhood levels. Failures to address the socio-health correlates of IPV by healthcare providers may contribute to the cycle of violence in minority neighborhoods that are already disad-vantaged. Prior research indicates that crime, especially violent crime, can lead to further economic inequality at the neighborhood level through the displacement of
residents and businesses [52]. In turn, the destabilization of low-income neighborhoods could actually increase crime in these areas given that concentrated economic disadvantage has been linked to increased IPV rates [23, 53]. In this way, disparities in IPV-related health-care services not only have implications for the well-being of victims, but also for neighborhoods by perpetuating existing inequalities and contributing to high levels of IPV.
This study has important implications for future inter-vention work aimed at improving IPV-related services within healthcare facilities. By identifying disparities in service allocation and factors associated with these dispar-ities, we can better target intervention efforts by prioritiz-ing communities with the greatest need. Specifically, the priority census tracts for intervention would be those with the highest arrest rates and the lowest RDS, as depicted in Fig. 2. While these areas primarily coincide with black neighborhoods, some upper-income areas were identified in Miami Beach and the Aventura area, reminding us that the burden of IPV is not confined to any single demo-graphic group.
healthcare facilities. Future research is needed examining geographic predictors of access to primary and tertiary prevention services for IPV, which have been historically limited [59–61].
Conclusions
Critical health inequities exist in the U.S. based on race/ ethnicity and socioeconomic class, with a widening of this gap often contributed to a lack of appropriate resources targeting those most in need [62]. To combat these dispar-ities, new strategies are needed focused on improving prioritization of resources and better planning of resource allocation [63]. This study describes one such strategy, by identifying spatial mismatches between IPV-related healthcare services and arrests in MDC and demonstrat-ing the utility of GIS for settdemonstrat-ing intervention priorities and allocating resources for IPV prevention efforts. Given the increasing competitiveness in obtaining funds to support IPV prevention work, innovative methods are critical as we continue work towards strengthening the role of the healthcare system in addressing IPV.
Abbreviations
GIS:Geographic Information System; IPV: Intimate partner violence; MDC: Miami-Dade County; NCS: Normalized comprehensiveness score; RDS: Resource disparity score
Funding
This work was supported by an Interdisciplinary Faculty Working Group Seed Grant from the University of Miami Institute for Advanced Study of the Americas, and a University of Miami James W. McLamore Research Award in Business and Social Sciences.
Availability of data and materials
IPV arrest rate data are available through a public record request to the MDC Clerk of the Court’s Office. Neighborhood demographic data are publicly available from the U.S. Census Bureau. The dataset containing information on IPV-related policies and practices is available from the corresponding author on reasonable request.
Authors’contributions
All authors conceptualized the study. JW contributed IPV resource data, supervised all statistical analyses, and drafted the original manuscript. NP contributed arrest data. NP and JS performed all statistical analyses, contributing to the writing process, and edited the final manuscript. JS contributed GIS data and visualization. All authors read and approved the final manuscript.
Ethics approval and consent to participate
The University of Miami Institutional Review Board reviewed the study and determined that the data do not constitute human subjects research. Data used for this study is openly available except for data on IPV-related policies and practices which was obtained through prior research conducted by the first author. The study protocol for the prior research was also reviewed by the University of Miami Institutional Review Board. A similar determination was made that the data do not constitute human subjects research because the data collected on IPV-related policies and practices reflect organizational-level data rather than data from human subjects.
Consent for publication Not applicable.
Competing interests
The authors declare that they have no competing interests.
Publisher’s Note
Springer Nature remains neutral with regard to jurisdictional claims in published maps and institutional affiliations.
Author details
1School of Nursing, University of North Carolina at Chapel Hill, 5004
Carrington Hall, Campus Box 7460, Chapel Hill, North Carolina 27599-7460, USA.2Department of Sociology, University of Miami, 5202 University Drive, Merrick Building, Room 122G, Coral Gables, Florida, USA.3Department of
Geography, University of Miami, 1300 Campo Sano Ave, Coral Gables, FL 33146, USA.4Department of Public Health Sciences, Miller School of
Medicine, University of Miami, 1120 NW 14th St, Miami, FL 33136, USA.
Received: 28 December 2017 Accepted: 22 August 2018
References
1. Loxton D, Dolja-Gore X, Anderson AE, Townsend N. Intimate partner violence adversely impacts health over 16 years and across generations: a longitudinal cohort study. PLoS One. 2017;12(6):e0178138.https://doi.org/10. 1371/journal.pone.0178138.
2. Lagdon S, Armour C, Stringer M. Adult experience of mental health outcomes as a result of intimate partner violence victimisation: a systematic review. Eur J Psychotraumatol. 2014;5https://doi.org/10.3402/ejpt.v5.24794. 3. Bonomi AE, Anderson ML, Rivara FP, Thompson RS. Health outcomes in
women with physical and sexual intimate partner violence exposure. J Women's Health. 2007;16(7):987–97.https://doi.org/10.1089/jwh.2006.0239. 4. Clark CJ, Alonso A, Everson-Rose SA, Spencer RA, Brady SS, Resnick MD, et al. Intimate partner violence in late adolescence and young adulthood and subsequent cardiovascular risk in adulthood. Prev Med. 2016;87:132–7. https://doi.org/10.1016/j.ypmed.2016.02.031.
5. Ford-Gilboe M, Varcoe C, Noh M, Wuest J, Hammerton J, Alhalal E, et al. Patterns and predictors of service use among women who have separated from an abusive partner. J Fam Violence. 2015;30(4):419–31.https://doi.org/ 10.1007/s10896-015-9688-8.
6. Bonomi AE, Anderson ML, Reid RJ, Rivara FP, Carrell D, Thompson RS. Medical and psychosocial diagnoses in women with a history of intimate partner violence. Arch Intern Med. 2009;169(18):1692–7.https://doi.org/10. 1001/archinternmed.2009.292.
7. Douthit N, Kiv S, Dwolatzky T, Biswas S. Exposing some important barriers to health care access in the rural USA. Public Health. 2015;129(6):611–20. Epub 2015/05/31.https://doi.org/10.1016/j.puhe.2015.04.001.
8. Hadley J. Insurance coverage, medical care use, and short-term health changes following an unintentional injury or the onset of a chronic condition. JAMA. 2007;297(10):1073–84. Epub 2007/03/16.https://doi.org/10. 1001/jama.297.10.1073.
9. Institute of Medicine. Clinical preventive services for women: closing the gap. Washington, DC: Institute of Medicine; 2011.
10. Moyer VA, U. S. Preventive services task force. Screening for intimate partner violence and abuse of elderly and vulnerable adults: U.S. preventive services task force recommendation statement. Ann Intern Med. 2013;158(6):478–86. https://doi.org/10.7326/0003-4819-158-6-201303190-00588.
11. National Institute for Health and Care Excellence. Domestic violence and abuse, NICE quality standard [QS116]. 2016 [12/12/2017]. Available from: https://www.nice.org.uk/guidance/qs116.
12. Fanslow JL, Kelly P, Ministry of Health. Family violence assessment and intervention guideline: child abuse and intimate partner violence. 2nd ed. Ministry of Health: Wellington, New Zealand; 2016.
13. Williams JR, Halstead V, Salani D, Koermer N. Intimate partner violence screening and response: policies and procedures across health care facilities. Womens Health Issues. 2016;26(4):377–83.https://doi.org/10.1016/j.whi.2016.03.006. 14. O'Campo P, Kirst M, Tsamis C, Chambers C, Ahmad F. Implementing
successful intimate partner violence screening programs in health care settings: evidence generated from a realist-informed systematic review. Soc Sci Med. 2011;72(6):855–66.https://doi.org/10.1016/j.socscimed.2010.12.019. 15. Dugan L, Nagin DS, Rosenfeld R. Exposure reduction or retaliation? The
effects of domestic violence resources on intimate-partner homicide. Law Soc Rev. 2003;37(1):169–98.
systems (GIS). Journal of Aggression, Conflict and Peace Research. 2016;8(3): 197–211.
17. Miles-Doan R, Kelly S. Geographic concentration of violence between intimate partners. Public Health Rep. 1997;112(2):135.
18. Gracia E, López-Quílez A, Marco M, Lladosa S, Lila M. The spatial
epidemiology of intimate partner violence: do neighborhoods matter? Am J Epidemiol. 2015;182(1):58–66.
19. Gracia Fuster E, López i Quílez A, Marco M, Lladosa S, Lila M. Exploring neighborhood influences on small-area variations in intimate partner violence risk: a Bayesian random-effects modeling approach. Int J Env Res Pub He. 2014;11:866–82.
20. Peek-Asa C, Wallis A, Harland K, Beyer K, Dickey P, Saftlas A. Rural disparity in domestic violence prevalence and access to resources. J Women's Health. 2011;20(11):1743–9.
21. Stoler J, Verity J, Williams JR. Geodemographic Disparities in Availability of Comprehensive Intimate Partner Violence Screening Services in Miami-Dade County. J Interpers Violence. 2017; Advanced online Publication:1–17. 22. Lipsky S, Cristofalo M, Reed S, Caetano R, Roy-Byrne P. Racial and ethnic
disparities in police-reported intimate partner violence perpetration: a mixed methods approach. J Interpers Violence. 2012;27(11):2144–62.https:// doi.org/10.1177/0886260511432152.
23. Pearlman DN, Zierler S, Gjelsvik A, Verhoek-Oftedahl W. Neighborhood environment, racial position, and risk of police-reported domestic violence: a contextual analysis. Public Health Rep. 2003;118(1):44–58.https://doi.org/ 10.1093/phr/118.1.44.
24. U.S. Census Bureau. Population Division. Annual Estimates of the Resident Population: April 1, 2010 to July 1, 2016. 2017.
25. Kohn-Wood LP, Samson F, Braddock J. Race, social identity, and generative spaces: Miami as a microcosm of categorical complexity in a 21st-century global city. Am Behav Sci. 2015;59(3):386–405.
26. Wright R, Ellis M, Holloway SR, Wong S. Patterns of racial diversity and segregation in the United States: 1990–2010. Prof Geogr. 2014;66(2):173–82. https://doi.org/10.1080/00330124.2012.735924.
27. Ellis M, Wright R, Holloway S, Fiorio L. Remaking white residential segregation: metropolitan diversity and neighborhood change in the United States. Urban Geogr. 2018;39(4):519–45.https://doi.org/10.1080/ 02723638.2017.1360039.
28. Portes A, Armony AC, Lagae B. The global edge : Miami in the twenty-first century. Oakland, California: University of California Press; 2018. pages cm p 29. Wooldredge J, Thistlethwaite A. Bilevel disparities in court dispositions for
intimate assault. Criminology. 2004;42(2):417–56.
30. Bissonnette L, Wilson K, Bell S, Shah TI. Neighbourhoods and potential access to health care: the role of spatial and aspatial factors. Health Place. 2012;18(4):841–53.https://doi.org/10.1016/j.healthplace.2012.03.007. 31. Fiscella K, Franks P, Gold MR, Clancy CM. Inequality in quality: addressing
socioeconomic, racial, and ethnic disparities in health care. JAMA. 2000; 283(19):2579–84.
32. Cunradi CB, Caetano R, Schafer J. Socioeconomic predictors of intimate partner violence among white, black, and Hispanic couples in the United States. J Fam Violence. 2002;17(4):377–89.
33. Rennison C, Planty M. Nonlethal intimate partner violence: examining race, gender, and income patterns. Violence Vict. 2003;18(4):433–43.
34. Sampson RJ, Raudenbush SW, Earls F. Neighborhoods and violent crime: a multilevel study of collective efficacy. Science. 1997;277(5328):918–24. 35. Anselin L, Syabri I, Kho Y. GeoDa : an introduction to spatial data analysis.
Geogr Anal. 2006;38(1):5–22.https://doi.org/10.1111/j.0016-7363.2005.00671.x. 36. Anselin L. Lagrange multiplier test diagnostics for spatial dependence and spatial heterogeneity. Geogr Anal. 1988;20(1):1–17.https://doi.org/10.1111/j. 1538-4632.1988.tb00159.x.
37. Pennel CL, McLeroy KR, Burdine JN, Matarrita-Cascante D. Nonprofit hospitals’approach to community health needs assessment. Am J Public Health. 2015;105(3):e103–13.https://doi.org/10.2105/AJPH.2014.302286. 38. Barnett K. Best practices for community health needs assessment and
implementation strategy development: a review of scientific methods, current practices and future potential. Oakland, CA: The Public Health Institute; 2012.
39. Eggleston EM, Finkelstein JA. Finding the role of health care in population health. JAMA. 2014;311(8):797–8.https://doi.org/10.1001/jama.2014.163. 40. Sox HC. Resolving the tension between population health and individual
health care. JAMA. 2013;310(18):1933–4.https://doi.org/10.1001/jama.2013. 281998.
41. Schoen C, Radley D, Riley P, Lippa J, Berenson J, Dermody C, et al. Findings from the Scorecard on State Health System Performance for low-income populations, 2013 New York, NY: 2013.
42. Institute of Medicine Committee on Assuring the Health of the Public in the 21st Century. The future of the Public's health in the 21st century. Washington, DC: National Academies Press; 2002.
43. Lukas CV, Holmes SK, Cohen AB, Restuccia J, Cramer IE, Shwartz M, et al. Transformational change in health care systems: an organizational model. Health Care Manag Rev. 2007;32(4):309–20. Epub 2007/12/14.https://doi. org/10.1097/01.HMR.0000296785.29718.5d.
44. Charns MP, Foster MK, Alligood EC, Benzer JK, Burgess JF Jr, Li D, et al. Multilevel interventions: measurement and measures. J Natl Cancer Inst Monogr. 2012;2012(44):67–77. Epub 2012/05/25.https://doi.org/10.1093/ jncimonographs/lgs011.
45. McLeroy KR, Bibeau D, Steckler A, Glanz K. An ecological perspective on health promotion programs. Health Educ Q. 1988;15(4):351–77.https://doi. org/10.1177/109019818801500401.
46. James CV, Salganicoff A, Thomas M, Ranji U, Lillie-Blanton M, Wyn R. Putting women's health care disparities on the map: examining racial and ethnic disparities at the state level. Menlo Park: the Henry J. Kaiser Family Foundation; 2009.
47. Agency for Healthcare Research and Quality. Disparities in health care quality among minority women: Findings from the 2011 National Healthcare Quality and disparities reports. (AHRQ Publication No. 12-0006-3-EF). Rockville, MD: Agency for Healthcare Research and Quality; 2012. 48. Women of Color Health Data Book. 4th ed ed. Bethesda, MD: Office of Research
on Women's Health, Office of the Director, National Institutes of Health. 49. Gelman A, Fagan J, Kiss A. An analysis of the New York City police
department's“stop-and-frisk”policy in the context of claims of racial bias. J Am Stat Assoc. 2007;102(479):813–23.
50. Crenshaw K. Demarginalizing the intersection of race and sex: black feminist critique of antidiscrimination doctrine, feminist theory and antiracist politics. University of Chicago Legal Fourm. 1989;139:139–68.
51. Kelly UA. Integrating intersectionality and biomedicine in health disparities research. ANS Adv Nurs Sci. 2009;32(2):E42–56. Epub 2009/05/23.https://doi. org/10.1097/ANS.0b013e3181a3b3fc.
52. Clear TR. The effects of high imprisonment rates on communities. Crime Justice. 2008;37(1):97–132.https://doi.org/10.1086/522360.
53. Beyer K, Wallis AB, Hamberger LK. Neighborhood environment and intimate partner violence: a systematic review. Trauma Violence Abuse. 2015;16(1): 16–47.https://doi.org/10.1177/1524838013515758.
54. Masho SW, Schoeny ME, Webster D, Sigel E. Outcomes, data, and indicators of violence at the community level. J Prim Prev. 2016;37(2):121–39.https:// doi.org/10.1007/s10935-016-0429-4.
55. Allard SW, Tolman RM, Rosen D. Proximity to service providers and service utilization among welfare recipients: the interaction of place and race. J Policy Anal Manag. 2003;22(4):599–613.https://doi.org/10.1002/pam.10157. 56. McLafferty SL. GIS and health care. Ann Rev Publ Health. 2003;24(1):25–42.
https://doi.org/10.1146/annurev.publhealth.24.012902.141012.
57. Deri C. Social networks and health service utilization. J Health Econ. 2005; 24(6):1076–107.https://doi.org/10.1016/j.jhealeco.2005.03.008.
58. Rodríguez M, Valentine JM, Son JB, Muhammad M. Intimate partner violence and barriers to mental health Care for Ethnically Diverse Populations of women. Trauma Violence Abus. 2009;10(4):358–74.https:// doi.org/10.1177/1524838009339756.
59. Chamberlain L. A prevention primer for domestic violence: terminology, tools, and the public health approach. Harrisburg, PA: VAWnet, a project of the National Resource Center on Domestic Violence/Pennsylvania Coalition Against Domestic VIolence; 2008.
60. Whitaker DJ, Morrison S, Lindquist C, Hawkins SR, O'Neil JA, Nesius AM, et al. A critical review of interventions for the primary prevention of perpetration of partner violence. Aggression and Violent Behavior. 2006;11(2):151–66. https://doi.org/10.1016/j.avb.2005.07.007.
61. Niolon PH, Kearns M, Dills J, Rambo K, Irving S, Armstead T, et al. Preventing intimate partner violence across the lifespan: a technical package of programs, policies, and practices. National Center for Injury Prevention and Control, Centers for Disease Control and Prevention: Atlanta, GA; 2017. 62. Schroeder SA. American health improvement depends upon addressing class
disparities. Prev Med. 2016;92:6–15.https://doi.org/10.1016/j.ypmed.2016.02.024. 63. Corburn J. City planning as preventive medicine. Prev Med. 2015;77:48–51.