1
Absolute and Relative Risk of Aggressive Prostate Cancer in Men with a Positive Family History; A systematic-review
By
Ian Allen
A Master’s Paper submitted to the faculty of the University of North Carolina at Chapel Hill
in partial fulfillment of the requirements for the degree of Master of Public Health in
the Public Health Leadership Program
Chapel Hill
2012
[Signature]
Advisor
Date
[Signature]
Second Reader
2
Abstract
Background: In May 2012, the United States Preventive Services Task Force recommended against PSA-based
screening in men of all ages, regardless of race or family history. However, though risk of harms outweighs
potential benefits in men in the general population, men at higher risk of dying from prostate cancer may have a
larger mortality benefit. Although previous reviews have demonstrated that family history of prostate cancer in a
first-degree relative is a risk factor for overall prostate cancer, this may not correspond to a higher risk of death. In
this review we assess family history as a risk factor for aggressive prostate cancer to determine if men with family
history have a potentially larger mortality benefit than average risk men.
Purpose: To determine the relative and absolute risk of aggressive prostate cancer in men with at least one affected
first-degree relative
Data Sources: MEDLINE and Embase (search dates 1992 to June 2012), recent systematic reviews, reference lists
of retrieved articles and suggestions from experts.
Study Selection: English-language, randomized, controlled trials, cohort studies, case-control studies and
cross-sectional studies meeting eligibility criteria
Data Extraction: All studies were reviewed, abstracted and rated for quality using the STROBE criteria and
supplemented with guidelines provided by Deets et al.
Data Synthesis: Three fair quality cohort studies, one fair quality and six poor quality case-control studies and one
fair quality cross-sectional study demonstrated mixed results of difference of risk magnitude for aggressive prostate
cancer in men with family history of prostate cancer in a first-degree relative compared to men without family
history. In cohort studies reporting increased relative risk, we calculated absolute risk and attributable risk to be
small.
Limitations: There is limited evidence from good quality studies addressing aggressive prostate cancer risk in men
with family history. Use of surrogates, inability to assess harms and variations among study populations by region,
age, co-variates and prior screening rates limits generalizability.
Conclusion: Evidence is insufficient to suggest an increase in relative or absolute risk of aggressive prostate cancer
in men with an affected relative compared to men in the general population without determining family history in
3
“Now, I probably won't be entering a discussion about prostate cancer screening unless my patient has a family history of prostate cancer or he expresses concern,” said general internist Christine Laine, MD, MPH, editor in chief of Annals of InternalMedicine.1
Focused question
What is the relative and absolute risk of aggressive prostate cancer in men aged 40-70 years who have a family history of prostate cancer in at least one first-degree relative compared to men without such family history?
Introduction
Statement of Purpose
On March 22, 2012, the United States Preventive Services Task Force (USPSTF) recommended against prostate specific antigen (PSA)-based screening for prostate cancer in all men, regardless of age, race or family history.2 These recommendations were, in a large part, based on results from two large randomized trials which showed only a small3, 4 or no mortality benefit5, 6 from PSA-based screening. Risk of harms outweighs potential benefit in average risk men, “high-risk” men (men with a family history and African American men), may have larger mortality benefit. Although randomized trials are needed to evaluate PSA-based screening in “high-risk” groups, determining the magnitude of risk for men with family history compared to men in the general population is a
prerequisite. Previous reviews have documented family history as a risk factor for overall
prostate cancer;7-9 however, it is important to distinguish aggressive – clinically
significant – from indolent – clinically insignificant – prostate cancer. We will use the
4
purpose of this review is to examine and accurately report10 the level of evidence on risk
of aggressive prostate cancer in men with a family history compared to those without.
Background
Prostate Cancer in the “PSA-era”
The incidence rates of prostate cancer in the United States increased dramatically as PSA-based screening became clinically accepted, peaking at nearly 250 cases per 100,000 in the early 1990’s.11 However, despite its widespread use, the role of the PSA in screening for prostate cancer has become and will likely continue to be controversial. In 2009, the publication of two large, randomized controlled trials, the European
Randomized Study of Screening for Prostate Cancer (ERSPC) and the United States Prostate, Lung, Colorectal and Ovarian (US PLCO) studies showed small3 and no5 survival benefit, respectively. These trials continued to yield conflicting results with continued patient follow-up.4, 6 In May 2012, the United States Preventive Services Task Force recommended against PSA-based screening with the finding that the risk of harms outweighed the benefits.2, 12 Based on data from the ERSPC, an estimated 1055 men need to be screened to prevent 1 death from prostate cancer.3 However, the number needed to screen may be smaller for “high-risk” men, such as those with a positive family history.
Scope of Review
In this review, we examined the evidence on risk of aggressive – clinically
5
these men, a review of the evidence specifically regarding aggressive disease is imperative for health care providers in promoting informed discussions with patients regarding
derivation of benefit or avoidance of harm of screening and treatment. Furthermore, we also hope that by characterizing the risk magnitude in these men, we may gain insight into the potential benefit of screening in this group and determine if it is greater than for men in the general population.
Recommendations of Other Associations
The American Urological Association (AUA), American Association of Clinical Urology and other individual experts in the field have been critical of the new guidelines, citing concerns about study quality and emphasizing the need for more complete
understanding of the clinical contexts and consequences.13-17 With regards to men with positive family history, both the AUA and American Cancer Society (ACS) recommend offering screening to men at age 40 and prior to age 50, respectively.18, 19 The American Academy of Family Physicians (AAFP) and the United States Preventive Services Task Force recommend against screening for men of all ages, regardless of race or family history.2, 20 The disagreement among medical professional societies will contribute to the challenge patients and their providers face in the context of a shifting preventive care paradigm.
Epidemiology
6
being diagnosed with prostate cancer and a 3% chance of dying from the disease.23 In 2011, an estimated 240,890 men were diagnosed with prostate cancer and 33,720 men died from the disease.23 Although these estimates do not distinguish aggressive from
overall disease, both prostate cancer diagnosis and mortality clearly represent a
considerable burden for the United States population. The epidemiology of aggressive
prostate cancer is unclear. The prevalence of overall prostate cancer in men with an affected relative is estimated at 2- to 4- fold greater than the general population.24 The prevalence of aggressive prostate cancer in men with a family history is the subject of our review.
Prostate Cancer Risk Factors
There are several risk factors for overall prostate cancer that are supported by a strong body of evidence, while for others the evidence is less robust. We discuss all known risk factors for prostate cancer below as the implications of cumulative risk may be important clinically. Note that we will discuss risk of aggressive disease when known, however for many factors the association is unclear.
Age
Age has a stronger relationship with prostate cancer than perhaps any other
7
aged 41-50, 46% aged 51-60, 70% aged 61-70, and 83% aged 71-80 have histological evidence of malignancy with no clinical evidence of disease.26
Ethnicity
Ethnicity is also considered to increase risk of prostate cancer. African American men are 1.6 times as likely to develop the disease than Caucasian, Hispanic and Asian men (incidence rates of approximately 226 and 145 cases per 100,000 person-years for African American men and Caucasian men, respectively) and are 2.3 times more likely to die from prostate cancer.22 Additionally, African Americans are more likely to be
diagnosed with more aggressive disease at an earlier age compared to Caucasian men.27, 28 However, the role of disparity in healthcare access and trust of healthcare professionals may confound the differences in incidence and mortality.29 African American men may also be more likely to be diagnosed due to –on average – higher measured PSA levels compared to Caucasian men and when stratified by age, access, stage at diagnosis, some studies show ethnicity may not independently have implications for outcomes.30
Family History
Family history of prostate cancer in a first or second degree relative is considered to increase risk of overall prostate cancer. The association with aggressive prostate cancer is unclear and thus the reason for this review. With regard to risk of overall prostate cancer, estimates of relative risk compared to men without family history vary as widely as 1.4 to 17.8 in first-degree relatives.9 We will address family history as a risk factor for
overall prostate cancer below in our discussion of previous systematic reviews and
8
Other Factors
Androgens have also been shown to increase risk for overall prostate cancer. Use of 5-alpha-reductase inhibitor, finasteride, was shown to decrease risk of cancer in the Prostate Cancer Prevention Trial (PCPT).31 Many other factors have been reported in the literature to increase prostate cancer risk. These risk factors include animal fat, vegetable matter, soy, alcohol, coffee, obesity, insulin and insulin-like growth factor, physical activity, vasectomy, ejaculatory frequency, ultraviolet light exposure, diagnostic
radiologic procedure, external beam radiotherapy, prostatitis with Trichomonas, XMRV virus, exposures such as Agent Orange, Chlordecone, medications such as NSAIDs and statins, and vitamins and minerals including vitamin E, folic acid, selenium, zinc, calcium and vitamin D.32 The quality and clinical contribution of these studies investigating these associations is beyond the scope of this review.
Genetics of Prostate Cancer
Numerous studies report risk of prostate cancer is strongly affected by family history, particularly early onset disease. Several studies, including family studies and genome-wide association studies have suggested that prostate cancer has a strong genetic component, an estimated 5-10% of prostate cancer cases are believed to be due to “high-risk” genetic factors and/or susceptibility genes.33
9
considered to be passed on by autosomal dominance transmission and represents as many as 43% of prostate cancers diagnosed before age 55, but only 9% of prostate cancers in men overall.35
In a recent review of 8 prostate cancer large linkage studies that evaluated 4,600 cases of prostate cancer from 1,293 kindreds, a lack of consistency was found among genetic models; Easton et al. concluded that prostate cancer is genetically complex and would require large family sets to draw reliable linkages.36 Another review found that several genomic regions are linked to high-grade tumors, but the prevalence and
interaction with diet and environment are unknown.37 However, certain predispositions for overall prostate cancer have recently been evaluated with consistent findings. Cohort studies show HOXB13, BRCA1 and BRCA2 mutations place individuals at higher risk.38,
39
A population-based study of prostate cancer cohort in Seattle reported 22 single nucleotide polymorphisms (SNPs) found to be significantly associated with prostate cancer-specific mortality, but these results await validation and replicaton.40
In summary, although the genetics of prostate cancer is a rapidly developing field, much remains unknown. While BRCA mutations may have implications for overall prostate cancer, few studies consistently show specific genotypic predispositions for aggressive disease. Furthermore, if genetic contexts that predispose to aggressive prostate cancers can be validated, the prevalence in the general population is unclear. Finally, the benefit of PSA-based screening in these populations, if they exist and are reliably
10
Since the PSA-based screening became widespread, many prostate cancers are detected asymptomatically. Other modes of detection include digital rectal
examination(DRE) or with symptoms. On DRE, prostate cancers are asymmetric areas of induration or nodules detected by manual examination. Symptoms suggestive of prostate cancer include new onset urinary urgency, nocturia, frequency, hesitancy, or new onset erectile dysfunction. Bone pain may be a presenting symptom in a small percentage of men with metastatic disease. Any of the above presentations warrants a prostate biopsy. Prostatic biopsy varies with regard to procedure; anatomic approaches include transrectal, transperineal and transurethral resection. Though it has many risks, prostate biopsy is considered to be a minimally invasive procedure performed in the office setting. Prophylactic antibiotics are recommended prior to biopsy to lower incidence of post-biopsy bacteruira.41 Local anesthesia can be given to reduce patient discomfort. Most often in current practice, an extended core (5-7 specimens from each side of the gland or occasionally up to 18 cores) or saturation biopsy (up to 24 core samples) are performed to observe neoplastic cells within the gland.
PSA Test Characteristics
11
undergoing 4 PSA tests and a 5.5% risk of having at least 1 biopsy due to a
false-positive.2, 6 Although increasing and decreasing PSA cut-offs would improve specificity and sensitivity, respectively, there is no PSA level at which a man can know for certain he is without a life-threatening prostate cancer.43
Efforts to improve the ability of the test to detect early disease have included use of PSA velocity, density and free-to-total PSA ratios.44-46 Use of PSA velocity, while predictive of prostate cancer, does not appear to improve detection of high-grade disease and tends to increase biopsy rates.47 PSA density may improve sensitivity and decrease unnecessary biopsies, but is limited in clinical applicability as it requires prostatic volume measurement with ultrasound or MRI.45 Similarly, free PSA is only considered clinically useful at extreme values and is not standard practice.46 Recently, urinary biomarkers including PCA3, alpha-methylacyl-CoA racemase, the TMPRSS2-ERG fusion gene and microseminoprotein-beta have been proposed for early detection of prostate cancer,48 however to our knowledge these tools await validation and have not yet been evaluated in randomized trials.
Outcomes of Screen-detected and Overall Prostate Cancer
The USPSTF recommendation statement described three categories of men with screen-detected prostate cancers: those who will die despite early detection and
12
and advances in treatment. Additionally, it may be that particularly aggressive tumors are largely undifferentiated and therefore do not produce PSA. An estimated 25% of men with PSA below 4 have Gleason scores of 7 or more, 12.5% of men have high-grade disease with PSA of 0.5 ng/mL or less.49 However, these estimates may not be applicable for men at higher risk for overall or aggressive prostate cancer.
TNM Stage and Gleason Score
Prostate cancer is staged with the TNM system. Of some importance to our review, the TNM system underwent changes in 2002 and 2010. The most recent change incorporated Gleason score as the standardized histopathology grading system (previous systems did not specify the system to be used for grading histopathology). The Gleason score has also experienced an “upward migration” over the study period, as the percentage of higher grade Gleason has increased over time which is known as the Will Rogers phenomenon.50
Defining Aggressive Disease
13
The TNM Stage refers to tumor size, nodal status and presence of distant
metastases. While a T1b tumor has a 5-year survival of 85%, tumors greater than T2 have 5-year survivals of less than 66%.52 The Gleason score reflects the degree of
histopathology and predicts the likelihood of organ confined disease with implications for survival. A tumor’s overall Gleason score is a composite of the two most predominant growth and differentiation grades – where grade 1 is the most and grade 5 is the least differentiated – present within a tissue sample.53 While a Gleason score of less than 7 correlates with a 10-year survival rate of 98.4%, a Gleason score of 8 or greater
corresponds to a 10-year survival rate of less than seventy-percent.51, 54 Similarly, PSA levels at the time of diagnosis correlate with the aggressiveness of disease and mortality. For a PSA of 10 or less, the 5-year survival is approximately 81% compared to 51 and 31% at PSA values 20-30 and greater than 30 ng/mL, respectfully.52
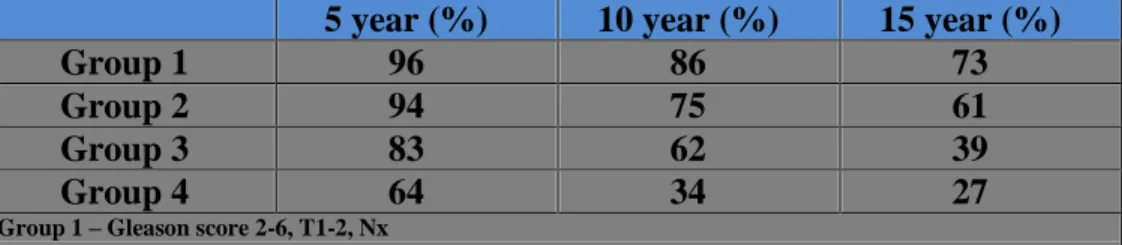
The 2010 TNM Anatomic Stage/Prognostic Groups are provided in Table 1. As shown in the table, TNM Stage and Gleason score both have “thresholds” at which
Anatomic Stage and thus prognosis, change significantly. For the purposes of our review, we required an aggressive cancer to have at least 1 of these “advanced” characteristics. Based on TNM 2010 Anatomic Stage, aggressive disease had at least one of the following tumor characteristics: TNM Stage T3a or greater, Gleason Score of 7 or greater, or
pretreatment PSA of 20 ng/mL or more.55-57
Table 1. RTOG prognostic model for disease-specific survival in early stage prostate cancer58
5 year (%) 10 year (%) 15 year (%)
Group 1 96 86 73
Group 2 94 75 61
Group 3 83 62 39
Group 4 64 34 27
Group 1 – Gleason score 2-6, T1-2, Nx
14
Group 3 – Gleason score 7, T3Nx, or Gleason score 7, N+; or Gleason score 8-10, t1-2 Nx Group 4 – Gleason score 8-10, T3Nx; or Gleason score 8-10, N+
Burden of Suffering
Population-based studies estimate the prevalence of family history of prostate cancer to be approximately 5-7%.59, 60 Men with a positive family history have increased risk perception compared to men without a family history which can lead to depression and worry that affects daily life.61 Population-based studies show that while 60% of men with first-degree relatives worry little or not at all about prostate cancer, the remaining 40% worry to an extreme degree.62 A review on PSA-based screening “uptake” in men with family history of prostate cancer reported 50-95% of men received PSA-based screening with variations by socioeconomic status and race.63
Harms of PSA-based Screening in Average Risk Men
Prostate biopsy is usually uncomplicated and well-tolerated, but harms must be considered. Harms of prostatic biopsy include anxiety, infection, pain, bleeding, urinary obstruction and tumor seeding, although this is unusual. Risk of infection is lowered with single dose of prophylactic antibiotic therapy, but has contributed to overuse of
fluoroquinolone antibiotics.41 Men on anticoagulant therapy are recommended to
temporarily stop the medication prior to biopsy. Most bleeding is self-limited and requires no intervention. Hematuria and/or hematospermia occur in as many as 50% of men and in 23%, it lasts more than 3 days.64 Retrospective studies show up to 3.5% of men develop post-biopsy fever, but less than 1% required hospitalization.64 Most men with screen-detected cancers will elect to have treatment.65 Harms associated with treatment depend on the modalities employed. Up to 0.5% of men will die within 30 days of radical
15
complications and 20-30% of men will experience erectile dysfunction, urinary
incontinence or both after 10 years; radiation therapy can also increase risk of erectile, bowel and bladder dysfuntion.66
Potential Harms in Men with Family History
If family history is associated with aggressive disease, it could be the harms of screening become outweighed by the benefits of early detection and intervention. However, if a review of the literature reveals no or little increase in risk of aggressive prostate cancer, men with a family history could represent a subgroup at high risk for harms of screening, diagnosis and treatment.
Previous Systematic Reviews and Meta-Analyses
As mentioned above previous reviews have identified risk of overall prostate cancer in men with a family history. In 2003, Johns and Houlston identified 13 case-control and cohort studies assessing risk for categories of family history (father, son); meta-analysis showed pooled relative risk of 2.5 (confidence interval 2.2 to 2.8) of overall prostate cancer in first-degree relatives.67 Also in 2003, Zeegers et al. published a meta-analysis on 33 studies and found a “recurrence risk ratio” of 2.53 (2.24-2.85) of overall
16
One concern with previous reviews is the risk of selection bias. Logically, men with a positive family history are more likely to be aware of the disease and therefore more likely to be screened. Because indolent prostate cancer is present in such a large percentage of the population and PSA is an inaccurate test, this group of men may, therefore, be more likely to be overdiagnosed with a prostate cancer that may have never caused symptoms during their lifetime. In this review we limit our report to risk of
aggressive, clinically significant disease in men with a family history of prostate cancer in
at least one first-degree relative.
Summary
Age, race and family history are considered to be the three most valuable risk factors for prostate cancer. PSA-based screening is the central modality for early detection and intervention of prostate cancer. In May 2012, the USPSTF found that the risk of harms outweighed potential benefits of PSA-based screening for average risk men, however this may not be true for “high-risk” groups. The potential for a mortality benefit in high risk groups depends in part on family history as a risk factor for aggressive
disease. The purpose of this report is to review the literature and examine risk of
aggressive disease in men with a family history of prostate cancer in a first-degree relative
compared to men in general population. Key Question:
This review aims to address the following questions:
17
2. If there is an increased relative risk, what is the absolute risk of aggressive prostate cancer in men with a positive family history?
Methods:
Literature Search
We developed a search strategy to address our question with the assistance of a research librarian. We conducted a systematic search of MEDLINE and Embase. Both MEDLINE and Embase were accessible through the University of North Carolina at Chapel Hill’s Health Science Library. See Appendix for detailed description of search strategy.
Study Eligibility:
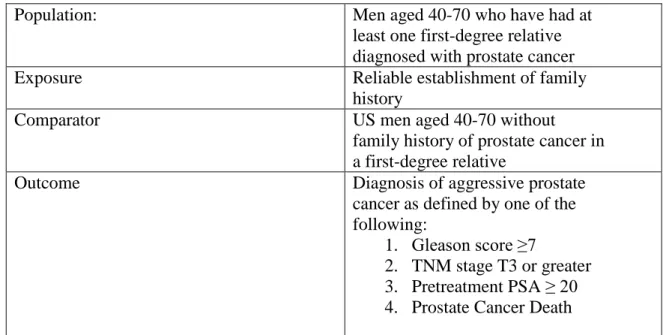
To be included in the review, studies must have identified the study population, intervention, comparator group, outcomes, time allotted for outcome development and be within the time range specified for published literature and have described the study design. Figure 1 presents the eligibility criteria with the PECOTTS framework.
Figure 1: Focused Question in PECOTTS framework
Population: Men aged 40-70 who have had at
least one first-degree relative diagnosed with prostate cancer
Exposure Reliable establishment of family
history
Comparator US men aged 40-70 without
family history of prostate cancer in a first-degree relative
Outcome Diagnosis of aggressive prostate
cancer as defined by one of the following:
1. Gleason score ≥7
18 Time allotted for outcome 40 years Time period for literature search 1992 - 2012
Study Designs Reviewed Randomized, cohort, case-control studies, cross-sectional
Inclusion and Exclusion Criteria
Studies were assessed with inclusion and exclusion criteria described in the PECOTTS framework, described briefly in Figure 1. The following is a detailed description of the inclusion and exclusion criteria using the PECOTTS framework. Population
We defined for population a priori as all men aged 40 to 70 living in the United States. These ages were chosen because guidelines and best practice policies from nationally recognized organizations including the AUA, ACS and USPSTF have
19 Disclosure of Changes – Population
As we conducted our search, two minor changes were discussed and agreed upon for the population criteria. Although we had hoped to include only men aged 40-70 years, we observed several studies which would have been included if not for the age distribution of the study population. We felt that it would be unreasonable to exclude a study if the age range did not align itself exactly with our predetermined criteria. Furthermore, many clinicians would argue that life expectancy should play a role in determining the benefits and harms of an intervention, thus in some men over 70 it could be reasonable to employ a particular intervention after considering context. The second alteration to our population criteria was nationality of study participants. We determined that it was not reasonable to exclude a study solely because the population of participants did not consist of United States men. In fact, when reviewing benefits and harms of PSA-based screening in men, the USPSTF made no such exclusion, including both randomized trials from both Europe3,
4
and the United States.5, 6 However, we did consider nationality of study population in assessment of external validity which was determined in part by degree to which the study findings were applicable to men with affected relatives in the US population.
Exposure and Comparator
The exposure required for inclusion was documentation of a family history of prostate cancer in at least one first-degree relative by medical records, registry,
self-administered or interview-self-administered questionnaire. Included studies were also required to demonstrate an adequate comparator group that closely resembled cases or those
first-20
degree relatives, although we list these findings only in the appendix as this is beyond the scope of this current review.
Outcome
Included studies were required document aggressive prostate cancer. As determined by an abbreviated panel and discussed in the Introduction, determination of
aggressive prostate cancer required the study to report any of the following characteristics:
pathologic or clinical TNM Stage, Gleason pathologic grade, pre-diagnosis PSA or prostate cancer death. Aggressive disease was defined as Gleason score greater than or equal to 7, clinical or pathologic TNM Stage of T3a or greater, pretreatment PSA of 20 ng/mL or more or death attributed to prostate cancer. The definition of aggressive disease is modified from the 2010 TNM Staging System and corresponds to higher mortality than non-aggressive disease.70-72
Absolute and Relative Risk
Though clearly valuable in determining relative risk, cross-sectional and case-control designs do have limitations, one of which being the inability to provide an
absolute risk. Relative risks, also known as risk ratios, indicate the change in risk – or
probability of observing an event or outcome – associated with an intervention or patient “risk factor,” compared to a control. Relative risks provide a measure of overall
probability of an outcome or event occurring, but do not provide insight into the
21
risk provides a more complete understanding of family history as a clinically meaningful
risk factor.
Without an understanding of the absolute risk of positive family history, it could be harmful to weight this risk factor heavily when defining groups of men most likely to benefit and least likely to be harmed by screening with the PSA. Therefore, we will report or calculate absolute risk and attributable risk from all cohort studies that find a significant increase in risk of aggressive cancer in men with compared to those without affected relatives. If a study does not report a significant difference between men with and without a family history, there will be no difference in absolute risk.
Time Period in Literature
The time period over which the literature was included was between the year 1992 to the present time. This range was chosen because of the considerable prevalence in clinical practice of using PSA as a screening tool for prostate cancer. As referenced above, the introduction of the PSA as a screening tool has had a large effect on the frequency and stage at which prostate cancer is diagnosed.
Time Period Allotted for Outcome
The time allotted for the outcome to become detectable was forty years of age as the disease –regardless of any combination of risk factors – is considered to be very
infrequent in men younger than 40.22 As described above, we had initially set a limit of 70 years for the outcome to occur, however we determined that setting such a limit was not clinically justifiable and additionally would have limited our search yield without sufficient reason.
22
We limited the review to randomized-controlled trials, cohort studies, case-control and cross-sectional studies. Only randomized studies and cohort studies would allow for evaluation of absolute risk. Absolute risk was only calculated if a difference in relative risk was found. Case-control studies reporting odds for aggressive disease (or providing necessary data for calculation) approximated risk ratios as aggressive prostate cancer is a rare event in the general population. However, odds could overestimate the relative risk if evidence shows that aggressive prostate cancer is not a rare event in men with affected relatives, but considering that only 3% of men die from prostate cancer, this was unlikely to be observed. Overestimation of risk, if it was found to exist, would be accounted for in interpretation of results and have implication for internal validity. Cross-sectional studies were included as family history can be considered – to a certain degree – to be a constant risk factor. If family history is considered a constant risk factor (genetic predisposition), a cross-sectional study will approximate a longitudinal study. Meta-analyses and systematic reviews were identified and examined for additional references, but were not themselves included in the analysis as doing so would have introduced redundancy and either dilution or magnification of the magnitude of risk.
Use of Observational Studies
23
magnitude of risk that men with a family history face of dying from prostate cancer using aggressive disease as a surrogate. For this purpose, cohort, case-control and
cross-sectional studies are valuable. Additional Criteria (a priori)
Studies were excluded if they provided incidence rates or relative risks of particular polymorphisms (e.g. a particular SNP, risk loci on chromosome 8q24 or mutated receptor) without also addressing risk of overall prostate cancer and aggressive prostate cancer. The degree of association and corresponding risk for aggressive prostate cancer and a specific genotype—phenotype is beyond the scope of this review. However, studies could still be included if they provided enough information for the reviewer to determine risk of aggressive prostate cancer in those with and without a family history of the disease.
Process of Study Selection
We examined the results from the searches described above by abstract, noting study design, exposure and outcome assessment, and publication date. A second reader did this as well, independently. In an effort to include as many studies as possible for full-text review, exclusions were only made at this stage if it was clear that a study would not answer or was not relevant to our key question. The majority of these excluded studies fell into one of three categories: studies of familial cancers other than prostate cancer, studies of risk factors for prostate cancer other than family history and studies focusing on specific polymorphisms or genotypic permutations. While certainly valuable to
24
the evaluation of risk of family history in the general population. At the time of
independent review, if either of the reviewers determined that an abstract did not clearly fail to meet eligibility criteria, the entire body of the article was examined. If the
reviewers failed to agree on the ability of a study to meet criteria, the entire article was reviewed independently by a senior third reviewer.
Assessment of Quality
Process of Assessment
The quality of the studies included in the review was assessed by criteria
developed by the USPSTF for randomized trials and with Strengthening the Reporting of Observational Studies in Epidemiology Statement (STROBE)73 and criteria outlined by Deeks et al., 2003.74 The USPSTF criteria for randomized controlled trials is well
established and has been used in the reviews upon which recommendations were made for breast cancer screening with mammography and PSA-based screening for prostate
cancer.2, 75 The STROBE criteria was developed by a collaborative group including epidemiologists, methodologists, statisticians, researchers and journal editors.73 The Strobe Statement is used in journals such as the Annals of Internal Medicine, Archives of Internal Medicine and the Lancet. The criteria provided by Deeks et al. was used to further characterize internal validity and to ensure that a reasonable degree of continuity existed between quality grades determined through use of the two sets.
25
study contributed little overall value to the body of literature addressing our key questions. External validity was assessed by examining biological representativeness of the study participants, the size of the population studied, use of protocols for design and accurate use of both exposure status and diagnostic measures. When reviewing quality, we created a separate document with only the study number and author in an attempt to minimize bias due to study population, results or journal title. The STROBE statement and Deeks et al. are included in Appendix. [Note: although we attempted to find randomized trials, we did not identify any with our search. The following describes the components of the quality assessment for observational studies only.]
Assigning Overall Quality Grade
Internal validity and external validity were each given ratings of poor, poor to fair, fair, fair to good, good. Each subsequent category was given a point value (poor=1, poor to fair=2, etc.) The total point value determined the overall quality grade. A perfect hypothetical study would receive a score of 10, the worst hypothetical study would receive a score of 2. Point values and grades were as follows: 5 points or less was POOR, 6 to 7 points was FAIR, and 8 points and above were GOOD. See Table 2 below for further description of scoring grade. Studies that received POOR for both internal and external validity were not included in the quantitative synthesis of outcome assessment. A description of these studies and reasons for grades of POOR for internal and external validity are provided in the Appendix.
Table 2 Grading System for Overall Quality
Point Ranges Overall Grade
≤5 Poor
6-7 Fair
26
Assessment of Internal Validity, Confounding, External Validity
Evaluation of internal validity included assessment of selection, measurement bias, and identification and adjustment for confounding. Selection bias would be minimized in a study with the following characteristics in which the study population resembled the source population. There would also be less risk of selection bias in the studies in which groups (cases, controls; exposed, non-exposed) are similar and maintained with minimal dropouts (or no outcome).
Selection bias would be more pronounced in studies in which the participants were volunteers, recruited with other inadequate sampling method (consecutive assignment, referral for elevated PSA, status post radical prostatectomy or TURP), if participants differed in baseline characteristics, geographical setting, practice setting (specialty clinic, status-post surgery), or if participants refused, were lost to follow-up, or had varying levels of health care access and treatment options. Measurement bias was a considerable concern when developing the quality assessment criteria because of the tendency for measures of TNM System staging, Gleason scores and prostate cancer specific-mortality to change over time.50, 51 Family history statuses collected by interview (surveys or in-person) or through medical records were subject to
imprecision, but could be minimized by using a combination of methods. Individual methods of questionnaire delivery were subject to different risks of bias. Mailed questionnaires had a high susceptibility to selection bias as these participants had many barriers to successful participation in the study. In person self-reports or in-person questionnaires (likely to have
conducted/collected on-site) were less likely to be subject to selection bias, however any retrospectively collected data was vulnerable to recall bias. In-person interviews were
cross-27
referenced with medical record documentation.76, 77 Additionally, men with particularly aggressive cancer (with or without a family history) may be unable to enroll in a study due to severity and rapidity of their disease (thus removing them from the population prior to study recruitment).
Each of our definitions of aggressive prostate cancer was susceptible to unequal, invalid and unreliable measurements, however bias could be minimized by using same measurement between both groups (histology for both aggressive and non-aggressive prostate cancer versus histology for some and cytology for others etc. or using symptoms for metastatic disease such as bone pain versus PET/CT for another group of participants to denote distant spread). Although there is debate in the literature, cytologic and histologic are considered to be comparable in the diagnosis of prostate cancer.78 Measurement bias could be minimized by using the same measure for all cases, blinding and with centralized review.
Recall bias was a concern for measurement bias and possibly confounding. Recall bias may act as a confounder because it is related to the exposure and outcome, is not a causal intermediate and is differentially distributed between groups. Recall bias is likely to be more pronounced with retrospective studies and potentially controlled with proper methodology such as measuring family history at baseline rather than at a time after study initiation.
Hyperawareness, hyper-vigilance, and subsequent excessive and or early screening,
28
External validity determined the degree to which the results of a given study could reasonably be considered applicable to the general population of men in the United States with a family history of prostate cancer. External validity would be low if the study population was representative of one small component of the socioeconomic distribution, localized to one
geographic location, one ethnicity, consisted of a narrow age range, or included men who were at different levels of risk than men with positive family history in the general United States
population. Another concern to external validity was family history exposure in the study population in comparison to the general population, with the exposure potentially over-represented in the study population (and possible source population in specialty clinics for example).
Bias in Study Design
All study designs are subject to bias. Though a good quality randomized trial is likely to have less bias than a cohort, case-control or cross-sectional study, respectively, a well done cohort design may provide more certainty than a poor randomized study. This can be applied to all study designs, however in general, we considered the certainty of results to be greatest to least as the following: randomized studies, cohort, case-control and cross-sectional. Again, because cross-sectional studies measuring exposure of family history had the capacity to approximate a longitudinal study, we did not exclude this design from inclusion. Considering our key
question(s) and clear challenges of identifying any randomized studies, we determined that prospective cohort studies would likely be least susceptible to bias, while a poor quality cross-sectional would be most susceptible to bias.
29
Both reviewers independently examined each article meeting inclusion criteria for characteristics including study design, population, exposure, comparator group, study design, and outcomes. The articles were filed in EndNote and Microsoft Excel (see Appendix). Data Synthesis
For all included studies, we applied quality criteria described above and extracted data on study population, exposure and outcome (see Appendix). We reported by quality and also by outcome type (TNM Stage, Gleason score, PSA, mortality). Our review does not include a multi-effect meta-analytical review of the literature, however the quality of evidence and results by outcome-type are provided along with a narrative review. Studies of higher quality will be weighted more heavily than studies of poorer quality. For grading the strength of evidence we modified guidelines developed by Owens et al. (AHRQ Series Paper 5, 2010)79 for comparing medical interventions.
Study Screening by Title and Abstract
I examined the results from the searches described above by abstract, noting study design, exposure and outcome assessment, and publication date. A second reader did this as well, independently. In an effort to include as many studies as possible for full-text review, exclusions were only made at this stage if it was clear that a study would not answer or was not relevant to our key question. The majority of these excluded studies fell into one of three categories: studies of familial cancers other than prostate cancer, studies of risk factors for prostate cancer other than family history and studies that focused specifically on particular polymorphisms or permutations. While valuable to
30
family history in the general population. At the time of independent review, if either of the reviewers determined that an abstract did not clearly fail to meet eligibility criteria, the entire body of the article was examined. If the reviewers failed to agree on any article’s ability to meet criteria, the entire article was reviewed independently by a senior third reviewer.
Study Exclusion by Full-Text Review
We excluded 25 studies at the full-text review stage. Twenty of these 25 studies did not meet eligibility criteria with regards to outcome; they did not report or allow for derivation of aggressive disease. Although the studies evaluated correlation of family history and prostate cancer, the studies did not report characteristics of prostate cancer in such a way that aggressive disease could be assessed. Most of these studies did not report a Gleason, TNM Stage or mortality (etc.) or described characteristics in such a way that limited utility (for example reporting a median PSA, median Gleason etc.).
Results
Search Results
I searched MEDLINE and EMBASE on February 22, 2012 using search strategies developed with the assistance of a library science expert (see Acknowledgements) at Health Sciences Library at UNC-Chapel Hill. Our initial search yielded 8,706 studies (912 studies from MEDLINE and 368 from Embase).
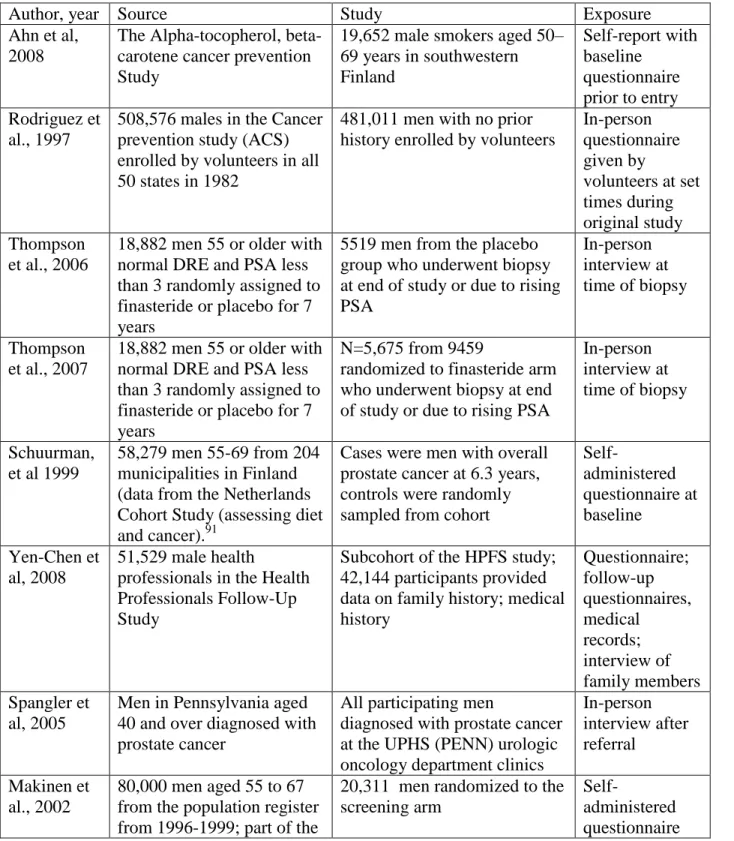
Table 3 Studies included in qualitative and narrative review by nationality
Authors Publication
Year
Country of Publication
Ahn et al 2008 Finland
Rodriguez et al 1997 United States Thompson et al 2007 United States Thompson et al 2006 United States
Makinen et al 2002 Europe*
Yen-Chen et al 2008 United States Spangler et al 2005 United States
Valeri et al 2000 France
Kotis et al 2002 United States
Schuurman et al
1999 Finland
31
We added an additional 128 studies through consultation with experts and hand search of the 38 references meeting initial eligibility. A total of 780 studies remained for screening after
removing duplicates. A flow chart of our study identification process is described in Figure 2. After screening by title and abstract (described below), a total of 38 studies underwent full-text review. An additional 25 studies were excluded because of an inability to meet our PECOTTS criteria upon closer examination (described below). Thirteen studies met eligibility requirements and were reviewed qualitatively. Of these 13, 2 studies were of poor quality due to poor internal and external validity and/or possessed a “fatal flaw” in methodology. The 11 remaining studies were used in a narrative/quantitative review of the literature to assess our key questions.
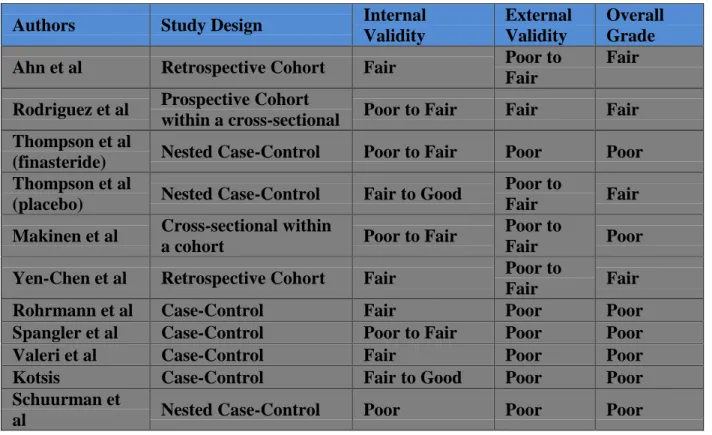
Table 4. Summary of Quality Assessment for Included Studies
Authors Study Design Internal
Validity
External Validity
Overall Grade
Ahn et al Retrospective Cohort Fair Poor to
Fair
Fair
Rodriguez et al Prospective Cohort
within a cross-sectional Poor to Fair Fair Fair Thompson et al
(finasteride) Nested Case-Control Poor to Fair Poor Poor Thompson et al
(placebo) Nested Case-Control Fair to Good
Poor to
Fair Fair
Makinen et al Cross-sectional within
a cohort Poor to Fair
Poor to
Fair Poor
Yen-Chen et al Retrospective Cohort Fair Poor to
Fair Fair
Rohrmann et al Case-Control Fair Poor Poor
Spangler et al Case-Control Poor to Fair Poor Poor
Valeri et al Case-Control Fair Poor Poor
Kotsis Case-Control Fair to Good Poor Poor
Schuurman et
32
Table 5. Results from included studies by study design, quality and outcome type
Authors Study Design Outcome
Type
Overall Quality
Results
Ahn Retrospective
Cohort
Gleason ≥7, TNM Stage
Fair RRGleason Not significant RRTNM 4.16 (2.67-6.49)
Rodriguez
Prospective Cohort within a
cross-sectional Prostate cancer-specific mortality Fair
RR (by Age)
<65: 1.46 (0.80-2.67) 65-69: 1.89 (0.19-2.99) 70-74: 1.90 (1.26-2.87) 75-79: 1.88 (1.27-2.77) ≥80: 1.02 (0.62-1.68) Thompson
(finasteride)
Nested
Case-Control Gleason ≥7 Poor
ORGleason : not significant
Thompson (placebo)
Nested
Case-Control Gleason ≥7 Fair
ORGleason : not significant
Makinen Cross-sectional within a cohort
Gleason ≥7,
T3a, T3b, M1 Poor
RRGleason 0.6 (0.2-2.0) RRTNM 1.0 (0.3-3.0)
Yen-Chen Retrospective Cohort
Gleason ≥8,
T3b or higher Fair
RRGleason 1.74 (1.50-2.02) RRTNM 1.76 (1.37-2.26)
Rohrmann Case-Control Gleason ≥7,
T3a or higher Poor
ORGleason 0.73 (0.45-1.18) RRTNM 0.8 (0.5-1.28)
Spangler Case-Control Gleason ≥7,
T3a or higher Poor
ORGleason 0.79 (0.56-1.12) ORT3a 1.30 (0.89-1.91) ORT3b 1.91 (0.98-3.73) ORM1 1.04 (0.26-4.22)
Valeri Case-Control Gleason ≥7 Poor ORGleason Not significant ORTNM Not significant Kotsis Case-Control Gleason <7 Poor ORGleason 1.96 (1.13-3.41)
Schuurman
et al Case-Cohort Gleason ≥7 Poor
RRTNM (fathers) 1.98 (0.93-4.24)
RRTNM (brothers) 5.33 (1.36-20.85)*
Table 3. Absolute risk and attributable risk proportion for calculated from cohort studies
Study Absolute Risk by Outcome Type Attributable Risk Proportion
Ahn Gleason
ARexposed 0.02 ARnon-exposed 0.01
TNM Stage ARexposed 0.04 ARnon-exposed 0.01
ARP (Gleason) 5.9 cases over 12 years
ARP (TNM) 17.6 cases over 12 years Rodriguez Prostate cancer-death/person-years
ARexposed 0.0005; ARnon-exposed 0.0008
ARP 0.04 per 125 person-years Yen-Chen Gleason
ARexposed 0.010
TNM Stage ARexposed 0.015
33
ARnon-exposed 0.006 ARnon-exposed 0.010 ARPTNM 26.2 cases over 14 years
Synthesis of Study Design and Population
A total of 11 studies were included for quality assessment. Overall, there were 3 cohort studies, 7 case-control studies and 1 cross-sectional study within a cohort. Two of the 3 cohort studies were derived from large-scale, population-based cohorts designed to collect data for multiple purposes. The other cohort was derived from both the
intervention and control arm of a randomized controlled study. Notably, none of the cohort studies were designed specifically to answer our key question. However, each provided data for assessment of rate ratios, absolute risk and attributable risk of exposure for our outcome. Three case-control studies and the cross-sectional study were nested in randomized controlled trials. The other 4 case-control studies were single institution-based studies at specialty clinics. As described in Table 3, four of the studies were institution-based in Europe, seven were conducted with participants from the United States.
Demographics
34
of a randomized trial. Baseline age of participants and socioeconomic variables were adjusted for in most studies.
Screening Prior to Enrollment
Screening rates prior to enrollment varied within the study populations. The various populations were accounted for in the quality assessment with regards to selection bias (if the study population did not represent the base/source population) and external validity (if either the source or the study population was not comparable to the general United States population). Although only 3 studies specifically address screening, rates are likely predictable based on nationality of the study population. All three studies to address screening rates in the methods section had high screening rates, and other United States study populations also likely had high rates per guidelines existing at that time. One European study was the control arm of the ERSPC trial and thus had no screening. The other European studies also likely had low levels of screening per guidelines. The implications of the various degrees of screening are unclear. For most studies, a prior diagnosis of prostate cancer resulted in exclusion, likely regardless of histologic grade or stage. Because men with a family history are more likely to be
screened at an earlier age in the United States, it is possible that this would result in a bias towards the null. However, it is also possible that by excluding men with (most likely – statistically) benign disease from participation, the incidence of aggressive disease within the “exposed” study population would be concentrated and thus cause a bias away from the null. Moreover, the bias is complicated by the unknown impact of PSA-based screening on incidence and mortality of aggressive prostate cancer.
35
Documentation of family history for most of the studies included in the review were by in-person interviews or questionnaires either in-person (given by volunteers) or self-administered. Six studies obtained in-person interview or self-administered
questionnaire prior to study enrollment, the remaining 5 (all case-control) collected family history after outcome measure. Five of the 11 studies collected self-administered
questionnaires, 4 studies obtained in-person interview or in-person questionnaires. Two of the studies used multiple methods to cross-check family history, one in-person interview and medical records, the other mailed questionnaires and had telephone follow-up.
Outcomes
The outcomes of each study are provided in Table 5. Outcomes for aggressive disease were reasonably comparable across study types and study populations. However, given the variability of diagnostic modalities, screening recommendations and temporal trends, a meta-analysis was felt to be inappropriate due to high risk of imprecision and inaccuracy when coalescing variable characteristics.
Gleason Score
Nine studies reported aggressive disease by Gleason score. Of these, 2 of the studies were cohort, 7 were case-control and 1 was cross-sectional. Nine of the studies defined aggressive prostate cancer as greater than or equal to 7. One study reported aggressive Gleason as greater than 7. Overall, 2 studies reported increased relative risk of aggressive disease in men with affected first-degree relative compared to men without positive family history and 8 studies reported no statistical significance.
36
reporting increased relative risk (Yen-Chen et al.), we calculated a risk difference of 0.004 and an attributable risk of 20.9 cases over 14 years. All 6 case-controls studies reported no statistical difference for odds of aggressive cancer defined by Gleason. One of these case-control studies was of fair quality, five were poor quality. One fair quality cross-sectional study within the ERSPC cohort also reported no statistical significance.
Summary Report for Gleason
Two cohort studies; one fair quality reports increased relative risk, one fair quality
reports no difference
Six case-control studies; one fair and five poor quality report no difference,
One cross-sectional; fair quality reports no difference
TNM Stage
Seven of the included studies reported aggressive disease by TNM Stage. Of these, 2 were cohorts, 4 were case-control and 1 was cross-sectional. Overall, 3 studies showed family history was significantly associated with aggressive prostate cancer. Two cohort studies, Ahn et al. showed relative risk of 4.16 (2.67-6.49) and Yen-Chen et al. reported relative risk of 1.76 (1.37-2.26) of aggressive cancer for men with an affected first-degree relative compared to men without family history. We calculated absolute risk for Ahn et al. of 0.04 for aggressive disease in the exposed compared to 0.01 in the non-exposed, corresponding to an attributable risk of 17.6 cases over 12 years. For Yen-Chen et al., the absolute risk in the exposed and non-exposed was 0.015 and 0.010, respectively, for TNM defined aggressive disease. We calculated the risk of aggressive disease
37
One poor quality case-cohort reported odds of reported relative risk of 5.33 (1.36-20.85) for men with affected brothers, but no significance for men with affected fathers. Three poor quality case-control studies and one fair quality case-cohort study reported no statistically elevated risk for aggressive disease defined by T3 overall, T3a, T3b and metastatic disease compared to men without family history.
Summary Report for TNM Stage
Two fair quality cohort studies show increased risk – relative risk of 4.16 and 1.76,
absolute risk difference of 0.03 and 0.005, attributable risk of 17.6 cases over 12 years and 26.2 cases over 14 years
One poor quality case-cohort shows increased risk, three poor quality case-control
and one fair quality cross-sectional study show no increase risk
PSA Levels at Diagnosis
One poor quality case-control (Norrish) study reported PSA levels of 20ng/mL or more at the time of diagnosis. Authors found PSA of 20 ng/mL or more to be less common in men with family history of prostate cancer than in men without such history. However, the study had several important limitations and was excluded from analysis (Table XXXX).
Summary Report for Pretreatment PSA
One case-control study met eligibility, but was excluded due to poor quality
Prostate Cancer-Specific Mortality
One fair quality cohort study reported prostate cancer-specific mortality
38
absolute risk. Relative risk of prostate cancer-specific mortality was higher in men aged 70-74 and men aged 75-79 with family history of prostate cancer compared to men without such history. However, there was no difference in relative risk for men aged less than 70 and more than 79 years. We calculated a risk difference of 0.0003 and an
attributable risk of 0.04 per 125 person-years for aggressive disease given positive family history.
Summary Report for Prostate Cancer-Specific Mortality
One fair quality cohort showed increased relative risk for men ages 70-79, risk
difference was small (0.0003) for all ages included, attributable risk of 0.04 per 125 person-years
Summary of Overall Outcomes
All 3 cohort studies showed some increase in risk for at least a subset of the study
population, however the risk difference and attributable risk was small.
Seven non-cohort studies showed no increase in risk magnitude, 1 showed
increased risk for men with affected brothers but not fathers.
Synthesis of Evidence
39
population of men and have longer follow-up. Studies with longer follow-up were more likely to report increased risk, but for all of these studies the absolute risk of the exposed was similar to that of the non-exposed. There was a concern that Gleason- and TNM-defined aggressive cancer would show increased incidence rates in later studies compared to earlier studies (due to upward migration and increased use, capacity of imaging
technology), however the extent to which this was evident is unclear.
Strength of Evidence
Risk of Bias
Although observational studies are generally considered inferior to randomized trials in hierarchy of study design to assess effect of a “risk factor,” a methodologically conscientious cohort or case-control study has the potential to produce unbiased results. In the 11 studies included in the quantitative assessment, 3 were cohort, 7 were case-control and 1 was cross-sectional. Application of quality criteria yielded 3 fair quality cohort studies, 1 fair and 6 poor case-control studies and 1 fair quality cross-sectional study. We did not set an a priori minimum percentage of good, fair or poor quality studies to determine low, medium or high risk of bias. However, given our knowledge of study quality and critical appraisal, we concluded that 55% poor, 45% fair and 0% good quality most likely denotes a high risk of bias in the evidence.
Consistency
40
determined by the range of the effect size. A narrow range of effect size would denote consistency while a wide range of effect size would indicate inconsistency.
Of 9 studies reporting Gleason score, 1 showed increase in relative risk, 8 showed no difference. Of 7 studies reporting aggressive disease by TNM Stage, 3 showed
increase in relative risk, 4 showed no difference. The 1 study reporting PSA was excluded. The study reporting prostate cancer-specific mortality showed increased relative risk for men aged 70-79.80
In summary, the evidence is inconsistent. While Gleason-based outcomes were more consistent in proving the null, it did not do so for one fair quality cohort. TNM Stage was determined to be inconsistent. Only one study reported prostate cancer-specific mortality and it showed only increased risk for one men aged 70-74 and 75-79. Of note, screening in this group has previously been found to have less benefit that harm.81 Therefore, overall the evidence was felt to be inconsistent.
Directness
In adopting our criteria for “aggressive” prostate cancer, we designed our review to be limited with regard to directness. Although Gleason scores of 7, 8 or more and TNM Stage T3 or above have been shown to be associated with greater risk of death from prostate cancer,51, 82 the predictors themselves are intermediates or surrogates for clinically important outcomes (in this case prostate cancer-specific mortality or overall mortality). Ten of 11 included studies reported only clinical intermediates. Prostate cancer-specific mortality, though superior to the other surrogates, is also inferior to overall mortality with regard to directness. Overall, the evidence is indirect.
41
The degree of certainty for the estimates of effect or lack thereof determines precision and precise estimate is one which is clinically useful. With regard to Gleason and TNM Stage, we feel there is a high degree of certainty that – in the absence of clinical or patient-specific context – a man reporting family history of prostate cancer in a first-degree relative is not in and of itself a reasonable justification to consider that man to be at increased relative risk of aggressive – clinically significant – prostate cancer compared to a man without such a family history.
Plausible Confounding
Observational studies examining effect of family history and aggressive disease have risk of confounding that may work in a direction opposite to the observed effect. This would occur in the form of hyper-awareness, artificial over-estimation of risk perception, overdiagnosis and overtreatment of relatively benign disease that is not
42
Conversely, confounding could also exist that works away from the null. Certain prostate cancers are aggressive and it is reasonable to speculate that there are genetic components to this (and all) cancers. Aggressive prostate cancers may be less likely to be detected with regular PSA-based testing, while less aggressive cancers may be more likely to be detected. Thus, men with affected relatives who may have higher a likelihood of aggressive disease may be over-represented in the population (because men with less aggressive disease have been excluded with PSA-based screening) and cause an amplification of an effect that is away from the null.
Publication Bias
Publication bias is a concern in any systematic review. For this and most reviews, publication bias would most likely have a tendency to move the observed effect away from the null. However, because family history of prostate cancer has been considered a clinically reliable risk factor for overall prostate cancer since 1960,83 it may be that a publication bias would actually favor the null. See the Discussion for further details and methods we used to address and minimize publication bias.
Discussion
In our review of the literature, we found that the evidence on relative and absolute risk of aggressive prostate cancer in men with a positive family history in at least one first-degree relative is mixed. Furthermore, the quality of evidence examining the relationship of family history and aggressive disease is poor to fair overall.
Summary of Evidence
Gleason-43
defined, TNM-defined and prostate cancer specific mortality is mixed. We calculated absolute risk and attributable risk for studies reporting increased relative risk for aggressive disease in men with affected relatives compared to those without; we found absolute risk difference and attributable risk to be small and unlikely to change the benefit-to-harms ratio described by the USPSTF regarding the general population (see Clinical Implications).2 Seven case-control (1 fair, 6 poor quality) and one fair quality cross-sectional study also report mixed findings, but most show no statistically significant increase in risk magnitude of aggressive prostate cancer for men with a family history. The evidence indicates that if it exists, the magnitude to which men with affected first-degree relatives are at increased risk for aggressive prostate cancer is likely small.
Congruency with Existing Literature
As mentioned in the introduction, four formal meta-analyses and two informal reviews have assessed the relationship between overall prostate cancer and family history. In contrast to previous reviews, this review exclusively assesses risk associated with only aggressive prostate cancer. All previous reviews have found men with family history to have increased relative risk for prostate cancer than men without family history.
Importantly, reviews by Bruner9 and Zeegers7 stratify risk of having an affected brother or father and Johns67 stratifies by number of affected first-degree relatives when assessing evidence on overall prostate cancer. We did not stratify our results in this review and discuss the clinical implications of this below (see Clinical Implications).
Overall, we found that evidence of increased risk of aggressive prostate cancer in men with a family history is incongruent with evidence of increased risk of overall
44
Congruency with Recommendations of Professional Societies
Importantly, our review informs but does not evaluate PSA-based screening in men with at least one affected first-degree relative. However, we extrapolated our finding in terms of implication for such screening modalities. In doing so, we found the evidence to be incongruent with current recommendations from the American Urology Association and the American Cancer Society which encourage men with a positive family history to undergo screening at an earlier age. Our review is congruent with the United States Preventive Services Task Force recommendation against PSA-based screening in men with a positive family history. While previous systematic reviews and meta-analyses show that a positive family history is associated with increased risk for overall prostate cancer, we have found inadequate evidence that the association persists for aggressive
prostate cancer. As described in the Introduction, men with a family history significant for prostate cancer are more likely to undergo earlier and more frequent screening compared to men without such history.84 This tendency may be attributable to recommendations from these professional societies and or an increased anxiety or awareness of prostate cancer. As a result of these factors, men with a positive family history may be more likely to suffer harms of overdiagnosis and overtreatment than men in the general population (see Clinical Implications).
Congruency with Other Commentaries
45
of the evidence is incongruent with use of family history in risk calculators or in risk stratification schemes.
Limitations of the Review
Publication Bias
Our review has several limitations. Publication bias is a common short-coming of systematic reviews and if present would tend to push our findings away from the null (see Strength of Evidence). To evaluate for publication bias, we searched for unpublished abstracts in both the American Society of Clinical Oncology and Genitourinary
International Symposiums from 2000 to 2012. We identified one unpublished abstract from the 2005 ASCO Annual Meeting reporting an earlier age at diagnosis in black men with a positive family history in at least one first-degree relative; however, we were not able to determine whether criteria for aggressive disease was met.86 It is unlikely that additional unpublished data would provide convincing evidence to change our conclusion.
Variable Populations