A Retrospective Cohort Study of Mortality Associated with Tuberculosis in North Carolina, 1993-2003
By Lisa T. Nguyen
A Master's Paper submitted to the facuity of The University of North Carolina at Chapel Hill
in partial fulfillment of the requirements for the degree of Master of Public Health in
the Public Health Leadership Program
ABSTRACT
Introduction Previously reported predictors of mortality have focused on mortality during TB treatment. We propose instead to examine TB deaths relative to TB treatment. We predict that different characteristics will predict death before TB treatment, early in TB treatment and later in TB treatment.
Methods A retrospective cohort study was performed using data collected on all patients reported to the North Carolina TB Control Program in conjunction with data obtained from the U.S. National Death Index. Bivariate, multivariate and survival analyses were performed to examine relationships between patient characteristics and time of death relative to treatment.
Discussion Overall, increasing age and HIV/TB co-infection were predictors of death prior to starting TB therapy and during all stages of TB therapy. Additional
TB patient characteristics also existed that predict death specifically before
INTRODUCTION Burden of Disease
Tuberculosis (TB) is a contagious but curable disease that continues to affect
millions of people worldwide. Caused by Mycobacterium tuberculosis, TB can be spread to others when those with active pulmonary TB cough, propelling
respiratory droplets laden with TB bacilli into the air. It is estimated that there
were 8.3 million new TB cases worldwide in 2000, with an annual case rate
increase of 1.8% each year between 1997 and 2000[1]. Additionally, despite
directly observed treatment, short-course (DOTS) strategy, TB related mortality
figures remain unacceptably high around the world.
Although the Americas do not carry the burden of disease that other regions of the
world carry, 2004 TB incidence rates range from 5.5 per 100,000 people in
Canada to 188.0 per 100,000 people in Peru[2]. In the United States, 14,511 new
cases (4.9 cases per 100,000 people) of confmned TB in the United States were
documented in 2004. Though this is the lowest case rate to be reported since
1953, the 3.3% decline from 2003 is only the second smallest yearly decline since
1993[3]. The U.S. also saw 802 deaths (0.3 deaths per 100,000 people) directly
attributed to TB in 2002, representing a 5.0% increase from the previous year and
the first increase in U.S. TB deaths sincel989[4]. Data on the 2003 and 2004 TB
Predictors of Mortality
TB associated mortality may occur prior to initiation of TB therapy, during TB
therapy or subsequent to TB treatment completion. However, most studies that
have examined predictors of TB-associated death have focused only on death
during TB treatment. Reported predictors of mortality during TB treatment
include medical co-morbidities[ 5-l 0], previous TB treatment[?, 11 ], HIV 1TB
co-infection[10, 12-14], low weight[9, 15] and alcoholism[ll, 16]. Less frequently
reported risk factors include home1essness[8], significant weight loss[ll] and
multidrug resistance[13]. Older age has been shown to be a predictor ofTB death
in some community-based treatment settings [5, 7, 16, 17], but not in others[8,
15, 18]. In general, the studies discussed thus far focus on risk factors that predict
death in patients undergoing TB treatment, with little distinction between
characteristics associated with death early in treatment versus later in the
treatment period. However, TB associated deaths occur at many points in the
course of TB treatment and it may be possible to clarifY some of the variation by
examining mortality risk factors relative to time ofTB treatment.
A handful of studies have reported the frequency of death prior to TB
treatment[ll, 17, 18] (Appendix A). Additionally, Farah et al. reported that the
median age of those who died prior to TB treatment was 71 years of age [17].
Walpola et al. presented a limited case series of 25 patients who died prior to
while the other 72% presented more than one day before death but were not
diagnosed with TB until after death [18].
After these initial deaths prior to TB treatment, death can be viewed as occurring
in two phases during TB therapy: the initial weeks of TB therapy and the later
weeks of treatment. The early treatment time period may include hospital
admission and represent a time of high acuity of illness. A study by Sacks et al.
reported that 32% of hospitalized TB patients died within the first 7 days of
admission; 50% of admitted TB patients died by day 19 ofhospitalization[9]. On
the other hand, the later treatment time period (representing those who died after 8
weeks of treatment) may involve toxicity to treatment medications, treatment
failure or medical co-morbidities. The identification of risk factors associated
with death early in treatment compared to factors associated with death later in
treatment may prove useful in the development of specific strategies to prevent
TB mortality. Likewise, the identification of predictors of death before initiation
of TB treatment may allow for targeted public health efforts that will decrease TB
related death. Lastly, continued study of death during TB treatment is important to
confirm previously reported risk factors, as well as identify factors that have not
been studied thus far.
This study sets out to explore TB patient characteristics associated with death in
the state of North Carolina, which is located in the southeastern United States.
incomes below the federal poverty level of any region in the country[l9], and is
different from the urban populations usually studied in the United States as it
comprises a predominantly rural population whose source of health care is
geographically scattered. Additionally, the 2000 United States National Census
revealed that the Hispanic/Latino population in North Carolina grew by 379%
between 1990 and 2000, the largest change in proportion of any state in the
U.S.[20]. Given that foreign born individuals make up an increasing proportion
of the TB cases in the United States[21 ], further analysis of TB risk factors in
North Carolina may provide useful clues for public health and individual health
care providers regarding the future of TB in America. Hence, the study of TB in
North Carolina offers a perspective on TB that is unique from past U.S. studies in
setting while also providing data on a population that is in fact similar to other
non-urban U.S. populations.
Study Aims and Hypotheses
The primary goals of this study were to determine the demographic and
behavioral risk factors associated with mortality among patients diagnosed with
TB in North Carolina during the ten year period, 1993 to 2003. TB-associated
mortality was evaluated relative to treatment, using the following subgroups: (I)
death prior to initiating TB treatment, including those who were already dead at
TB diagnosis (2) death early in TB treatment and (3) death later in TB treatment.
We hypothesize that we will be able to identify patient-specific characteristics
Additional specific hypotheses that we postulated include: environmental factors
would be identified that were significantly associated with overall mortality;
patients under age 5 and over age 65 would be more likely to die early in TB
treatment than patients age 5-64; patients with history of homelessness and/or
alcohol abuse would have higher rates of death prior to initiation of TB treatment
than those without history of homelessness or alcohol abuse; patients who were
homeless will have higher mortality rates later in TB treatment than TB patients
METHODS Study design
We performed a retrospective cohort study comparing the impact of various
patient characteristics on death in TB patients who were reported to the North
Carolina State TB Control Program between January 01, 1993 and December 31,
2003.
Institution Approval
The project was performed subsequent to approval by the Institutional Review
Boards (IRBs) of Duke University Health System, the University of North
Carolina-Chapel Hill's School of Public Health, and the North Carolina
Department of Health and Human Services' Division of Public Health,
respectively. Each IRB granted a waiver of consent and HlPAA authorization,
and we sufficiently met all requirements for data storage and protection of
confidentiality. Additionally, approval to query the U.S. National Death Index
(NDI) was granted by the National Center for Health Statistics.
Sample
Our cohort study includes data that are routinely collected on adult and pediatric
patients diagnosed with active TB via the Centers of Disease Control and
Prevention (CDC) data collection instrument, the Report of Verified Case of TB
(RVCT). This instrument captures all TB cases within the state ofNorth Carolina,
M tuberculosis after the patient has died, and cases that are based on a clinical diagnosis. This data is entered into a CDC database, the Tuberculosis Information
Management System (TIMS), and downloaded into the North Carolina TB
Control Program's Microsoft Access™ database. The North Carolina TB Control
Program's data set was used in conjunction with information obtained from the
NDI. The NDI is a national mortality database that has been shown to be a
reliable source of U.S. mortality data for medical and health research[22-24]. The
national database contains identifYing data from state-mandated death certificates
from all fifty states, New York City, the District of Colombia, Puerto Rico and the
Virgin Islands.
NDI Query Methods
Subjects who died prior to or during TB therapy were identified in the RVCT
records. The NDI was used to confirm time of death for these subjects, as well as
capture any deaths that were not identified by RVCT records, by sending the
identifYing data of all subjects obtained from the RVCT to the NDI to query for
linked records. Data sent for linking included subjects' Social Security number
(SSN), full name, date of birth (DOB), race, gender and last known state of
residence, as entered in the North Carolina TB Control Program's Microsoft
Access™ database.
Once the results of the NDI query were received, the records that correctly linked
those in the NDI database were separated from the inaccurate or false record
matches. To do so, specific link criteria (listed in Appendix B) were applied.
Records that did not fulfill any of the above requirements were discarded as
inaccurate or false matches. The dates of death obtained from the correctly linked
records were used in analyses of death relative to TB treatment.
Inclusion/Exclusion Criteria
All patients reported to the North Carolina TB Control Program were included in
the analyses. At the time of this study, death records up to December 31, 2003
were available from the NDI for all patients. All deaths that occurred by
December 31,2003 were included in the analyses.
Outcome Groups
Analyses focused on three outcome subgroups derived from timing of death. The
subgroup referred to as 'death prior to initiation of treatment' comprises all
reported TB patients who were diagnosed with TB but died before any TB
therapy was started; this subgroup includes patients who were diagnosed at
autopsy. The subgroup called 'death early in TB treatment' refers to all TB
patients who began TB therapy with the North Carolina TB Control Program but
died within the initial eight weeks of treatment and hence prior to completion of
treatment. The subgroup referred to as 'death later in TB treatment' comprises all
TB patients who initiated TB therapy, survived past eight weeks but died prior to
Exposure Variables
The elements reported in the RVCT were used to examine which patient
characteristics predicted death in the different subgroups. The demographic,
clinical and social (such as homelessness or excess alcohol use) characteristics
were based on either documented patient medical history or by patient self-report,
as recorded by public health nurses via the RVCT. The variables used in our
analyses are listed in Appendix C.
With regard to the race variable, in January 2003 the RVCT changed how it
categorized patients' race. Prior to 2003, patients were characterized as one of
four races: White, Black, American Indian or Alaskan Native, and Asian or
Pacific Islander. The 2003 RVCT separated 'Asian or Pacific Islander' into two
distinct categories, resulting in a total of five possible race choices. Patients are
now characterized as White, Black or African American, American Indian or
Alaskan Native, Asian, or Native Hawaiian or Other Pacific Islander. For the data
analysis of this study, the patients who were separated into Asian and Hawaiian or
Other Pacific Islander categories by the 2003 RVCT were collapsed into one
Asian-Pacific Islander category.
Statistical Analysis
The primary outcome of this study is time to death. Statistical analyses were
performed with Stata 8.1 (Stata Corporation, College Station, TX) and SAS,
was performed to examine the relationship between various patient characteristics
and the time of death relative to treatment. Differences in proportions were
assessed using the chi-square test or Fisher's exact test, as appropriate.
Differences in survival among groups with different demographic and risk
profiles were examined using the Kaplan-Meier method with survival functions
compared with the log-rank test.
Logistic regression modeling and Cox proportional hazards regression modeling
were used to examine the independent effects of multiple factors on time of death.
With regard to variables in which values were labeled as "positive", "negative" or
"unknown", such as HIV status, those with "unknown" values were assigned to
the "negative" category. Recognizing that this may result in the misclassification
of an unknown number of subjects, multiple imputation via the Markov chain
Monte Carlo method [25-27] was used to determine the potential effect of missing
data on the multivariate models. To do so, SAS 9.1 's PROCMI command was
used to generate 10 imputed datasets. The PROC MIANAL YZE command was
then used to combine odds ratio or hazards ratio estimates from regression models
performed on each of these datasets and generate confidence intervals that
incorporated the missing-data uncertainty; these imputed point estimates were
compared to the estimates obtained from our logistic and Cox proportional
Odds ratios, hazards ratios and 95% confidence intervals were calculated where
appropriate. Age was treated as a categorical variable, using TIMS-specified age
groups, in the univariate analysis and as a continuous variable in the multivariate
analyses. For all statistical tests, a p-value ::;:0.05 (two-tailed) was considered
significant.
Power Calculation
Statistical power of the overall sample was approximated usmg a survival
outcomes calculator found at the following website:
h!lg:! /vvvrw.ihsuh.edu/Rese2rch/Centers/CCT /iavmnarc/SSP l /SSP 1 v4ccthtm. We based our calculation on an estimated sample size of 5000 patients, representing
our entire study cohort. We assumed 10% exposure prevalence, with exposure
referring to the presence of one of the clinical or social variables under study,
such as HIV status; this exposure prevalence is based on an initial query of our
database. We will use Variable X to refer to one of those variables in our
description. Assuming that I 0% of the population has a positive history of
Variable X, the control survival rate, or rate of survival in those without a history
of Variable X, was set at 80% and the relative risk of dying in the exposed versus
the control group was conservatively estimated to be 1.5. Using these figures, at a
=
0.05, the probability that our sample will be able to detect a true difference inoverall survival, based on Variable X, is 89.8%. This power increases with
RESULTS
Overall Patient Characteristics
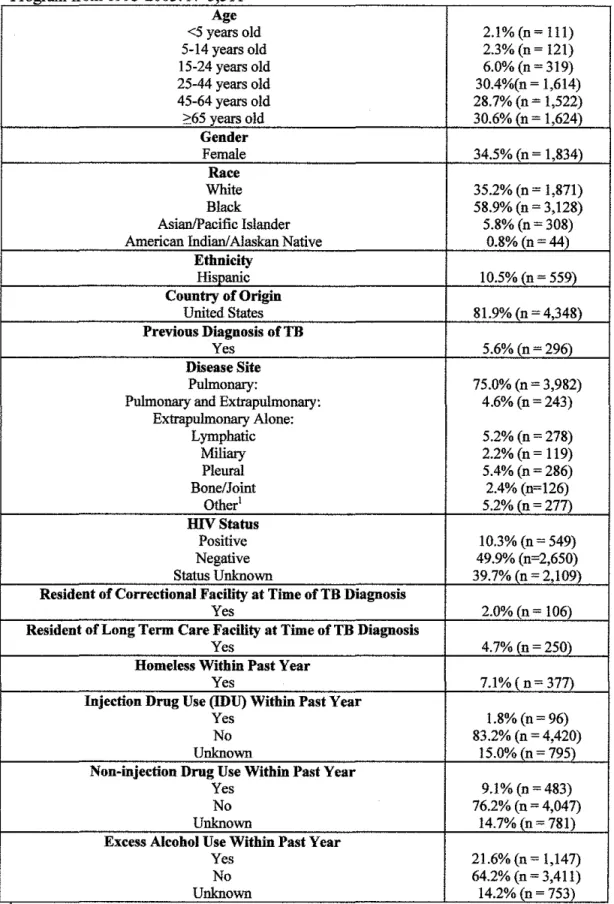
A total of 5,311 patients were captured by the North Carolina TB Control Program between 1993 and 2003, and their overall demographic and social characteristics are shown in Table 1.
30.4% (n = 1,614) of the study population fell between 25 and 44 years old while another 30.6% (n=1,624) were at least 65 years old. Over one-third (34.5%, n= 1,834) of the cohort was female. 18.1% (n = 4,348) of patients were born outside of the United States.
10.3% (n = 549) of the study population was HIV-positive, though 39.7% (n = 2,1 09) of patients were of unknown HIV status because the patients either refused the test, were not offered the test or the result of the test was not recorded. 2.0% (n = 106) of the study population was incarcerated at the time of the TB diagnosis, and 4.7% (n = 250) were living in a long-term care facility when diagnosed. 7.1% (n = 377) reported being homeless within the past year. 1.8% (n = 96) were injection drug users, and 9.1% (n = 483) used non-injection drugs. Excess alcohol use within the past year was reported in over one-fifth (21.6%, n = 1,147) of the study population.
= 76) showed resistance to both INH and at least one other drug, excluding RIF resistance. 0.4% (n = 21) of subjects had evidence of both INH and RIF resistance. Three-quarters (n = 3,982) of the cohort had pulmonary TB, and an additional4.6% (n = 243) had both pulmonary and extra pulmonary disease. Additional clinical characteristics of those with pulmonary TB are listed in Table 2. 28.6% (n = 1,208) of pulmonary TB patients were reported as "cavitary" on chest radiograph and almost half ( 49.8%, n = 2,1 03) had a positive sputum smear. The majority of pulmonary TB patients in the study cohort (70.0%, n = 2,953) were sputum culture positive forM tuberculosis.
Patient Mortality
Of the total study cohort, 3.4% (n=18l) died before initiation ofTB treatment (see Table 3). The remaining patients were started on antituberculous therapy but a total ofl0.8% (n=540) died before completion of therapy. 5.9% (n= 305) of those who started treatment died within the first eight weeks of treatment, while 4.9% (n=235) of those who survived the initial eight weeks of TB treatment subsequently died prior to treatment completion. 86.4% ( 4,590/5,311) of the original patients initiated and completed TB therapy.
Mortality Prior to Initiation of Treatment
significantly associated with death prior to starting antituberculous treatment (Tables 4-6).
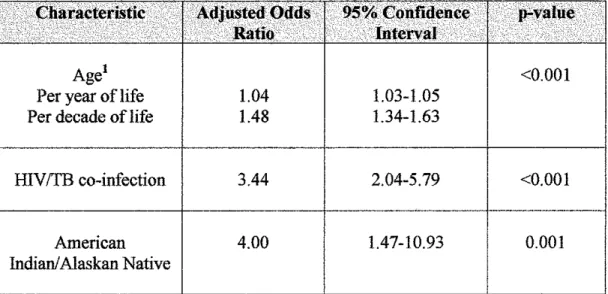
Once multivariate analyses were performed, increasing age, IDVITB co-infection and American Indian race were significant predictors of death in the time period prior to initiation of TB therapy (Table 7). For each decade increase in age, the mortality odds before TB treatment increased by 0.48 (age as a continuous variable, adjusted OR=l.48, 95%CI 1.34-1.63). Those with IDVITB co-infection had 3.44 times the odds of mortality prior to TB treatment (adjusted OR=3 .44, 05%CI 2.04-5.79) and compared to their white counterparts, those of American Indian or Alaskan Native race had 4.00 times the odds of dying before they start TB treatment (adjusted OR=4.0, 95%CI 1.47-10.93).
The multiple imputation procedure produced odds ratio estimates (see Table 9) of variables predicting death before treatment initiation similar to the estimates reported above.
Mortality in the Early Weeks of Treatment
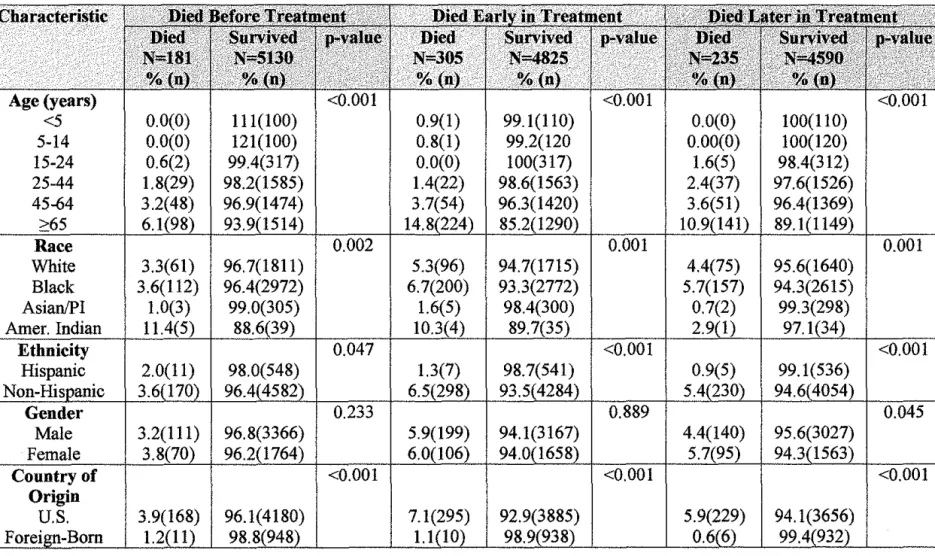
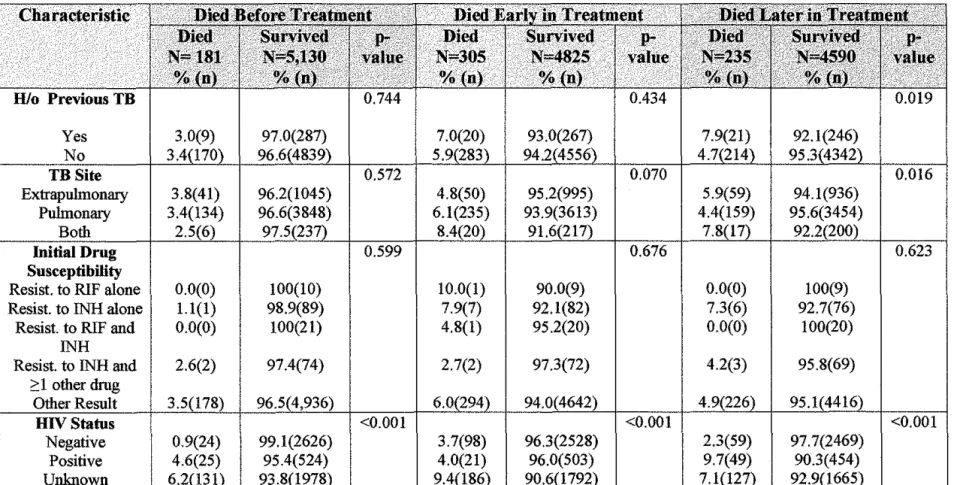
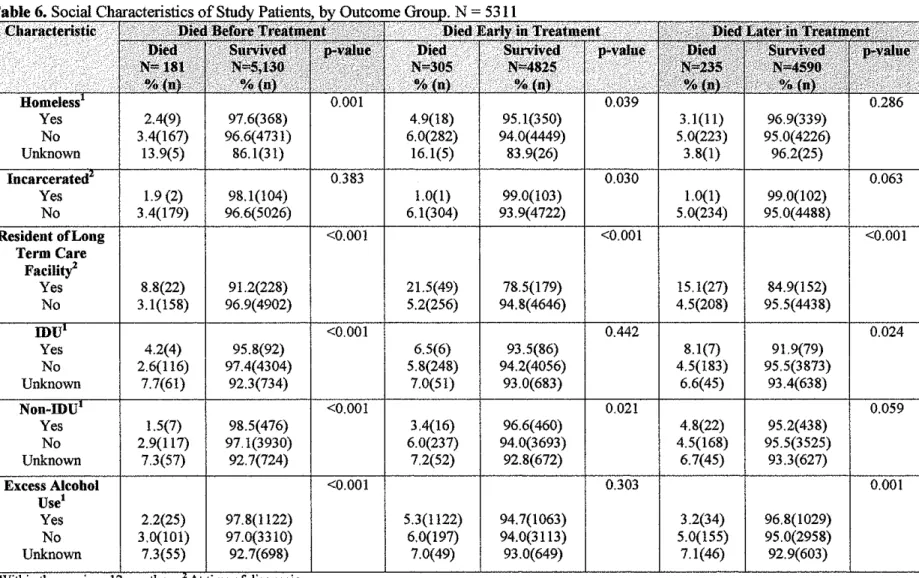
Bivariate analyses of patients who started TB therapy but died within the frrst eight weeks of treatment revealed that age, race, ethnicity, country of origin, HIV status, residency in a long term care facility, incarceration at time of diagnosis, homelessness, and non-IDU were significantly associated with death in these early weeks of treatment (Tables 4-6).
After Cox proportional hazards modeling, significant predictors of death in the initial eight weeks ofTB therapy were increasing age, being a U.S.-bom person of black race, history of excess alcohol use within the previous 12 months, and residency in a long-term care facility at the time of diagnosis (Table 8).
treatment (adjusted HR=l.70, 95%CI 1.23-2.34). HIV/TB co-infection
approaches statistical significance as a predictor of death within the frrst 8 weeks
ofTB therapy. Those who died in the early weeks ofTB treatment had 1.66 times
the risk of mortality when compared to those who did not have HIV/TB
co-infection (adjusted HR=1.66, 95%CI 0.99-2.76).
Variables that were not significant predictors of death in the multivariate model
were gender, Asian race, American Indian race, Hispanic ethnicity, prior TB
infection, history of homelessness, history of injection drug use, history of
non-injection drug use and incarceration at diagnosis. Of note, the following
subgroups had less than 20 (n < 20) patients who died early in treatment and thus results must be interpreted with caution: Asian race, American Indian race,
Hispanic ethnicity, history of homelessness, history of injection drug use, history
of non-injection drug use and incarceration at diagnosis.
The multiple imputation procedure produced hazards ratio estimates of the
variables that predicted death early in TB treatment (see Table 9) similar to the
estimates reported above.
Mortality in the Later Weeks of Treatment
Age, race, ethnicity, country of origin, gender, HIV status, history of previous TB,
TB disease site, residence in a long-term care facility, IDU and excess alcohol use
who were started on TB therapy but who subsequently died after eight weeks of treatment (see Tables 4-6).
Once Cox proportional hazards modeling was performed, only increasing age and HIV!fB co-infection predicted death in the later weeks ofTB therapy (see Table 8). With each decade increase in age, there was 0.63 times the mortality risk in the later weeks of treatment (age as a continuous variable, adjusted HR=l.63, 95%CI 1.48-1.79). HIV!TB co-infected subjects had 5.53 times the risk of mortality in the later weeks of treatment (adjusted HR=5.53, 95%CI 3.65-8.44).
The variables that did not significantly predict death in the later weeks in the multivariate model were black race, Asian race, American Indian race, Hispanic ethnicity, prior TB infection, history of homelessness, history of excess alcohol use, history of injection drug use, history of non-injection drug use, residency in a long term care facility at time of diagnosis and incarceration at diagnosis. The subgroups representing death later in treatment by Asian race, American Indian race, Hispanic ethnicity, history ofhomelessness, history of injection drug use and incarceration at diagnosis each had less than 20 (n < 20) patients, respectively. Therefore these results must be interpreted with caution.
DISCUSSION
This analysis goes beyond previous TB-mortality studies by examining mortality
risk factors relative to TB treatment, and examining the various patient
characteristics which may differentially affect dying prior to initiation of
treatment, dying early in treatment, and dying later in treatment. We found that
increasing age and HIV ffB co-infection are predictors of TB mortality at nearly
all points oftime relative to treatment. In addition, we found that being a person
of American Indian race specifically predicts death prior to TB treatment while
being a person of black race, being a resident of a long-term care facility or
having a history of excess alcohol use specifically predict death in the first eight
weeks of treatment. Other than increasing age and HIV!TB co-infection, no other
variables specifically predicted death in the later weeks of treatment.
With regard to the specific hypotheses postulated by this project, it was
hypothesized that environmental factors, or factors relating to the social
surroundings of the TB patient, would be significantly associated with overall
mortality; rates of TB and overall death are significantly higher in drug and
alcohol abusers than the general population[28]. Though we found that residents
of long-term care facilities and those with excess alcohol use experienced
significantly higher mortality in the early weeks of treatment, these associations
were not observed in the time period before treatment initiation or beyond the first
few weeks of treatment. There was no association between any specific social
mortality in our study cohort. However, it is worth nothing that HIV/TB
co-infection has been treated thus far as a clinical characteristic in this study. The
argument could be made though, that as HIV continues to disproportionately
affect young, impoverished and frequently minority adults, HIV /TB co-infection
is indeed as much related to the social enviromnent of a patient as it is related to
the clinical picture of the patient. Harries et a!. suggests that the social, cultural
and economic issues of poverty, sexual activity, illiteracy and stigma affect the
access to care, diagnosis and delivery of care to HIV /TB co-infected patients[28].
If thus treated as a social characteristic of a patient, then our results support
HIV /TB co-infection as an enviromnental factor that is significantly associated
with overall mortality in TB patients.
Another postulated hypothesis was that patients under age 5 and over age 65
would be more likely to die early in treatment than patients aged 5-64. Indeed, we
found that increasing age is significantly associated with increased mortality in
every phase studied. The overall decreased survival associated with increasing
age that we observed in this cohort confirms previously cited studies that also
associated increased age with increased mortality [5-7, 16, 17]. This age group's
association with increased TB mortality, both in the early treatment weeks and
overall, may be due to TB disease itself, due to confounding medical
co-morbidities that we were unable to explore in our database, or simply due to the
overall frailty of old age. Regarding patients under age 5, only one patient (0.9%)
who died within this age group in fact died within the first 8 weeks ofTB therapy,
no association could be found between young age and decreased survival in the
early part of treatment as there were too few cases to draw conclusions. Thus, we
reject the hypothesis that patients under age 5 are more likely to die early in
treatment but accept the hypothesis that older patients are more likely to die in the
fust few weeks of treatment.
It was also postulated that patients with a history of homelessness and/or alcohol
abuse would have higher rates of death prior to starting TB therapy than those
without history of homelessness or alcohol abuse. We were not able to show a
significant association between these factors and increased mortality before
initiation of treatment in our multivariate analyses and reject the postulated
hypothesis. However, it is notable that these subgroups were small and hence
these negative results may be due to underpowered subgroup analyses.
Similarly, we hypothesized that homeless TB patients would have decreased
survival in the later weeks of TB treatment, under the assumption that such
patients would be lost to follow-up or would not be able to comply with the
lengthy and complicated treatment regimen. According to Lobato et a!., only 26%
of homeless patients completed INH treatment for latent TB infection[29]. Given
this low treatment completion rate, we predicted that patients with history of
homelessness would have increased mortality in the late weeks of treatment.
homelessness in those who died late in TB treatment in our cohort. This may be
because the number of homeless patients who died late in treatment was small
(n=ll ), making it difficult to draw conclusions. Future studies with adequate
statistical power should reexamine the hypothesis that patients with history of
homelessness will have increased mortality in the later weeks of treatment.
As we examine the results of our analyses, certain themes emerge. One recurring
motif is increased mortality in social groups traditionally disenfranchised from
U.S. society: the elderly, the physically and mentally frail who occupy our
long-term care facilities, American Indians, blacks, alcoholics and the HIV-infected.
The increased TB death in our senior citizens may be due to factors already
discussed previously, or they may be partially attributed to the social isolation that
faces many of the elderly in America. Studies on the health effects of social
isolation on the elderly have reported that pre-stroke social isolation predicted
poorer post-stroke outcomes like myocardial infarct[30] and that advanced age
and living alone are associated with heat-wave related death[31]. Elderly who live
alone may experience delayed TB detection and diagnoses and hence increased
disease severity by the time of diagnosis and treatment. In addition, though we
were unable to fmd an association between TB mortality and the youngest
patients in our study cohort, the low mortality observed in this age group could be
because pediatric TB cases often go undiagnosed. Patients under age 5 may not be
captured by public health surveillance, as TB in children can often present with
disproportionate proportion of pediatric TB cases are found in Hispanic,
non-Hispanic Black and foreign-born children. These populations may be beyond the
reach of the U.S. health system either from lack of access or fear of immigration
services, and thus go undetected by standard TB surveillance. It is unclear if the
lack of deaths in our young TB patients may be confounded by these complex
social issues or in fact simply due to a very low mortality rate within this age
group.
Race also plays an interesting role as a predictor of death in TB patients, as our
analyses showed that being an American Indian or Alaskan native predicted
decreased survival prior to initiation of treatment while being black predicted
decreased survival in the early weeks of treatment. American Indians and Alaskan
natives, as a racial minority, have been significantly disempowered by U.S.
society. Those who live on Indian reservations live amidst poverty, low education,
high rates of drug abuse and overall poor health outcomes; a report from the
Indian Health Service showed that 31.6% of Indians residing in current
reservations were below the federal poverty level and only 8.9% were college
graduates, compared to 13.1% and 20.3%, respectively, of the overall U.S.
population [33]. Given such social conditions, it is likely that Native American
TB patients may not have the access to health care that would lead to prompt TB
diagnoses, and hence may die before they are even diagnosed. Additionally,
bureaucratic barriers between county-based public health and reservation-based
Indian race with mortality before TB treatment. To study this association further, we intend to geographically map the cases of Native American TB death in North Carolina to assess for clustering within specific counties and to try to correlate these clusters with proximity to county public health services.
health-seeking and treatment compliance in blacks with TB, barriers to TB guideline
adherence by providers who treat blacks with TB, interventions to overcome these
barriers and improve collaborations among TB programs, providers and
organizations serving black communities in the U.S.[3].
Though the trend of increased mortality in these disempowered social groups is
troubling, it also reveals one strong point of this study. In using the North
Carolina TB Control Program's RVCT-collected data, comprised of all TB
patients mandatorily reported to a state TB control program over an extended
period of time, this study population is likely comparable to the TB populations in
other states within the U.S. There is less concern for the effects of selection bias
introduced by a study cohort who, for instance, were enrolled in a specific clinical
trial, were actively recruited to join a study or even patients listed in a tumor
registry, who had enough access to health care to be evaluated for a malignancy.
Hence, our results may be more generalizable to other TB populations than
studies that derive their study populations in another manner or which specifically
focus on population subgroups, such as hospitalized, pediatric, homeless or
incarcerated TB patients.
Although the RVCT-collected data provides a broadly representative group for
study, there are flaws inherent with the database. One weakness of the database is
the proportion of missing data, particularly regarding social risk factors. For
unknown substance abuse behaviors. Though plausible that social factors such as homeless status could not be collected on individuals who died prior to starting treatment, especially if diagnoses occurred at autopsy or in other situations after death, the high proportion of social information not collected via the RVCT could also be due to lack of documentation in the medical record, patient failure to self-report, differences in the data collected because of a lack of standard defmitions, and differences in interpretation of medical records and patient report by health professionals across the state, over a ten year time period. Failure of the health care provider to query about these specific social history factors may also contribute to the missing data. For example, a study by Stout et a!. reports that despite recommended universal IDV testing for patients with TB, only 67% of TB patients from 1993 to 1999 were offered IDV testing in North Carolina [34]. We addressed our concern about the proportion of missing data with the use of multiple imputations of our multivariate models to determine the potential effect of the missing data on our results. We found that imputations of the missing data did not affect significant associations between certain patient characteristics and mortality relative to TB treatment.
exposure groups, and may preclude defmitive conclusions. Unfortunately, these
small sample sizes dominate several other exposure groups of interest as well,
such as injection and non-injection drug use, and incarceration. And though the
RVCT-collected data contains extensive information on patients' TB disease, like
drug susceptibility and sputum culture conversion, the TB surveillance does not
include data related to patients' socioeconomic status (SES), such as income or
SES proxies such as education level. The RVCT also does not collect data on TB
patients' co-morbid conditions, such as malignancy or malnourishment, which
may contribute to mortality in these patients.
With regard to future endeavors, we have analyzed risk factors for mortality
before TB treatment, during the first weeks and then the later weeks of TB
treatment thus far. We also intend to explore mortality after TB treatment
completion. We observed that 17.3% of our study cohort who survived TB
treatment subsequently died by December 31, 2003. This number was larger than
expected, and may be an important group to study, as becoming ill with active TB
may be a harbinger of declining health status. While TB may be diagnosed and
cured, people with a history of TB may have a higher mortality rate following
completion of TB treatment compared to a demographically matched population.
Furthermore, known sequelae of TB disease, such as bronchiectasis with recurrent
bacterial infection, may contribute to a decreased life span in patients who
complete TB treatment. Little research has been done to identity those who die
Future studies directed at mortality in patients who completed TB treatment may
provide insight into predictors of death in this population.
In summary, our study used a new paradigm in which to examine TB mortality by
examining death relative to TB treatment. We found that age and HIV!TB
co-infection are associated with increased mortality both before and during TB
treatment, and also found specific risk factors associated with dying prior to
starting treatment and dying in the early weeks of TB treatment. We hope that
these specific factors can be used to generate targeted public health efforts that
REFERENCES
1. Corbett, E.L., et al., The Growing Burden of Tuberculosis: Global Trends and Interactions with the HIV Epidemic. Arch Intern Med, 2003. 163: p. 1009-1021.
2. Country Profiles on Tuberculosis. WHO Global Tuberculosis Database. June 15, 2005 [cited 2005; Available from:
http:! /www. who .int/G lobalAt\as/PDFF acton· /TBiindex.asg.
3. Trends in Tuberculosis--United States, 2004. MMWRMorb Mortal Wkly Rep, 2005. 54(10): p. 245-9.
4. CDC., Reported Tuberculosis in the United States, 2003. September 2004, U.S. Department of Health and Human Services: Atlanta, GA.
5. Fielder, J.F., eta!., A High Tuberculosis Case-Fatality Rate in a Setting of Effective Tuberculosis Control: Implications for Acceptable Treatment Success Rates. Int J Tuberc Lung Dis, 2002. 6(12): p. 1114-1117.
6. Hansel, N.N., et al., Hospitalizations for tuberculosis in the United States in 2000: predictors of in-hospital mortality. Chest, 2004. 126(4): p. 1079-86.
7. Bustamante-Montes, L.P., et al., Predictors of Death From Pulmonary Tuberculosis: the Case of Veracruz, Mexico. Int J Tuberc Lung Dis, 2000. 4(3): p. 208-215.
8. Dewan, P.K., et ai., Risk factors for death during tuberculosis treatment in Ore!, Russia. Int J Tuberc Lung Dis, 2004. 8(5): p. 598-602.
9. Sacks, L.V. and S. Pendle, Factors related to in-hospital deaths in patients with tuberculosis. Arch Intern Med, 1998. 158(17): p. 1916-22.
10. Oursler, K.K., et al., Survival of patients with pulmonary tuberculosis: clinical and molecular epidemiological factors. Clinical Infectious Diseases, 2002.34: p. 752-759.
11. Garcia-Garcia Mde, L., et a!., Tuberculosis-related deaths within a well-functioning DOTS control program. Em erg Infect Dis, 2002. 8(11 ): p.
1327-33.
12. Alvarez, G.G., et ai., Tuberculosis at Edendale Hospital in
Pietermaritzburg, Kwazulu Natal, South Africa. Int J Tuberc Lung Dis, 2004. 8(12): p. 1472-8.
13. Pablos-Mendez, A., T.R. Sterling, and T.R. Frieden, The relationship between delayed or incomplete treatment and all-cause mortality in patients with TB. JAMA, 1996. 276(15): p. 1223-1228.
14. Archibald, L.K., eta!., Fatal Mycobacterium tuberculosis bloodstream infections in febrile hospitalized adults in Dares Salaam, Tanzania. Clinical Infectious Diseases, 1998. 26(2): p. 290-6.
15. Santha, T., eta!., Risk factors associated with default, failure and death among tuberculosis patients treated in a DOTS programme in Tiruvallur District, South India, 2000. Int J Tuberc Lung Dis, 2002. 6(9): p. 780-8. 16. Cayla, J.A., et al., Current status of treatment completion and fatality
17. Farah, M.G., et al., Treatment outcome of new culture positive pulmonary tuberculosis in Norway. BMC Public Health, 2005. 5(1): p. 14.
18. Walpola, H.C., et al., Tuberculosis-related deaths in Queensland,
Australia, 1989-1998: characteristics and risk factors. Int J Tuberc Lung Dis, 2003. 7(8): p. 742-50.
19. Racial Disparities in Tuberculosis--Selected Southeastern States, 1991-2002. MMWR Morb Mortal Wkly Rep, 2004. 53(25): p. 556-9.
20. A demographic and health snapshot of the U.S. Hispanic/Latina population. 2002, CDC, National Department of Health Statistics,
Department of Health and Human Services. p. 17.
21. Talbot, E.A., et al., Tuberculosis among foreign-born persons in the United States, 1993-1998. JAMA, 2000. 284(22): p. 2894-900.
22. Cowper, D.C., et al., A Primer and Comparative Review of Major U.S. Mortality Databases. Ann Epidemiol, 2002. 12: p. 462-468.
23. Stampfer, M.J., et al., Test of the National Death Index. Am J Epidemiol, 1984. 119(5): p. 837-839.
24. Fisher, S.G., et al., Mortality ascertainment in the veteran population: Alternatives to the National Death Index. Am J Epidemiol, 1995. 141(3): p. 242-250.
25. Yuan, Y.C., Multiple imputation for missing data: Concepts and new development, SAS Institute Inc., Rockville, MD.
26. Schafer, J.L., Multiple imputation: a primer. Statistical Methods in Medical Research, 1999.8: p. 3-15.
27. Schafer, J.L. and J.W. Graham, Missing data: Our view of the state of the art. Psychological Methods, 2002. 7(2): p. 147-177.
28. Harries, A.D., et al., Deaths from tuberculosis in sub-Saharan African countries with a high prevalence ofHJV-1. The Lancet, 2001. 357: p. 1519-1523.
29. Lobato, M.N., et al., Adverse Events and Treatment Completion for Latent Tuberculosis in Jail Inmates and Homeless Persons. Chest, 2005(127): p. 1296-1303.
30. Boden-Albala, B., et al., Social isolation and outcomes post stroke. Neurology, 2005. 64(1888-1892).
31. Naughton, M.P., et al., Heat-related mortality during a 1999 heat wave in Chicago. Am J Prev Med, 2002. 22(4): p. 221-227.
32. Feja, K. and L. Saiman, Tuberculosis in children. Clin Chest Med, 2005. 26: p. 295-312.
33. Trends in Indian Health 1998-99, Department of Health and Human Services and the Indian Health Service (IHS).
Appendix A: Studies that examined deaths prior to initiation ofTB treatment, and their respective fmdings.
Study Country Overall Total TB Death Prior to TB ·. Study Size Deaths Treatment
Farah eta!. Norway N=655 n=58
•
32.8% of total TB(2005) deaths
•
2.9% of total TB cases•
0.6% ofTB cases were diagnosed at autopsy;•
median age of those who died before TB treatment was 71 yearsGarcia- Mexico N=454 n=34
•
5.9% of total TB deathsGarcia et al.
•
0.4% of total TB cases(2002)
Walpolaet Australia N= 1083 n=87
•
37.9% of total TBa!. (2003) deaths
•
3.0% of total TB casesAppendix B. Link criteria applied to the results of the NDI query to distinguish correctly linked NDI/RVCT records from false or inaccurate links.
If the patient's SSN is available:
1) SSN, first name, last name, middle initial, DOB, gender, race and state of residency
2) first name, last name, middle initial, DOB, gender, race and SSN with either one incorrect digit or 2 consecutive incorrect digits
3) SSN, DOB, gender and race
4) SSN, first name, last name, day and/or month of birth and year of birth+/- 3 years
5) SSN, last name, day of birth, month of birth and year of birth +/-10 years.
If the SSN was not available and the subject's last name was not among the two hundred fifty most frequent U.S. last names/ then the following criteria were used:
1) first name, last name, middle initial, DOB, state of residence and gender 2) first name, last name, middle initial, DOB, gender and race
3) frrst name, last name, DOB, gender, and race
4) frrst initial, middle initial, last name, DOB and state of residence
5) fust name, New York State Identification and Intelligence System (NYSIIS)-coded last name, DOB, state of residence, gender and race
6) frrst name, last name, DOB +I- 1 year, state of residence, gender and race.
1
Appendix C. The demographic, clinical and social variables reported by the RVCT that were subsequently used in our analyses.
Demographic Age
Gender Race
Ethnic origin Country of origin Clinical
Major site ofTB infection Sputum smear results Sputum culture results Chest radiograph results HIV status
Initial drug susceptibility results Social
Excess alcohol use in preceding 12 months Homeless in preceding 12 months
Resident oflong-term care facility at diagnosis Incarceration at time of diagnosis
Table 1. Baseline characteristics of all TB patients captured by the NC TB Control Program from 1993-2003 N=5 311
' Age
<5 years old 2.1%(n= Ill)
5-14 years old 2.3% (n = 121)
15-24 years old 6.0% (n = 319)
25-44 years old 30.4%(n = 1,614)
45-64 years old 28.7% (n = 1,522)
>65 years old 30.6% (n = 1,624)
Gender
Female 34.5% (n = 1,834)
Race
White 35.2% (n = 1,871)
Black 58.9% (n = 3,128)
Asian/Pacific Islander 5.8% (n = 308)
American Indian/ Alaskan Native 0.8% (n=44)
Ethnicity
Hispanic 10.5% (n = 559)
Country of Origin
United States 81.9% (n = 4,348)
Previous Diagnosis of TB
Yes 5.6% (n = 296)
Disease Site
Pulmonary: 75.0% (n = 3,982)
Pulmonary and Extrapulmonary: 4.6% (n = 243)
Extrapulmonary Alone:
Lymphatic 5.2% (n = 278)
Miliary 2.2% (n = 119)
Pleural 5.4% (n = 286)
Bone/Joint 2.4% (n=l26)
Other1 5.2% (n = 277)
HIVStatus
Positive 10.3% (n = 549)
Negative 49.9% (n=2,650)
Status Unkoown 39.7% (~ = 2,109)
Resident of Corredional Facility at Time of TB Diagnosis
Yes 2.0% (n = I 06)
Resident of Long Term Care Facility at Time of TB Diagnosis
Yes 4.7% (n = 250)
Homeless Within Past Year
Yes 7.1%(n=377)
Injection Drug Use (IDU) Within Past Year
Yes 1.8%(n=96)
No 83.2% (n = 4,420)
Unkoown 15.0%(n = 795).
Non-injection Drug Use Within Past Year
Yes 9.1% (n = 483)
No 76.2% (n = 4,047)
Unkoown 14.7% (n = 781)
Excess Alcohol Use Within Past Year
Yes 21.6% (n = 1,147)
No 64.2% (n = 3,411)
Unkoown 14.2%-(n = 753)
Table 2. Disease-related characteristics Of pulmonary TB patients.* N- 4225
Chest Radiograph Result
Abnormal 97.0% (n = 4,099)
Chest Radiograph Impression
Cavitary 28.6% (n = 1,208)
Radiograph suggestive ofTB, without cavitation 65.9% (n = 2,687) Radiograph not suggestive ofTB, without cavitation 4.5% (n = 185)
Sputum Smear Result
Positive 49.8% (n = 2,103)
Negative 35.1% (n = 1,482)
Sputum Smear Not Done 15.1%(n=636)
Sputum Culture Result
Positive 70.0% (n = 2,953)
Negative 14.8% (n = 624)
Sputum Culture Not Done 15.2% (n = 639)
Of all patients. N - 5311
Initial Organism Drug Susceptibility
Resistant to INH alone 1.7% (n=90)
Resistant to INH and to '-=:1 drug other than Rifampin 1.4% (n=76) Resistant to Rifampin and INH 0.4%(n=21) Resistant to Rifampin alone 0.2%(n= 10)
Other Result 96.3% (n = 5114)
Table 3. Frequency ofTB death, at different times relative to treatment.
'.
.Time of Death No. Died/ No. Surviving Mortality
! Up to the Specified Frequency
Time of Death .(%)
. · .· . . .
Prior to initiation of treatment 181 I 5,311 3.41
Early during treatment 305 I 5,130 5.95 (InitialS weeks of treatment)
Later during treatment 235 I 4,825 4.87 (After the first 8 weeks of treatment)
After treatment completion* 793 I 4,590 17.28
Table 4. Demographic Characteristics of Study Patients, by Outcome Group. N = 5311
Age (years)
<5 0.0(0) 111(100) 0.9(1) 99.1(110) 0.0(0) 100(110)
5-14 0.0(0) 121(100) 0.8(1) 99.2(120 0.00(0) 100(120)
15-24 0.6(2) 99.4(317) 0.0(0) 100(317) 1.6(5) 98.4(312)
25-44 1.8(29) 98.2(1585) 1.4(22) 98.6(1563) 2.4(37) 97.6(1526) 45-64 3.2(48) 96.9(1474) 3.7(54) 96.3(1420) 3.6(51) 96.4(1369)
141
'
Race 0.002 0.001 1 o.oo1
White 3.3(61) 96.7(1811) 5.3(96) 94.7(1715) 4.4(75) 95.6(1640) Black 3.6(112) 96.4(2972) 6.7(200) 93.3(2772) 5.7(157) 94.3(2615)
Asian/PI 1.0(3) 99.0(305) 1.6(5) 98.4(300) 0.7(2) 99.3(298)
Amer. Indian 11.4(5) 88.6(39) 10.3(4) 89.7(35) 2.9(1) 97.
Ethnicity 0.047
Hispanic 2.0(11) 98.0(548)
I
1.3(7)I
98.7(541)I
I
0.9(5) 1 99.1(536)3. Gender
Male Female
Country of
I
I
I
<o.oo1 Originu.s.
I
3.9(168)I
96.1(4180)I
I
7.1(295)I
92.9(3885)I
I
5.9(229)I
94.1(3656)1.2(11) 98.8(948) 1.1(10) 98.9(938) 0.
Table 5. Clinical Characteristics of Study Patients, by Outcome Group. N = 5311
TB
Yes lo TB Site
Extrapulmonary 3.8(41) 96.2(1045) 4.8(50) 95.2(995)
I
I
5.9(59)Pulmonary 3.4(134) 96.6(3848) 6.1(235) 93.9(3613)
Both 2.5(6) 97.5(237) 8.4(20) 9
Initial Drug 0.599 I 0.676 I I I 0.623
Susceptibility
Resist. to RIF alone 0.0(0) 100(10) 10.0(1) 90.0(9) 0.0(0) 100(9)
Resist. to INH alone 1.1(1) 98.9(89) 7.9(7) 92.1(82) 7.3(6) 92.7(76)
Resist. to RIF and 0.0(0) 100(21) 4.8(1) 95.2(20) 0.0(0) 100(20)
INH
Resist. to INH and
I
2.6(2)I
97.4(74)I
I
2.7(2)I
97.3(72)I
I
4.2(3)I
95.8(69)?: 1 other drug
Other Result 3
HIVStatus <0.001 <0.001 1 <o.oo1
Negative 0.9(24) 99.1(2626) 3.7(98) 96.3(2528) 2.3(59) 97.7(2469)
Positive 4.6(25) 95.4(524) 4.0(21) 96.0(503) 9.7(49) 90.3(454)
93.8(1978) 9.4(186) 90.6(1792) 7.
Table 6.
Yes 2.4(9) 97.6(368) 4.9(18) 95.1(350) 3.1(11) 96.9(339)
No 3.4(167) 96.6(4731) 6.0(282) 94.0(4449) 5.0(223) 95.0(4226)
Unknown 13.9(5) 86.1(31) 16.1(5) 83.9(26) 3.8(1) 96.2(25)
0.383 0.030
Yes 1.9 (2) 98.1(104) 1.0(1) 99.0(103) 1.0(1) 99.0(102)
No 3.4(179) 96.6(5026) 6.1(304) 93.9(4722) 5.0(234) 95.0(4488)
Resident ofLong <0.001 <0.001 I <0.001
Term Care Facility'
Yes
I
8.8(22) 91.2(228) 21.5(49) 78.5(179) 15.1(27) 84.9(152)
No 3.1(158) 96.9(4902) 5.2(256) 94.8(4646) 4.5(208) 95.5(4438)
<0.001 0.442
I
0.024Yes 4.2(4) 95.8(92) 6.5(6) 93.5(86) 8.1(7) 91.9(79)
No 2.6(116) 97.4(4304) 5.8(248) 94.2(4056) 4.5(183) 95.5(3873)
Unknown 7.7(61) 92.3(734) 7.0(51) 93.0(683) 6.6(45) 93.4(638)
<0.001 0.021
Yes 1.5(7) 98.5(476) 3.4(16) 96.6(460) 4.8(22) 95.2(438)
No 2.9(117) 97.1(3930) 6.0(237) 94.0(3693) 4.5(168) 95.5(3525)
Unknown 7.3(57) 92.7(724) 7.2(52) 92.8(672) 6.7(45) 93.3(627)
Excess Alcohol <0.001 0.303 I o.oo1
Use'
Yes 2.2(25) 97.8(1122) 5.3(1122) 94.7(1063) 3.2(34) 96.8(1029)
No 3.0(101) 97.0(3310) 6.0(197) 94.0(3113) 5.0(155) 95.0(2958)
Table 7. Mortality before initiation ofTB treatment; statistically significant results from multivariate logistic regression modeling.
Age1 Per year of life Per decade of life
IDVrrB co-infection
American Indian/Alaskan Native
1.04 1.48
3.44
4.00
1
Analyzed as a continuous variable
1.03-1.05 1.34-1.63
2.04-5.79
1.47-10.93
<0.001
<0.001
Table 8. Mortality early in TB treatment and mortality later in TB treatment; significant results from extended Cox Proportional Hazards modeling.
Age1 <0.001 <0.001
Per year of life 1.06 1.05-l.o? 1.05 1.04-1.06 Per decade of 1.79 1.63-1.97 1.63 1.48-1.79
life
Black race 1.35 1.05-1.75 0.021
**
**
**
HIV/TB co-infection
1.66 0.99-2.76 0.053 5.53 3.65-8.44 <0.001
Excess Alcohol Use2
Resident of Long Term Care Facility3
1.68 1.17-2.41 0.005
1.70 1.23-2.34 0.001
1
Analyzed as a continuous variable
2
Within the previous 12 months
3
At time of diagnosis
**Not significant in the model
**
** **Table 9. Mortality before and during TB treatment. Results of the multiple imputations• of the multivariate logistic regression modelb and the extended Cox Pro rtional Hazards models< to account for missin data.
,~ti~Jrii!~~r~~~i';' Dietl Before Treatment ··· '" ' ?. 'lii~!f Eiitl;IJi'.'J:'Jiellili!.~t;c£'
i'···'' · ··· ··· ···
Died J.,at~r.ill Tt'\l~ili· · :•,;:::; ·' lmnuted ... ·~-.~ · 95%: 1 :·· . I n. / .. 'i""··= ... ... ''"'•'"'"9.56" ' ' ' " ' '"'•"''
>'iil"j
•=
·t .d· 95°' ·p-va ue ;) ~~'!·~
.'
·>.' : ·".~ij" , •;•'lti"'
unplJ e . . .... , .r• ., .. · .... ·· · ....
-c-·
~:::
I
c==~=:e
. .
~·:~~~~~(! ~;~r:~;~ Ci~[~~ii! ~:~d c=~~=r
Age1 HIV/TB co-infection Black race American Indian/ Alaskan Native Excess Alcohol Use2 Resident ofLong Term Care Faci!itl 1.04 3.53
••
3.81••
••
j inJI'lC:CUIV~-. >JIUUJJH.iUt .1'1f#WtJ 1
Analyzed as a continuous variable
1.03-1.05 <0.001 1.05 1.05-1.06
2.16-5.77 <0.001 1.28 0.84-1.94
**
**
1.34 1.04-1.721.38-10.56 0.010
**
**••
••
1.48 1.02-2.15••
••
1.68 1.21-2.32o Used in analysis of "Died Before Treatment" -= Used in
'Within the previous 12 months 3 At time of diagnosis
<0.001 1.05 1.04-1.06
0.244 2.98 1.71-5.20
0.025 ** **
••
**
••
0.039
••
**0.002
••
••
s of"' Died Early in Treatment" and • • Not significant in the model