Quality Improvement for Diabetes Care
Improving Diabetes Care through a Multi-tiered
Quality Improvement Model
John Guzek1,4, Suzanne Guzek2, Karen Murphy4, Patricia Gallacher3,Cheryll Lesneski4
From the Commonwealth Medical College1, Walden University2, and Section of Informatics3 and Administration4, Physicians Health Alliance, Scranton, PA, and the University of North Carolina-Chapel Hill4
Word count: 2, 970
Running head: Quality Improvement for Diabetes Care
Address correspondence to: John Guzek, M.D., M.P.H Director of Medical Informatics Scranton-Temple Residency Program 640 Madison Avenue
Scranton, PA 18510 Tel: (570) 348-7170 Fax: (570) 344-1226
Disclosure of Potential Conflict of Interest
All investigators in the study do hereby disclose that we have no potential conflict and/or competing interest we or our dependents (spouse, dependent children, or others claimed as dependents) may have with any organization with commercial, proprietary, or political interests relevant to the topics covered by this proposal.
ABSTRACT
CONTEXT: We report the results of implementing a diabetes mellitus guideline in a group
practice in which uniform technology-generated care processes were produced for patients,
clinical staff, and providers. OBJECTIVE: To increase the annual rate of recommended tests and
examinations for patients with diabetes and to reduce levels of HgA1c, blood pressure, and LDL
cholesterol. INTERVENTION: A process change for type 2 diabetes mellitus was implemented.
This included changes in office visit structure; protocol-driven electronic prompts for nursing
and physician staffs; clinical decision support built into a new EMR form; and audit with
feedback. PARTICIPANTS: 12 primary care physicians treating a total of 1592 patients with
diabetes by January, 2008. RESULTS: Prompt and statistically significant improvements in five
process measures and 2 outcome measures; 8% overall improvement in a quality summary
measure. CONCLUSIONS: Statistically significant improvements with moderate effect size
INTRODUCTION
Although advances in diabetes treatment in the last part of the 20th century have resulted in impressive reductions in morbidity1 and mortality,2 it is widely recognized that diabetes
management by primary care physicians in the US is less than optimal.3 A variety of tools
promote adoption of clinical practice guidelines, including those formulated by the American
Diabetes Association. These tools include telephone reminders,4flowsheets,5computer-based
protocols,6-9 and continuous quality improvement (CQI) methods based on best practice.10
However, application of these tools individually to improve diabetes care has produced
inconsistent results.
The deficiencies in diabetic care are reflective of the relatively slow progression in
quality improvement in the physician office setting. Audet et al.11 conducted a national physician
survey and found that most physicians do not implement formal quality measurement and
improvement methods in their practices. In addition, only one third of physician respondents
indicated that they participated in office redesign for quality improvement.11 Though physician
offices offer significant opportunities for impacting the cost and quality of health care, their
diversity in type, size, and organizational structure renders the development of standard
approaches to quality improvement difficult.12
The Institute of Medicine (IOM) recommends system re-design as the essential first step toward improving chronic disease quality measures. They suggest that “carefully designed
evidence-based care processes, supported by automated clinical information and decision support
systems, offer the greatest promise of achieving the best outcomes.”13 However, the IOM makes
effective teams, and the need for improved technology to automatically gather, analyze, and
present clinical information for patients and team members alike.
We asked the research question: Can a multi-tiered intervention that includes quality
improvement and automatic computer-based protocols facilitate positive changes in diabetes care
delivery? We performed a case study of diabetes care process change in a community practice
under the guidance of a Quality Committee (QC) with Physicians Health Alliance (PHA), a
community group practice of primary care physicians in northeast Pennsylvania.
METHODS
The study entailed a quality improvement process in a medium-sized community group
practice in which 12 clinicians had been using an electronic medical record (Centricity®
Office-GE) for several years. The study took place in 2007. Initial efforts focused on creating and
authenticating a diabetes registry and observing the effect of this validating effort on diabetes
process measures. Inclusion criteria on the registries were all active patients at least 18 years of
age with a diagnosis of diabetes mellitus. An active patient was defined as one having an ICD-9
code on the active problem list identifying the patient as diabetic with a progress note in the
EMR associated with an office visit within the prior 12 months. Coding criteria were selected
according to standards established by the National Committee for Quality Assurance.14 In an
effort to ensure accuracy of the registries, physicians and their clinical support staff were
presented with a report of patients who had a diagnosis of diabetes on the problem list. Patients
misidentified on these reports were removed from the diabetes registry.
At the study onset, we sought buy-in from clinicians by demonstrating to the group
was urgently needed. Each provider agreed to a goal of achieving the targets set by the National
Committee for Quality Assurance (NCQA) for diabetes care within 6 months. The subsequent
implementation process included four steps: (1) collection of baseline measures of diabetes care
performance; (2) identification and selection of clinical tools that facilitated systematic task
completion through visit redesign, EMR prompts, electronic clinical decision support, tailored
handouts to encourage patient self-management, and a simplified referral process for diabetic
education; (3) a physician education plan; and (4) measurement of the impact with feedback to
clinicians.
QC was comprised of representatives of the information technology department, the
administration, providers, and clinical staff of PHA. Various tools that altered the diabetic care
process were created. We worked as a QC to develop a multi-tiered process change based on
local best practice and consensus. Specifically, protocol-based computer prompts directed to
nursing staff and clinicians served to redesign the office visit. Nursing staff was requested to
document patients‟ recent eye exam or to refer them for dilated exam; to collect urine specimens;
and to request removal of patient footwear in preparation for provider exam. For patients with
poorly controlled hypertension, pop-up dialog boxes prompted clinicians to consider addition of thiazide medication or to navigate to the patient‟s medication list. Paper-based prompts
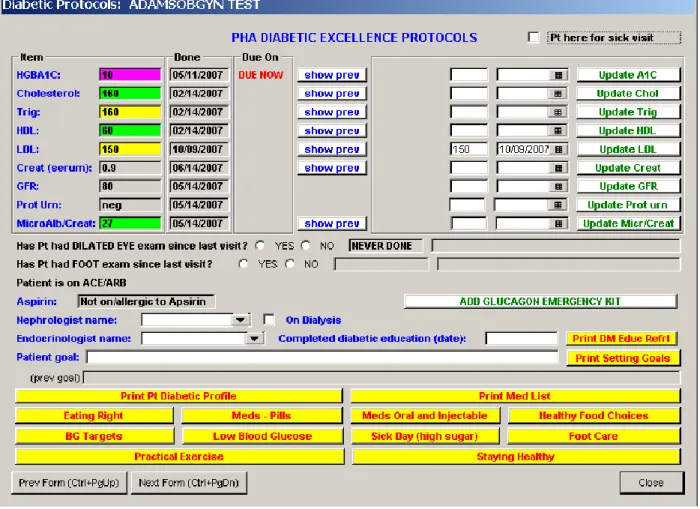
suggested diabetes education referral when appropriate. Glycemic control and lipid management
support were provided through color-coded conditional formatting of patient data on a newly created “Diabetic Excellence Protocols” form (Figure 1). This form, designed to load
automatically at the start of each visit, included single mouse-click „action buttons‟ for easy
printing of medication lists, diabetes education topics, and consultation requests for diabetes
methods. First, a diabetic handout with tailored patient-specific information and
recommendations printed automatically at visit outset when lab data was current. This handout
provided clinicians an opportunity to highlight areas of shared concern. Second, clinicians were
prompted to refer for formal diabetes education when documentation of such education was
lacking. Furthermore, the referral process itself was streamlined so that a single click on the
Diabetic Excellence Protocols form printed a referral sheet that was faxed to diabetes educators.
Finally, action buttons on this form allowed immediate printing of handouts on a variety of
self-management topics. This allowed clinicians to provide written material to patients reinforcing
messages delivered during the visit.
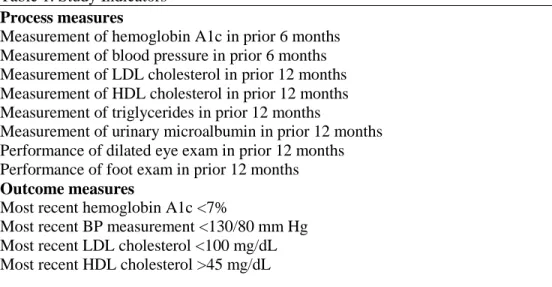
The study indicators, listed in Table 1, were based on recommendations of the American
Diabetes Association3 and others.15, 16 Eight indicators were process measures, reflecting whether recommended tests were performed. Four were outcome measures, reflecting whether
patients achieved recommended treatment goals. A summary measure termed the diabetes
summary index was calculated as the mean of the 12 measures. For the primary analyses (Table
3), we calculated practice-level performance for each measure at baseline and follow-up and
compared changes by paired t tests.
Each month beginning in March, 2007, the authors sent practice level reports of study
indicators7 to all practices. SAS-Enterprise Guide 4.1 (SAS-EG) was utilized to extract patient
activity during the previous month. To protect patient confidentiality, the research was
performed using only the unique, anonymous numerical identifier for each patient. SAS-EG
extracted demographic information such as age, race, gender, diagnoses, medication, laboratory
was not extracted. Provider reports used conditional formatting to illustrate for each clinician
his/her performance in comparison to the anonymous data of other individual clinicians.
Educational Process
In June, 2007, clinicians were provided with educational material and asked to complete
a self-study course developed by American College of Physicians.17 In early July, 2007
implementation meetings were held. All clinicians attended one of the meetings. Two major
activities occurred at these meetings. The first activity was demonstration of the redesigned
diabetes visit as envisioned by Quality Committee. The second activity was demonstration of
the technique of motivational interviewing delivered by a local expert in this technique.
Measurements
Major outcomes used in the analyses were expressed at the practice level. For each
practice, 12 proportions were calculated that corresponded to the 12 study indicators (Table 1).
For each study indicator, the proportion corresponded to the percentage of diabetes patients in that practice who had met that study indicator‟s target. In addition to the 12 specific study
indicator outcomes, a summary measure was constructed for each practice. This summary
measure, which we termed the diabetes summary index, reflected the average percentage of the
12 targets met by patients in that practice.
Six clinics comprised of 12 physicians were included in the analyses. Two were family
medicine physicians, and 10 were internal medicine physicians. These practices had 24,650
active patients at least 18 years of age on January 1, 2007, 1250 (5.0%) of whom had a diagnosis
1592 (6.5%) of whom had a diagnosis of diabetes mellitus. The average age of the diabetes
patients on January 1, 2007 was 67.7 years (SD = 13.9), and 46.8% of were male.
RESULTS
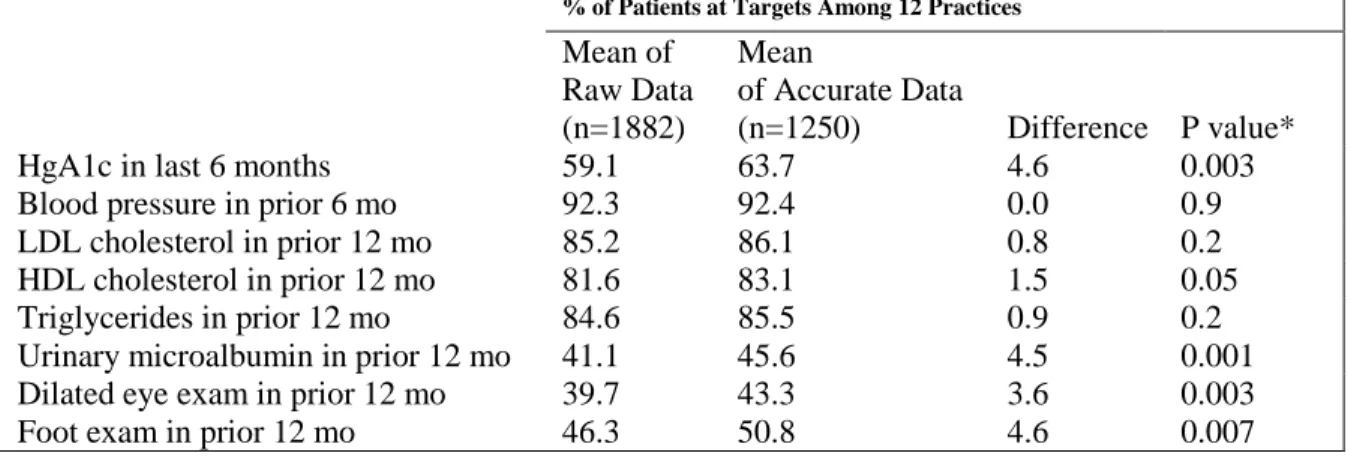
At project outset, initial queries on the patients‟ problem lists revealed that 869 of 1951 „diabetic‟ patients were not taking diabetes medications. Although 327 of the patients not on
diabetes medications were considered by the primary physician as „diet stage‟ diabetics, 532
were found to have been misidentified. The problem was dated from the purchase of the group‟s
EMR system. Early versions of the software allowed use of a „Family Hx‟ modifier using
ICD-250.* instead of the correct V18.0 code. We calculated the „improvement‟ of process measures
which could be noted merely by correcting this particular inaccuracy in the diabetes registry
(Table 2).
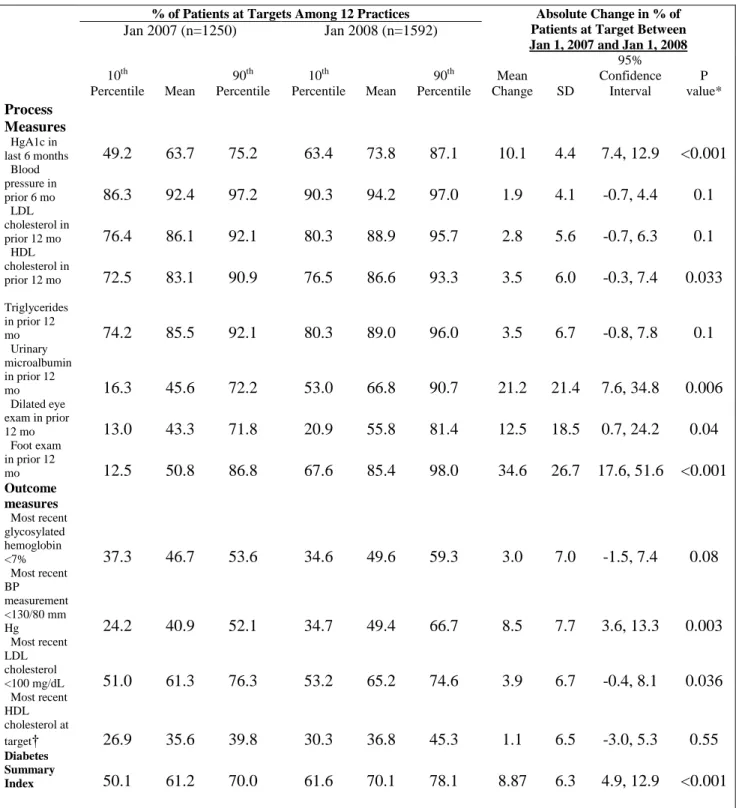
Changes in Performance of Study Indicators
The average diabetes summary score was 61.2% on January 1, 2007 (10th percentile
50.1%, 90th percentile 70.0%). On January 1, 2008, the average diabetes summary score was
70.1% (10th percentile 61.6%, 90th percentile 78.1%). The 12-month improvement in the mean
diabetes summary score was 8.87% [95% confidence intervals (CI), 4.9%, 12.9%]. Statistically
significant improvement occurred for 5 of 8 process measures and for 2 outcome measures (see
Table 5). One outcome showed a trend toward improvement. All other outcomes showed
insignificant improvement. Ranked by effect size, the greatest statistically significant
improvements (more than 10%) occurred in documentation of foot exams and urinary
DISCUSSION
Tai18 noted the importance of assuring an accurate database prior to initiating data
collection in CQI efforts. Our data supports his findings. Registry clean-up is a vital first step
that must occur prior to baseline data collection.
The findings presented in this report suggest that community group practices utilizing
EMRs that are customizable and reportable may be able to successfully employ quality
improvement methods, built-in protocols, and advanced clinical decision support to redesign
health care processes. Furthermore, when these methods are used in the setting of shared goals,
very rapid rates of improvement of quality measures may result. Previously published
interventions19, 20 have required 18 months at the minimum, and as long as 5 years generally, to
demonstrate as much as an 8% overall improvement in quality measures. Our intervention
yielded a similar level of improvement in 12 months. The improvements occurred across a
spectrum of indicators. Performance improved for practices performing at a range of levels at
baseline, and there were comparable increases in the mean, 10th percentile, and 90th percentile
measure of the diabetes summary index.
The foundation of our process redesign was an electronic form that loaded automatically
at the start of each visit. Schnipper21 has noted that electronic forms as a part of clinical decision
support systems have had limited effectiveness for a variety of reasons including lack of
integration into workflow, software usability issues, and relevance of the content to the patient at
hand. Our form was carefully designed by the PHA Centricity project manager who had special
a fully integrated form with robust clinical decision support. The staff has reported no issues
with form usability.
A prominent feature of our intervention was provider-level reports allowing anonymous
peer comparison. Unlike manual chart audits, the reports provided in this project were highly
automated, involving a few minutes of practice staff time each month. Tangible benefits in our
case included recognition status on the NCQA website. As practice-level implementation
progressed and audit-feedback occurred, most practices found that the effort required an
increased frequency of visits for patients with diabetes, enabling more consistent monitoring of
the applicable indicators.
We found that that robust improvement in quality measures can occur in very short time
periods when clinicians are motivated by a common goal, when quality is built into the
encounter, and when regular audit and feedback are provided.
There are three important limitations of the present report. First, there was no comparison
group, and it is not possible to be certain that the improvements noted among the 12 practices
were due to the study interventions and not merely to changes which would have occurred
independently without the process change. Although diabetes care continues to improve in the
US,22 the magnitude of the observed benefits makes it unlikely that the improvement in this
study was entirely due to external factors . The 2005 National Healthcare Quality Report
(NHQR) documented a median 1-year improvement of only 2.8% in overall care quality,
approximately one third of the annualized improvement in our diabetes summary index.22
Also, it is impossible to ascertain whether the increased motivation due to shared goal setting or
external factors was most responsible for the improvements noted. Second, our results may not
have implemented a fully-functional EMR in 2001. DesRoches23 notes that only 4% of US
practices have such an extensive fully functional electronic record systems capable of providing “reminders regarding guideline-based interventions.” Our group‟s well-developed local
programming expertise allowed PHA to develop an Excellence in Diabetes Care form that
automatically presented to clinicians such reminders „en bloc‟ for each diabetic at visit start. A
third limitation is that the indicators included in this study reflect only a subset of guidelines for
management of diabetes care. Other important indicators, such as provision of antiplatelet
therapy, recommended immunizations, and nutrition/physical activity counseling were not
assessed.
CONCLUSION
It is likely that the performance of practices in this study is much better than national
averages. The 2005 NHQR indicated that among patients with diabetes, 70.9% have blood
pressure values less than 140/90 mm Hg.22 In our study, 72% of patients had blood pressure
values less than 140/80 mm Hg at study start, and 76% at completion of the study. Similarly, the
NHQR reported performance of foot exam in 72% of patients with diabetes in contrast with the
85% in our study, and that glycosylated hemoglobin was less than 7% in 39.8% of patients with
diabetes, whereas our practices achieved this target in 50% of patients. These findings suggest
that quality improvement programs for practices which have good EMR capacity can allow care
REFERENCES
1. Moss SE, Klein R, Klein BE. The 14-year incidence of visual loss in a diabetic population.
Ophthalmology. 1998;105(6):998-1003.
2. Gregg EW, Gu Q, Cheng YJ, Narayan KM, Cowie CC. Mortality trends in men and women
with diabetes, 1971 to 2000. Ann Intern Med. 2007;147(3):149-155.
3. American Diabetes Association. Standards of medical care in diabetes--2007. Diabetes Care.
2007;30 Suppl 1:S4-S41.
4. Orr PM, McGinnis MA, Hudson LR, et al. A focused telephonic nursing intervention delivers
improved adherence to A1c testing. Dis Manag. 2006;9(5):277-283.
5. Schmidt SO, Burns C, Feller DB, et al. Evaluation of a quality improvement intervention for
diabetes management. J Healthc Qual. 2003;25(3):26-32.
6. Orzano AJ, Strickland PO, Tallia AF, et al. Improving outcomes for high-risk diabetics using
information systems. J Am Board Fam Med. 2007;20(3):245-251.
7. NCQA. Acknowledging Outstanding Performance: Diabetes Physician Recognition Program. .
http://web.ncqa.org/LinkClick.aspx?fileticket=JXm2ViUPgog%3d&tabid=139&mid=860&force
download=true. Accessed January 5, 2008.
8. O'Connor PJ, Crain AL, Rush WA, Sperl-Hillen JM, Gutenkauf JJ, Duncan JE. Impact of an
9. Crosson JC, Ohman-Strickland PA, Hahn KA, et al. Electronic medical records and diabetes
quality of care: Results from a sample of family medicine practices. Ann Fam Med.
2007;5(3):209-215.
10. O'Connor PJ, Desai J, Solberg LI, et al. Randomized trial of quality improvement
intervention to improve diabetes care in primary care settings. Diabetes Care.
2005;28(8):1890-1897.
11. Audet AM, Doty MM, Shamasdin J, Schoenbaum SC. Measure, learn, and improve:
Physicians' involvement in quality improvement. Health Aff (Millwood). 2005;24(3):843-853.
12. Town R, Wholey DR, Kralewski J, Dowd B. Assessing the influence of incentives on
physicians and medical groups. Med Care Res Rev. 2004;61(3 Suppl):80S-118S.
13. Institute of Medicine. Crossing the Quality Chasm: A New Health System for the 21st
Century. Washington, DC: National Academy of Sciences; 2001.
14. National Committee for Quality Assurance. NCQA Diabetes Physician Recognition
Program. . http://www.ncqa.org/tabid/139/Default.aspx. Updated 2008. Accessed July 28, 2008.
15. Chobanian AV, Bakris GL, Black HR, et al. The seventh report of the joint national
committee on prevention, detection, evaluation, and treatment of high blood pressure: The JNC 7
report. JAMA. 2003;289(19):2560-2572.
16. National Cholesterol Education Program (NCEP) Expert Panel on Detection, Evaluation, and
national cholesterol education program (NCEP) expert panel on detection, evaluation, and
treatment of high blood cholesterol in adults (adult treatment panel III) final report. Circulation.
2002;106(25):3143-3421.
17. Snow V. ACP Diabetes Care Guide: A Team-Based Practice Manual and Self-Assessment
Program. Philadelphia: American College of Physicians; 2007.
18. Tai TW, Anandarajah S, Dhoul N, de Lusignan S. Variation in clinical coding lists in UK
general practice: A barrier to consistent data entry? Inform Prim Care. 2007;15(3):143-150.
19. Ornstein S, Nietert PJ, Jenkins RG, et al. Improving diabetes care through a multicomponent
quality improvement model in a practice-based research network. Am J Med Qual.
2007;22(1):34-41.
20. Club Diabete Sicilia. Five-year impact of a continuous quality improvement effort
implemented by a network of diabetes outpatient clinics. Diabetes Care. 2008;31(1):57-62.
21. Schnipper JL, Linder JA, Palchuk MB, et al. "Smart forms" in an electronic medical record:
Documentation-based clinical decision support to improve disease management. J Am Med
Inform Assoc. 2008.
22. AHRQ. National Healthcare Quality Report, 2005. .
http://www.ahrq.gov.libproxy.lib.unc.edu/qual/nhqr05/nhqr05.htm. Updated 2007. Accessed
23. DesRoches CM, Campbell EG, Rao SR, Donelan K. Electronic health records in ambulatory
Table 1. Study Indicators
Process measures
Measurement of hemoglobin A1c in prior 6 months Measurement of blood pressure in prior 6 months Measurement of LDL cholesterol in prior 12 months Measurement of HDL cholesterol in prior 12 months Measurement of triglycerides in prior 12 months
Measurement of urinary microalbumin in prior 12 months Performance of dilated eye exam in prior 12 months Performance of foot exam in prior 12 months
Outcome measures
Most recent hemoglobin A1c <7%
Most recent BP measurement <130/80 mm Hg Most recent LDL cholesterol <100 mg/dL Most recent HDL cholesterol >45 mg/dL
Table 2. Comparison of Process Indicators obtained from queries of „raw‟ data without correction of inaccurate diabetes diagnosis vs. „cleaned‟ data from accurate diabetes registry, January 2007.
% of Patients at Targets Among 12 Practices
Mean of Raw Data (n=1882)
Mean
of Accurate Data
(n=1250) Difference P value*
HgA1c in last 6 months 59.1 63.7 4.6 0.003
Blood pressure in prior 6 mo 92.3 92.4 0.0 0.9
LDL cholesterol in prior 12 mo 85.2 86.1 0.8 0.2
HDL cholesterol in prior 12 mo 81.6 83.1 1.5 0.05
Triglycerides in prior 12 mo 84.6 85.5 0.9 0.2
Urinary microalbumin in prior 12 mo 41.1 45.6 4.5 0.001
Dilated eye exam in prior 12 mo 39.7 43.3 3.6 0.003
Foot exam in prior 12 mo 46.3 50.8 4.6 0.007
Table 3. Performance for Study Indicators at Baseline (January 1, 2007) and Follow-Up (January 1, 2008)
% of Patients at Targets Among 12 Practices Absolute Change in % of Patients at Target Between Jan 1, 2007 and Jan 1, 2008
Jan 2007 (n=1250) Jan 2008 (n=1592)
10th
Percentile Mean
90th Percentile
10th
Percentile Mean
90th Percentile
Mean
Change SD
95% Confidence Interval P value* Process Measures HgA1c in
last 6 months 49.2 63.7 75.2 63.4 73.8 87.1 10.1 4.4 7.4, 12.9 <0.001 Blood
pressure in
prior 6 mo 86.3 92.4 97.2 90.3 94.2 97.0 1.9 4.1 -0.7, 4.4 0.1 LDL
cholesterol in
prior 12 mo 76.4 86.1 92.1 80.3 88.9 95.7 2.8 5.6 -0.7, 6.3 0.1 HDL
cholesterol in
prior 12 mo 72.5 83.1 90.9 76.5 86.6 93.3 3.5 6.0 -0.3, 7.4 0.033
Triglycerides in prior 12
mo 74.2 85.5 92.1 80.3 89.0 96.0 3.5 6.7 -0.8, 7.8 0.1
Urinary microalbumin in prior 12
mo 16.3 45.6 72.2 53.0 66.8 90.7 21.2 21.4 7.6, 34.8 0.006
Dilated eye exam in prior
12 mo 13.0 43.3 71.8 20.9 55.8 81.4 12.5 18.5 0.7, 24.2 0.04 Foot exam
in prior 12
mo 12.5 50.8 86.8 67.6 85.4 98.0 34.6 26.7 17.6, 51.6 <0.001
Outcome measures
Most recent glycosylated hemoglobin
<7% 37.3 46.7 53.6 34.6 49.6 59.3 3.0 7.0 -1.5, 7.4 0.08 Most recent
BP measurement <130/80 mm
Hg 24.2 40.9 52.1 34.7 49.4 66.7 8.5 7.7 3.6, 13.3 0.003
Most recent LDL cholesterol
<100 mg/dL 51.0 61.3 76.3 53.2 65.2 74.6 3.9 6.7 -0.4, 8.1 0.036 Most recent
HDL cholesterol at
target† 26.9 35.6 39.8 30.3 36.8 45.3 1.1 6.5 -3.0, 5.3 0.55 Diabetes
Summary
Index 50.1 61.2 70.0 61.6 70.1 78.1 8.87 6.3 4.9, 12.9 <0.001
LDL = low-density lipoprotein; HDL = high-density lipoprotein; BP = blood pressure.
*P values are based on paired t tests.
LEGEND FOR FIGURE
Acknowledgements
Without the thoughtful and continued assistance of Carmen Brutico, MD, Diane Kelly, DrPH, Barry
Smith, Ph.D, and Elleni Pippis, R.Ph. this work would not have been possible. Members of Physicians
Health Alliance Quality Committee were also instrumental in implementing this project. I gratefully