^^^m.''^-^
CHERYL M. CONNELLY. Citizen Access and Use of the Toxics
Release Inventory. (Under the direction of FRANCES M.
LYNN.)The Toxics Release Inventory (TRI) is administered by
the U.S. Environmental Protection Agency and consists of a
national, publicly available database of chemicals emitted
annually to the environment by industrial manufacturing
facilities. The extent to which this database in
accessible, understandable, and usable by citizen,
environmental and public interest organizations is evaluated
through the analysis of a nationwide questionnaire mailed to
over 200 users of the TRI.
This research supports the belief that the role of
citizens in a right to know program is a very important one.
It suggests that public interest organizations are in a
position to effectively facilitate the interaction of
citizens, industry and regulatory agencies, key players
under the TRI program. The TRI is a powerful program, with
the potential to increase and enhance citizen participation
in reducing chemical substances present in the environment
TABLE OF CONTENTS
page
I. Introduction 1
A. Historical Background 1 B. The Emergency Planning and Community
Right to Know Act 3 C. Purpose of This Study 4
II. Methods 8
A. Content Analysis 8 B. The Survey Instrument 11
III. Results 16
A. Access 16
B. Assistance 22 1. Assistance Needed by the Organization 23
2. Assistance Provided to Others 28 C. Use of the TRI Data 34
1. Purpose of Use 41 2. Impact of TRI Use 43
D. Limitations of the TRI Data 48
E. Recommendations for the TRI Program 55 1. Offered by the Surveyed Groups 55 2. Presented in Written Reports Analyzed 58
IV. Conclusions and Policy Implications 61
V. Recommendations for Further Research 65
References
Appendices
A: Summary of Provisions of SARA Title III
B: Who Must Report?
C: Toxic Chemical Release Reporting Form
D: Content Variable Analyzed in Written Reports
E: Bibliography of Reports Using the Toxic Release
Inventory Data (1987-1990) F: Survey Instrument
LIST OF TABLES
page
Table 1: Typology of Rights to Know 7
Table 2: List of Survey Recipients 14
Table 3: Usefulness of the Data in Various Forms 18
Table 4: Source of Data for TRI Reports Studied 19
Table 5: Items Aiding and Obstructing the Organization
in Us5ng the TRI Data 22
Table 6: Types of Additional Information
Needed by TRI Users 25
Table 7: Use of Outside Sources of Assistance
by Surveyed TRI Users 27
Table 8: Source of Assistance for Groups in
Written TRI Reports Studied 28
Table 9: Trends in Frequency of Information Requests
from Outside Organizations, 1988-1990 29
Table 10: Frequency of Information Requests by Specific
Parties Outside the Organization 30
Table 11: Type and Frequency of Requests for Specific
Types of Information 32
Table 12: Specific Uses Made of the Data by User Group 35
Table 13: Most Important Use of the Data Based on Ranks
Assigned by Survey Respondents 40
Table 14: Means of Publicly Disseminating the TRI Data 42
Table 15: Reported Purpose of TRI Reports Studied 43
Table 16: Impact of Organization's Use of the TRI Data 45
Table 17: Attitudes Toward Specific TRI-Stimulated
Actions 47
Table 18: Limitations on the Usefulness of the TRI Data 52
Table 19: Limitations of the TRI Data Most Frequently
LIST OF TABLES, con't
page
Table 20: Most Important Limitations on the Usefulness of the TRI Data Based on Ranks Assigned by
Survey Repondents 54
Table 21: Analytical Tools Utilized in the Writing of TRI Reports Studied 55
Table 22: Recommendations for the Administration of the
TRI Program 59
Table 23: Most Important Recommendation for the Administration of the TRI Program
Table 24: Recommendations for the TRI Program Most Frequently Cited in the Reports Studied
60
61
Appendices:
Table A: Table B: Table C: Table D: Table E: Table F: Table G: Table H: Table I:
State of Publication of Reports Studied Publication Year of Reports Studied Data-Year Analyzed in Reports Studied Geographic Focus of Reports Studied
Sections of Form R Used in Reports Studied Environmental Media Focus of Reports Studied Facility Focus of Reports Studied
Risk Focus of Reports Studied
Analytical Tools Utilized in the Writing of
Never doubt that a small group of thoughtful,
committed citizens can change the world.
Indeed, it's the only thing that ever has.
I. INTRODUCTION
In October of 1986, the U.S. Congress enacted the
Emergency Planning and Community Right-to-Know Act (EPCRA),
also known as Title III of the Superfund Amendments and
Reauthorization Act (SARA). The direct impetus for the
passage of this act was the chemical accident in Bhopal,
India, in 1984. Due to an explosion at Union Carbide's
pesticide plant, more than 30 tons of methyl isocyanate
escaped into the air. Several thousand people died and more
than 100,000 were permanently injured by the escaping
poisonous gas. (Kraft, 1990) A few months later, tragedy
hit closer to home when a smaller chemical release occurred
at Institute, West Virginia, causing 150 individuals to seek
medical attention. (Pritchard, 1980) As a result of these
and other incidents, people realized how little they knew
about toxic substances present in their communities.
Citizens and lawmakers alike learned that their current laws
had few provisions for preventing or controlling accidental
releases of hazardous substances into the environment.
A. Historical Background
The idea of right to know is not a new one. In the
chemical and biotechnological revolutions of the post-World
War II period, the public began to realize that exposure to
toxins, pollutants and other hazardous materials, whether
knowingly or otherwise, was an injustice. Accompanying this
negotiation processes among informed parties affected by the
decision, and away from decisions based solely on "expert
authority." (Kraft, 1990) Environmental policy today has
followed suit. According to Harry Otway and Brian Wynne,
"information is increasingly being used as a regulatory
instrument, and legislative initiatives...are extending the
public's right to know to new areas." (Otway and Wynne,
1987)
The first comprehensive federal action to prevent
environmental degradation was the National Environmental
Policy Act of 1969 (NEPA), which mandates that environmental
impact statements be prepared for all "major federal actions
significantly affecting the quality of the human
environment," and that these be made available to the
public. (NEPA, section 4332 [C]) NEPA was followed in 1970
by the Occupational Safety and Health Act, which, among
other things, established a regulatory agency, the
Occupational Safety and Health Administration (OSHA). OSHA
ultimately developed worker right-to-know standards which
guarantees employee access to information about substances
in the workplace that pose long-term hazards to health and
to information about each worker's exposure to such
substances.
At about the same time, the idea of community
right-to-know was born in Philadelphia, Pennsylvania, in 1979. At a
conference sponsored by the Philadelphia Occupational Safety
Cancer Prevention Center, participants began to question the
distinction between worker and citizen safety with regard to
chemical exposure. They concluded that all members of the
community are subject to the same risks, albeit at lower
intensities. In 1981, five years before community
right-to-know received federal attention, Philadelphia passed the
nation's first right-to-know law that covered both workers
and the community. (Hadden, 1989a)
B. The Emergency Planning and Community Right-to-Know Act
Enacted in the fall of 1986, the federal Emergency
Planning and Community Right-to-Know Act is divided into
four major sections. They focus on emergency planning
(Sections 301-303), emergency notification (Section 304),
community right to know (Sections 311 and 312), and toxic
chemical release reporting (Section 313). (Baram et al.,
1990) (See Appendix A for a summary of EPCRA.)
Under Section 313, certain manufacturers are required to
report their toxic emissions to the U.S. Environmental
Protection Agency (EPA) and to state officials. Reporting
requirements for each calendar year apply to any facility
which: (1) maintains 10 or more full-time employees; (2) is
classified in the Standard Industrial Classification (SIC)
code range 20 through 39; and (3) manufactures, imports,
processes or otherwise uses a "toxic chemical" (as
specifically defined in section 313(c) of the Act) in excess
of an applicable threshold quantity for that calendar year.
requirements, see Appendix B, "Who Must Report?")
EPA is responsible for compiling these annual reports
into the Toxic Chemical Release Inventory (TRI) and for
making this information available to the public. The Toxic
Chemical Release Fomn (EPA's Form R) prepared by reporting
facilities includes information on the maximum am.ounts of
the chemicals at the facility during the year, the waste
treatment methods used and their efficiencies, off-site
disposal practices, and the annual amounts of each chemical
released to the air, water and land, both routinely (i.e.
intentional discharges and fugitive emissions) and
non-routinely (such as spills and other accidental releases).
(See Appendix C for a copy of Form R.)
C. Purpose of This Study
Although it is not explicitly stated in the law itself,
various researchers have asserted that the purpose of the
TRI information is "to increase the public's ability to make
informed choices concerning the risk reduction measures they
may wish to implement," (Nordenstam and DiMento, 1990) and
"to help future planning efforts and aid in environmental
enforcement and cleanup efforts." (Ward, 1990). Records of
the legislative history indicate that the authors felt
"adequate community right to know legislation is not only
necessary, but imperative." Further, they said that "the
public deserves to know about the hazardous chemicals in
their communities in order to both prepare for toxic
hazards from continuous exposure to hazardous substance
emissions into the air...if Congress intends to open the
channel of communications concerning toxic hazards, we
should provide communities with the information that is
needed." (Congress, 1986) For these goals to be achieved,
quantitative information, as well as additional information
regarding the potential dangers associated with the release
of particular chemicals, needed to be reported. Today,
Section 313 of Title III is credited with representing an
unprecedented opportunity for citizens to learn about
possible risks in the community and to have control over
their exposure to hazardous chemicals. It allows citizens,
for the first time, to have guaranteed access to information
about hazardous substances routinely emitted to the
environment.
According to Susan Hadden, an expert in the fields of
risk communication and right-to-know, "implicit in the
provisions is the assumption that once the necessary
information became available, citizens would be able to make
sensible decisions about the risks created by hazardous
materials in their communities." (Hadden, 1989a) Since
successful implementation of EPCRA depends to a large extent
on community use of the Toxics Release Inventory, it is
important that the data not only be collected but that it be
presented in a useable and useful form to groups and
individuals in the community. In short, a lack of
act on it could be serious barriers to effective use of the
data.
This research was conducted to evaluate the extent to
which the raw data produced under section 313 of EPCRA, is
comprehensible and useable by citizens. The extensive
effort on the part of industry and regulatory agencies to
create the Toxics Release Inventory warrants aninvestigation into the level of success it has experienced
in meeting its purposes. Susan Hadden has developed a
typology of rights to know (Table 1), which suggests that
this level of information provision necessitates an active
governmental role in analyzing and manipulating the data.
If the main purpose of Section 313 is to allow citizens to
make better decisions, it must make appropriate,
understandable information available. The question is
whether this information has been made available, whether
the responsibility for analysis and manipulation have been
adopted by government (or anyone else), and whether citizens
have been able to effectively use the information to make
acceptable choices regarding the chemical risks to which
they are exposed.
To address these issues, the following questions were
asked through this research:
(1) do citizen and environmental
groups (public interest groups) have adequate
access to the TRI data?;
(2) are public interest groups satisfied with the quality and level of
and use the TRI data?;
(3) in what ways, and for what
purposes, are public interest groups using
the data?;
(4) do public interest groups see
any limitations inherent in the data, and if
so, what are these limitations?; and
(5) what recommendations do public interest organizations have for the
administration of the TRI so that the data
might be more readily and effectively used by
them?
Table 1
TYPOLOGY OF RIGHTS TO KNOW
Type Purpose Governmental Role
Basic
created
Ensure that citizens can
find out about chemicals. Risk Reduce risks from
chem-Reduction icals preferably through
voluntary industry action
but also by government if necessary. Better Decision-methods Making Alter Balance of Power
Allow citizens to par¬ ticipate in making
decisions about appropriate
levels of hazardous
materials in the community.
Empower citizens with respect to big government,
industry.
Ensure data are
and available.
Regulators use infor¬ mation to create new
standards or enforce
existing ones if
industry fails to
police itself.
Provide citizens with
analyzed data,
for manipulating and interpreting data.
Provide citizens with analyzed data, means of participating.
Taken from: Hadden, A Citizen^s Right to Know. 1989, page
II. METHODS
In September of 1990, the US EPA funded a project at
UNC-CH's Institute for Environmental Studies for a year-long
investigation of how non-EPA organizations have used the
Toxics Release Inventory. The purpose was to identify the
means of accessing the TRI as well as opportunities and
barriers for effective use of the data. In order to
evaluate the usefulness and uses of the TRI, two forms of
analysis were conducted: a content analysis of reports
published by organizations or agencies which use the data
and a survey of identified users.
A. Content Analysis
Between September of 1990 and February of 1991 a
thorough effort was made to obtain all reports written to
date by three major TRI user groups: state offices, public interest groups, and industrial organizations. Some reports
were part of the Institute for Environmental Studies'
library at the time, and many others were discovered with
the help of a publication issued by the Working Group On
Community Right-To-Know, an organization hosted by the US
Public Interest Research Group Education Fund and
representing a nationwide network of environmental and
public interest organizations. (Drum, 1990) Additional
reports by citizen and environmental organizations were
identified in a report written by the National Center for
Policy Alternatives, in Washington, D.C. (Tryens and
The work of these three user groups, and of public
interest organizations in particular, has been credited with
influencing state and federal legislation, social justice
issues, community planning, industrial behavior, pollution
prevention, risk reduction and public knowledge about the
extent of toxic pollution. (Orum, 1990) However, the means
used to accomplish these goals has never been systematically
evaluated or documented. The purpose of the content
analysis was to identify specific pieces of information
contained in the groups' reports, and to determine what
specific types of information have been used successfully to
accomplish the group's goal as well as the information and
assistance that is still needed by these groups. We
compiled a list of content variables to be analyzed for each
report that included:
- what parts of the TRI data are most commonly used in the reports?
- what environmental media (air, land, water)
is focused on?
- what is the geographic focus (national, state,regional, local) of the report?
- what is the industrial focus (all
facilities, top emitters, single facility)?
- what is the risk focus (hximan health,
ecological)?
- what purpose do these groups have in writing the reports? and
- do the groups receive any assistance, and
ͣ
,:S^^^^-!;->^i-.. -*-*t^Bs.:--;,^j^^
This information is useful in determining how the Toxic
Release Inventory is currently being used, as well as the
potential for increased use and additional types of uses by
citizen and environmental groups. This is especially true
for those groups making relatively less use of the data who
may benefit from learning about the efforts of others. (See
Appendix D for a complete list of the analyzed content
variables.)
We obtained a total of 89 reports, including 22 by state
agencies, 64 by citizen and environmental groups, and 2 by
members of Congress. We were unable to find any reports by
industrial organizations that used specific TRI data for
some purpose. The majority of industry use of the TRI is
reflected in publications by CMA which discuss the existence
of the data and the need for communication and understanding
between industrial plants and the community, but does not
use the data directly. (For example, see CMA's brochure
"Our Neighbors Across the Fence"). The final study sample
excluded these CMA publications as well as documents that
were intended to be used as guides for individuals in
accessing and using the data, but do not incorporate actual
data use in the document. Therefore, we ultimately analyzed
72 reports, 52 written by citizen, environmental or interest
groups and 20 published by state agencies. (See Appendix E
for a bibliographic list of the reports analyzed.)
The results of the content analysis were coded into a
to run the statistical analysis on the data which consisted
of a series of frequency counts for each variable, sorted by
type of group publishing the report.
B. The Survey Instrument
In addition to the analysis of TRI reports, we designed
a survey to elicit further information as to the uses of the
data, the problems associated with using it, and the types
of assistance needed by the user. (See Appendix F for the
survey instrument.) A total of 206 users of the Toxics
Release Inventory data received the survey, with
representatives from each of three groups: citizen and
environmental organizations (also referred to as public
interest groups in this document), state 313 coordinators,
and the industrial sector. The citizen/environmental group
sample consisted of organizations which had published
reports analyzed in the first phase of this research, and
through use of the snowball technique (i.e. organizations
recommended by other individuals or organizations working
actively in this field). The list of state section 313
coordinators came from an EPA publication identifying the
appointed coordinator in each state. (EPA, 1989) Finally,
industrial users were identified with the help of a Chemical
Manufacturers Association contact who supplied the names of
several industrial 313 contacts, and publications of the CMA
(Wills, 1991; CMA, undated).
Development of the survey instrument consisted of 3
team (comprised of Dr. Frances Lynn, Dr. Jack Kartez of
Texas A&M, and myself). Questions were aimed at obtaining
information not available through the analysis of reports
alone. For instance, we asked about the type and frequency of assistance sought by the organization on a day-to-day basis, data which are not commonly discussed in a group's
report.
Next, a University of North Carolina-Chapel Hill
professor. Dr. Ray Burby, with extensive experience in the writing and administering of surveys reviewed it for biased
or misleading questions. Questions which suggested to the
recipient that he or she respond in a particular manner were
changed to convey a neutral position on the part of the
survey's authors. For example, asking which of a list of
types of information the organization needed to make the TRI
useful might bias responses toward needing any type of
additional information at all; this question was
subsequently altered to allow for a "no additional
information is needed" response. At this stage, the
graphics and layout were also improved, with the belief that
visual attractiveness and a clear presentation would
increase both the response rate and the quality of
information received.
Finally, the survey was pretested on a sample of 11
representatives from all three recipient groups who had
suggestions for improving the content of the instrument
prior to its distribution.
A 71% response rate of the mail-back questionnaire was
achieved, using the method described in Dillman's book Mail
and Telephone Surveys. (Dillman, 1978) This method entails
mailing the original survey with a cover letter explaining
the usefulness of the study, the importance of that
individual's response, and hopefully motivating the
respondent to immediately pick up the questionnaire, fill it
out and return it promptly. One week later, the
questionnaire is followed with a postcard reminder sent to
everyone on the mailing list, serving as a thank you for
those who have responded and as a request to please quickly
respond for those who have not. After three more weeks, a
replacement survey and cover letter, informing the
individual that his or her survey remains outstanding and
asking that it be returned, is sent only to nonrespondents.
Seven weeks later, the final effort is made to elicit a
response. A replacement questionnaire is sent along with a
third cover letter which stresses the importance of the
researchers' work and the need for each recipient's opinions
to be included in the final analysis.
The original mailing list included 206 contacts in the
three response categories. As correspondence was received
list for various reasons.* The final useable mailing list
consisted of 189 names, 42 of which never returned the
survey. The sample set of returned surveys included: 44
state 313 coordinators, 67 citizen/environmental group members, 19 industry representatives, and 17 people in the category "other." (Table 2) As this "other" category was
comprised of people who mistakenly received the
questionnaire and were never intended to be surveyed, these
surveys were analyzed separately and the results are not
included here.
Table 2
LIST OF SURVEY RECIPIENTS
Nxomber in Number
Response Group Original Mailing______Responding
STATE 313 COORDINATOR 59 44 CITIZEN AND
ENVIRONMENTAL GROUP^ 112 67
INDUSTRY^ 35 19
OTHERS — 17
^national, state and local level organizations
'^either a corporate headquarters of a firm, the local
plant of a firm, or an industrial coalition
^including city government officials, research institution
employees, and an investment manager
*For example, the organization did not, in fact, use the TRI
data, or 2 people in the same organization inadvertently
received the survey and responded collectively, or the
To quantify the attitudes of citizen and environmental
group members, only the frequency counts of each variable
are required. This type of analysis clearly presents both
the number and percentage of respondents in each response
category which answered in a particular way, such as the
number of people in the public interest group category who
feel cost of the data is a problem for them.
However, a comparison of citizen/environmental groups to
the other two groups provides a sense of relativeness.
Knowing, for instance, that these individuals find the cost
of the data to be an obstruction to their work becomes more
meaningful when it is discovered that neither of the other
groups using the same set of data feels the same way. It is
one thing to be able to say "cost of the data is a problem"
and another to say "cost of the data is particularly a
problem for members of citizen and environmental groups as
compared to state 313 coordinators and industry
representatives." Results of this second type of analysis
(the Chi Square test) facilitates priority setting by a
regulatory agency such as the EPA. If EPA administrators
wish to provide assistance specifically designed for citizen
groups, for instance, they can focus their efforts on that
which will most benefit that particular subset of TRI users,
instead of users in general.
Further, there was substantial opportunity throughout
answers to a question and to expand or comment on our
questions and fixed choice answers. This type of
questioning produced a wealth of information which can not
be statistically analyzed but rather is intended to provide
additional insight into the opinions and experiences of the
respondent. Particularly revealing comments are included in
this report where appropriate.
III. RESULTS
A. Access
We asked whether or not interest groups were satisfied
with the access they feel they have to the TRI information.
The EPA spends a significant amount of resources on
disseminating the data in various forms and formats. By
law, the EPA is required to "establish and maintain in a
computer data base a national toxic chemical
inventory...[and]...make these data accessible by computer
telecommunication and other means to any person." (SARA,
Section 313(j), 1986)) The telecommunication mandate has
been met with EPA's creation of the TRI database, part of
the TOXNET computer system maintained by the National
Library of Medicine. The "other means" provision allows an
interested individual who is without access to a computer
and modem to obtain the same information on paper, CD/ROM,
diskettes, microfiche or magnetic tape. Unfortunately,
these are not necessarily the most utilized sources of data
groups surveyed, microfiche, magnetic tape, and CD/ROM are
the least preferred means of accessing the data; less than
12% of the respondents in each response category indicated
these were useful. Only industry found the National Library
of Medicine useful (p=.031), possibly because industrial
organizations have the staff and resources necessary to be
able to use and understand it readily available to them.
Surprisingly, reports put out by "state, environmental
groups or industry that use the TRI data" were considered
most useful by all groups responding to the survey. In the
reports published by public interest organizations and state
agencies, the source of data access most often cited is the
original reporting forms (Form R). Secondary analyses, such
as these reports, were used as the means of obtaining the
data in less than 10% of the reports. (Table 4) Of the
three surveyed groups, state coordinators use the EPA
National Report most frequently (59%). A "printed list" is
used frequently by all survey respondents (more than half of
each group found this form useful), while interest groups
and state agencies also show a preference for state
diskettes. None of the top four most useful forms of the
data, regardless of response category, requires
sophisticated computer equipment or expertise (only state
diskettes require any equipment and then a personal computer
Table 3
USEFULNESS OF THE DATA IN VARIOUS FORMS
Form - Usefulness
Response Group
Interest 313 Industry
OTHER
REPORTS-STATE DISK
PRINTED LIST
EPA NAT'L REPORT
-NLM" CD/ROM MAGNETIC TAPE MICROFICHE -useful 58% —
not useful 12
— useful 55
—
not useful 19
_
useful 51
-not useful 18
— useful 42
—
not useful 24
_
useful 27
—
not useful 39
_
useful 10
—
not useful 51
_
useful 7
-not useful 60
mm
useful 4
-not useful 63
59% 20 61 23 61 20 59 20 25 52 11 68 11 73 2 75 58% XI 21 47 53 32 53 21 63 26 5 63 5 79 0 79
N varies for each cell; percentages may not sum to 100 due
to non-response.
ͣ
'
ͣ
"other reports" refers to reports prepared by the state,
environmental groups, or industry that use the TRI data
Table 4
SOURCE OF DATA FOR TRI REPORTS STUDIED
Percent of Reports Data Source________________________Public Interest_____State
ORIGINAL REPORTING FORMS (FORM R) 50% 55%
NLM 22 0 EPA NATIONAL REPOLT 11 18 SECONDARY ANALYSIS 6 9 STATE DISKETTE 6 0
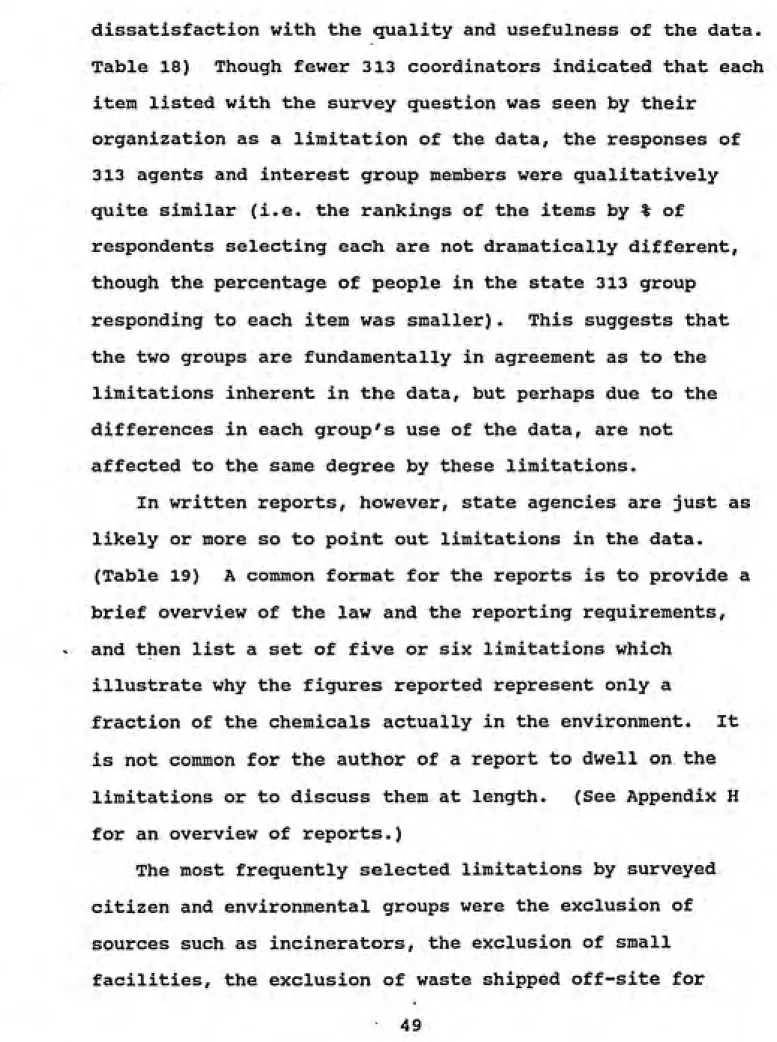
The obstruction most frequently cited by public interest
groups in their use of the data was the timeliness of the
data (cited by 61% of the respondents), with the form of the
data, the location of the data and the cost of the data also
being seen as obstructions by many public interest groups.
(Table 5) Availability of computer equipment and people
with computer expertise were somewhat obstructive, but were
also seen as an aid by almost as many respondents.
For state 313 coordinators, the timeliness of the data
was the biggest obstacle to their using the data. No other
elements stood out as major obstructions. The form of the
data was obstructive for many state respondents, but was
also considered an aid by some. Far more state
coordinators, as compared to public interest groups, found
computer expertise to be adequate versus obstructive, and
cost did not seem to be an obstacle for them.
State and industry representatives, unlike interest
groups, consider many of the items to be both an obstruction
and an aid and indicate that several items had "no effect"
on their use of the data. Only interest groups consistently
find eacn of the six listed items to significantly obstruct
them. The major difference among the groups seems to stem
from the availability of resources. For states and industry
the two items ranked most highly as obstructing them
(timeliness and form) are things that can be changed within
EPA's administration of the TRI program. The other
potential barriers, which are either considered an aid or to
have no effect by the majority of state coordinators and
industry representatives, can be avoided with staff members
(e.g. "people with computer expertise") or money (e.g. "cost
of the data" and "computer equipment available for use by
the organization"). Interest group respondents, on the
other hand, probably are not as likely to have adequate
resources available to them, and this may at least partially
explain why they consistently find all the items to be an
obstruction.
Quality of data (including reliability, enforcement
strategies of both EPA and state offices, NLM inadequacies,
and "incompleteness") was the obstruction most often cited
by public interest organizations in the free response space
some forms can be obtained at no cost, and that it is
available via telecommunications as opposed to the user
needing to be in the same location as the data, were
frequently written in as aiding their use.
To enhance the public's use of the data, changes in the
law and the administration of it should focus on enhancing
the quality and completeness of the data and on providing
the data in easily-accessible formats. For all three
groups, however, the greatest obstacle to using the data is
timeliness. As one respondent said "EPA would...release
[TRI] information...9 months to a year after the reporting
deadline [so that] 1988 reports filed July 1st 1989 were not
available until May 1990. The lag in data availability
Table 5
ITEMS AIDING AND OBSTRUCTING THE ORGANIZATION IN USING THE TRI DATA
Item Interest
Response Group
______313_______ Industry
AVAILABILITY OF COMPUTER EQUIPMENT Aided 34%
No effect 24
Obstructed 37
39%
36
20
AVAILABILITY OF PEOPLE WITH COMPUTER EXPERTISE Aided 34 43
No effect 24 32 Obstructed 39 20
16% 63 11 21 58 11
FORM OF THE DATA
Aided 25
No effect 24
Obstructed 46
COST OF THE DATA
Aided 24
No effect 31
Obstructed 36
LOCATION OF DATA
Aided 18
No effect 37
Obstructed 42
TIMELINESS OF DATA
Aided 16
No effect 19
Obstructed 61 23 41 32 14 70 11 18 55 23 7 36 52 5 37 42 16 63 11 0 74 16 11 37 37
N varies for each cell; percentages may not sum to 100 due
to non-response.
B. Assistance
The public interest groups that we surveyed, as well as
assistance in using the TRI data, and provide assistance to
others, outside of their organization, in understanding and
using the information.
1. Assistance Needed by the Organization
When asked if the organization needed any ancillary
information in order to make the TRI useful, a nearly
unanimous 97% of the interest groups indicated they needed
some type of additional information (as did 89% of state 313
coordinators, and 53% of industrial representatives). (Table
6) Most-needed by interest groups is information about a
specific facility, such as past accidents, reports of agency
inspections, RCRA compliance, or other existing permits.
Information about the use of control technology or process
changes to reduce specific emissions in industrial processes
would be of interest to 79%, and both information onspecific health impacts and environmental effects of
chemical releases and waste minimization reporting by
industry are also important to interest groups. Very few
(18%) are interested in further information about the law
(SARA Title III, the Emergency Planning and Community
Right-to-Know Act), including procedures for toxic release
reporting, who to contact, etc.
About one-half of state coordinators would like
information on each of these same four issues (type of
facility, health and environmental effects, technology
need for any kind of information.
"Other" types of information citizen and environmental groups would like to receive include industrial compliance with various permit limits, information on production levels
and chemical use as well as releases, peak release data, and
the mandatory reporting of toxic use reduction and pollution
prevention efforts.
The desire of survey respondents to see some analysis
performed on the data and to have additional information
included with the release of the data (such as the health
and environmental effects associated with reported
chemicals) clearly precludes improving timeliness of
release, an important obstruction of the data for all three
groups. Obviously, thorough verification efforts and
accurate data entry and supplemental analyses will not
result in a more timely release of the data. It is likely, however, that TRI user groups would better tolerate the lack of timeliness if it were accompanied by the release of more
Table 6
TYPES OF ADDITIONAL INFORMATION
NEEDED BY TRI USERS
Percent of response group
Type of Information__________Interest______313 Industry
FACILITY-SPECIFIC
USE OF CONTROL TECHNOLOGY
HEALTH AND ENVIRONMENTAL
IMPACTS
WASTE MINIMIZATION EFFORTS
THE LAW (EPCRA)
OTHER
NONE
85% 48% 21%*
79 50 21 *
78 48 26 *
72 57 26 **
18 9 5
39 20 16
3 11 47 *
* p<.001 ** p<.005
Of our sample, 73% of citizen and environmental groups
have looked to specific organizations outside of their
organization for help in obtaining different types of
information and in using the TRI, while the other two groups
were less likely to do so. "Environmental groups" are by
far the source most often turned to for assistance by public
interest groups: 90% of interest group respondents have
contacted them at least once and 45% report contacting them
"frequently." (Table 7) Similarly, when piiblic interest
assistance it provided, environmental groups were cited the
most frequently. (Table 8) State agencies, industrial
firms, and EPA are the next three most commonly contacted
organizations by environmental groups, although all of the
organization listed have been contacted "frequently" by some
percentage of interest groups.
This is not true for state 313 coordinators or
industrial representatives. State 313 coordinators tend to
rely on the EPA most often and industrial firms, state
agencies, and universities somewhat less frequently, while
industry representatives find the majority of the assistance
they need in trade associations and the EPA. Slightly more
than half of state respondents (55%) and even fewer industry
respondents (42%) report using any outside assistance at all
in interpreting the TRI data or gaining additional
information. Rarely do state agencies credit any other
organization with providing assistance to them in their
written reports, either. In fact, the only source of
assistance cited in a report by a state agency was a local
non-profit organization.
Because our industry sample is limited, it is difficult
to make generalizations. However, it may be that industry
is less likely to look anywhere else for help in using the
data because (1) they have all the help they need within
their organization (i.e. associations such as the CMA
currently supply them with sufficient internal assistance or
or (2) they simply use the data less frequently or in
different ways than do the other two groups and therefore
have a correspondingly less frequent need for assistance.
Table 7
USE OF OUTSIDE SOURCES OF ASSISTANCE BY SURVEYED TRI USERS
Source of Assistance
Percent of Response Group*
Interest__________313_______Industry
ENVIRONMENTAL GROUP
EPA
STATE AGENCY
INDUSTRIAL FIRM
LEPC^
SERC^
TRADE ASSOCIATION
UNIVERSITY
CONSULTANT
90%(45)
67 ( 8) 59 (22)
45 (10)
33 ( 4)
33 ( 6) 22 ( 2)
22 ( 4)
18 ( 2)
17%( 0)
92 (21)
29 ( 4)
33 ( 8)
29 ( 0)
13 ( 4)
17 ( 0)
21 ( 4)
4 ( 0)
25%( 0)
50 (25)
38 ( 0)
38 ( 0)
13 ( 0)
25 ( 0)
63 (25)
0(0)
0 ( 0)
The first number reflects any use of the outside
organization for assistance, whether "once or twice,"
"occasionally," or "frequently." The number in parentheses
is the percent of that use that was made "frequently" only.
ͣ
^Local Emergency Planning Committee
Table 9
TRENDS IN FREQUENCY OF INFORMATION REQUESTS FROM ,^ OUTSIDE ORGANIZATIONS, 1988-1990
Percent of response group receiving
requests at least several times/month
Year________________Interest__________313_______Industry
1988 26%
1989 40
1990 43
50% 11%
59 0
71 0
The four parties most frequently contacting the surveyed
organizations for information about the TRI were
environmental groups, the news media, individual citizens
and community groups. These are also the parties citizen
and environmental groups hear from most frequently (though
in a slightly different order if ranked by frequency).
Table 10
FREQUENCY OF INFORMATION REQUESTS BY SPECIFIC PARTIES
OUTSIDE THE ORGANIZATION
Percent of Response Group
Outside Party____________Interest_______313_______Industry
ENVIRONMENTAL GROUP 100%(31%) 93%(36%) 84%( 5%)
INDIVIDUAL 94(43) 93(18) 74( 0)
NEWS MEDIA 94(34) 95(34) 89( 5)
COMMUNITY GROXJP 91(27) 84 ( 7) 74 ( 0)^
STATE LEGISLATOR 58 ( 3) 64 ( 0) 47 ( 0)^
BUSINESS/INDUSTRIAL FIRM 42 ( 3) 86(16) 63 ( 5)^
STATE AGENCY 39 ( 4) 84(16)"* 63 ( 0)^
LEPCS 36( 0) 73( 5) 78( 5)^
CITY/COUNTY AGENCY 34( 3) 68( 5) 42( 0)^
UNIVERSITY 33( 0) 68( 5) 32( 0)^
ENVIRONMENTAL SERVICES
FIRM 28( 3)^ 86(32) 53( 5)^
The first number reflects any contact by the outside
organization, whether "rarely," "occasionally," or
"frequently." The number in parentheses is the percent of
the response group indicating that the contact occurred
"frequently" only. (When N < 130 due to non-response, the
percentage given is based on the N for that cell.)
i^N=18
2n=17 ^N=66 %=43
When the group is contacted by persons outside the
surveyed population as a whole was information about a
particular facility's releases. However, this varies across
the groups. (Table 11) Information about a particular
geographic area, a particular facility, and specific health
effects are the most common types of requests made to
interest groups. Forty-eight percent of state coordinators
said information on a particular facility is a frequent
request, with information on a geographic area and on how to
get the data in a convenient and timely manner being
requested from about 30% of them. As for industrial
facilities, information on a particular chemical is most
frequently requested. "Other" types of information
, requested of citizen and environmental groups include
information on citizen suits, lists of the "worst
polluters," information on how the TRI is being used by
state agencies, the EPA and other organizations, and how to
' ^~''-^''V:^,syr^j.,^lj^gr,^^.. .
Table 11
TYPE AND FREQUENCY OF REQUESTS
FOR SPECIFIC TYPES OF INFORMATION
Percent of Response Group*
Type of Request__________Interest_______313________Industry
RELEASES IN SPECIFIC
GEOGRAPHIC AREA 94 (31)^ 91 (30)^ 65 ( 0)^
PARTICULAR FACILITY'S
RELEASES 92 (30)"* 98 (48) 95 ( 5)
HEALTH EFFECTS 91%(30%) 86%( 7%) 74%( 5%)
PARTICULAR CHEMICAL'S
RELEASES 86 ( 6)"^ 90 (14) 94 (11)^
DATA ACCESS 86 (18)^ 88 (29)"^ 71 ( 6)^
RELEASE PREVENTION 75 (15)^ 48 (0) 47 ( 6)^
RISK COMMUNICATION 72 ( 6)^ 52 ( 0) 74 ( 0)
The first number reflects any request for that type of
information, whether "rarely," "occasionally," or
"frequently." The number in parentheses is the percent of
the response group indicating that the request occurred
"frequently" only. (When N < 130, due to non-response, the
percentage given is based on the N for that cell.)
^N=65
^N=18
ͣ
'N=66 !n=43
^N=17
^N=64
'N=42
Overall, Tables 6 through 11 indicate that use of the
TRI requires the availability of technical assistance; all
three user groups surveyed need additional information and
the organization. In addition, this assistance is often
provided by citizen and environmental organizations.
Effective use of the data by its wide range of users
actually depends to a great extent on the activities of
these non-governmental organizations. Specifically, public
interest groups are being asked to provide information on
what the figures mean, including the health risks associated
with the chemicals and how to communicate these risks, and
on release prevention.
Because citizen and environmental groups are very active
in supplying the TRI information to other organizations,
these groups represent a largely untapped resource. EPA
could maximize its outreach efforts by providing public
interest groups with the additional information they need
and by supporting them in their efforts to educate the
public. These groups clearly are already part of an
information-exchange network and are seen as a useful
resource by other groups and individuals (they are being
contacted with substantial frequency by a wide variety of
parties, including environmental groups, individual
citizens, news media, community groups, state legislators,
and industrial firms) (Tables 9 and 11). With encouragement
and financial or material support, they could likely expand
their efforts to become even more effective in this
C. Use of the TRI Data
We expected the three groups to be using the data
differently (that is, in different ways and for different
purposes), and this proved to be true for our sample.
Identifying these differences might help explain the
variances seen among the groups' attitudes in sections III-A
and B above (ease of access, obstructions to use, and
assistance needed and provided). Further, thorough
documentation of current data use may expand existing
efforts, as less experienced user groups gain insight from
the work of other, more active and innovative groups.
Citizen and environmental groups, we found, differ
substantially from the other two groups in the ways the data
is used. (Table 12) Much more so than either of the other
groups, interest group respondents use the data to exert
public pressure on facilities, educate affected residents,
lobby and prepare recommendations for legislative and
regulatory policies, assess adequacy of existing laws and
regulations, and direct negotiations between citizens and
industry (where p < .002 for each item). All three response
groups are equally interested in identifying needs and
opportunities for source reductions (48% - 58% of
respondents in each group identified it as a way in which
they use the data) and in comparing releases for similar
Table 12
SPECIFIC USES MADE OF THE DATA BY USER GROUP
Use____________________________Interest_____313 Industry
PRESSURE FACILITIES 85% 27% 5%
EDUCATE AFFECTED RESIDENTS 79 16 .53
LOBBY FOR LEGISLATIVE OR
REGULATORY POLICIES 75 14 16
PREPARE RECOMMENDATIONS FOR
LEGISLATION/REGULATION
ASSESS EXISTING LAWS
EFFECT SOURCE REDUCTION
COMPARE SIMILAR FACILITIES
DIRECT CITIZEN/INDUSTRY
NEGOTIATIONS
PRIORITIZE RESEARCH
COMPARE TO PERMIT RECORDS
PREPARE COMPANY PROFILE
RAISE FUNDS
PREPARE LITIGATION
PLAN FOR EMERGENCY MANAGEMENT CONDUCT EPIDEMIOLOGICAL
STUDIES 3 11 11
CONDUCT COMMERCIAL
MARKETING STUDIES 12 0
57 34 16
52 30 16
51 48 58
46 41 42
45 11 11
39 14 16
36 64 32
34 18 53
22 5 0
15 7 0
13 36 32
One implication of these findings is that public
313 program. For instance, most of those who are familiar
with the TRI agree that the data need not be just a
"paperwork headache" for industry, but rather it could and
should be a useful indicator for them of inefficient and
wasteful practices and potentially unnecessary toxic
chemical use. Interest groups are providing the impetus for
industry to do just that, by actively pressuring facilities
to take a critical look at the causes behind their emissions
and to find alternatives and solutions.
Also, the intent of section 313 of SARA is to provide
citizens with important information about chemicals in their
communities, but the law neither requires any public
education efforts beyond simply creating the database, nor
allocates any funds to do so. Public interest groups are
filling in this gap; about 80% of public interest group
respondents report educating affected residents about local
chemical use, and 45% (four times more than either of the
other groups) indicate they've facilitated citizen/industry
negotiations. In doing so, public interest groups are
helping to keep the lines of communication open between
citizens and industry, a fundamental tenet of the
right-to-know philosophy, so that each can fully benefit from the TRI
data.
Finally, the large percentage of public interest groups
using the TRI data to lobby for legislative and regulatory
policies, prepare recommendations for legislation and
vi^^^-^P^^^P^^-^-how active they are in the regulatory arena. All of these
activities result in the cooperative exchange necessary for
the right-to-know program to be successful. It is not
enough for industrial facilities to report and government
agencies to receive the reports. As one survey respondent
observed, "Government will never be able to come in from the
outside and manage toxic chemicals safely. [Local people]
can get more accomplished at a Rotary meeting than 2 pounds
of federal regulation..." Without this vital third link,
the chain of information-transfer under right-to-know would
fall apart.
When asked to rank their uses by importance (with a
"most important use," "second most important," and "third
most important" ranking scheme), the interest groups' most
important use was to educate affected residents. This was
calculated by assigning each use a score, based on the
following formula:
Score for Usejj = (3*Ni) + (2*N2) + (N3)
where: N^ = the number of respondents (in each
group) selecting Use^ as "most
important"
N2 = the number of respondents (in each
group) selecting Usejj as "second most
important"
N3 = the number of respondents (in each
group) selecting Use^ as "third most
important"
The actual weights (3, 2 and 1) are arbitrary, but the
the degree of importance placed on it by survey respondents.
To rank the uses based solely on the frequency with which
each was chosen as "most important" would be another way to
order the items, but this method ignores important
information. For instance, the data may show great
disparity within a particular group as to the use that is
most important, but this same group may be almost unanimous
as to the second most important use. This significant
observation would be lost with the alternative method of
ranking the answers. A second benefit of the summing method
is that it produces fewer "ties" among several items being
chosen by the same number of people as the "most important".
In this project, the two methods provide similar, but not
identical, rankings of the items.
Thus, in addition to educating residents, exerting
public pressure on facilities and lobbying for legislative
and regulatory policies are the most important uses of the
data by interest groups. State coordinators, on the other
hand, see checking emissions against permit records as the
most important use, and industry's most important uses are
to identify needs and opportunities for source reductions
and plan for emergency management. (Table 13) In all three
groups, the use specified by the survey respondent in the
open-ended "other use" space ranked at least moderately high
on the list, with this being especially true for the state
Prevention practices of industrial firms (by citizen and
environmental groups), compliance checks of a company's
permitted releases (by state 313 agencies), and "monitoring
Table 13
MOST IMPORTANT USE OF THE DATA,
BASED ON RANKS ASSIGNED BY SURVEY RESPONDENTS
Score
Use_______________________________Interest 313 Industry
EDUCATE AFFECTED RESIDENTS 73 10 14
LOBBY^ 67 12 2
PRESSURE FACILITIES 63 9 0
DIRECT NEGOTIATIONS^ 25 2 4
EFFECT SOURCE REDUCTION 23 29 21
PREPARE RECOMMENDATIONS^ 18 10 1
ASSESS EXISTING LAWS 17 12 5
COMPARE TO PERMIT 8 43 0
COMPARE SIMILAR FACILITIES 7 14 8
PRIORITIZE RESEARCH 7 6 0
PREPARE COMPANY PROFILE 7 10 11
PREPARE LITIGATION 7 0 0
RAISE FtJNDS 4 0 0
EMERGENCY PLANNING 2 20 13
CONDUCT EPIDEMIOLOGICAL STUDIES 0 9 2
CONDUCT MARKETING STUDIES 0 10
"OTHER" 21 19 6
Score based on a weighted sum of the number of times each
item was selected as most important, second most important,
and third most important by respondents.
^lobby for legislative and regulatory policies
^negotiations between citizens and industry
ͣ
1. Purpose of Use
When asked about the organization's purpose in using the
TRI data, state 313 coordinators generally report responding
to legal mandates or meeting public or media requests for
specific information. In contrast to this reactive approach, public interest groups are taking a stronger
proactive position when it comes to data dissemination. As
one respondent wrote, "as part of the Emergency Planning and
Community Right-to-Know Act, the TRI data should be brought
to the attention of the general public, not just those who
request the data. We try to make the data as available as
possible to the public." In their written reports, which is
the dissemination vehicle most often used by all three
groups (Table 14), citizen groups most often focus on
instituting pollution prevention or Toxic Use Reduction laws
or regulation as their main policy objective. Thirty-five
percent of the reports' analyses and conclusions aim at
influencing specific state policies while 15% focus on
policy changes at the national level. Over one-third of the
reports specifically cite citizen empowerment among their
aims. A small subset of the reports compare the data to
existing permit or other publicly available data bases.
(Table 15)
Industry is somewhat proactive in its approach, but
tends to be motivated by a mild fear. Members of industrial
firms are conducting outreach to provide additional
in the paper and become, possibly unduly, alarmed. "We
wanted to disseminate the TRI data to the local community
prior to it being 'revealed' by the media. We also wanted
to have the opportunity to discuss what the niombers mean and
provide information about environmental improvements," said
one industry representative when asked about the
organization's purpose in disseminating information.
Comments from other members of industry echo this sentiment:
"to put information in perspective," "to communicate openly
with citizens," and "to make it easy for citizens to get
information they had every right to have__where we would
have the opportunity to provide background information on
how the data was collected," were offered as the impetus for
active information disclosure by several industrial firms.
Table 14
MEANS OF PUBLICLY DISSEMINATING THE TRI DATA
Percent of Response Group
Forum_____________________Interest_______313______Industry
WRITTEN REPORT
PRESS RELEASE
NEWSLETTER
PUBLIC MEETING
COMMUNITY WORKSHOP
MAILING
78% 50% 79%
76 36 53
60 18 53
52 11 74
48 23 53
Table 15
REPORTED PURPOSE OF TRI REPORTS STUDIED*
Percent of Reports
Purpose__________________________Public Interest_____State
EFFECT POLLUTION PREVENTION/SOURCE
REDUCTION EFFORTS
CHANGE STATE POLICY
INCREASE CITIZEN EMPOWERMENT
RAISE AWARENESS/SUMMARIZE TRI DATA
CHANGE FEDERAL POLICY AID EMERGENCY PLANNING
OTHER
A report may have more than one purpose; "raise awareness"
was assumed only if no other specific purpose(s) was stated.
58% 15%
35 0
33 5
15 75
15 0
8 0
10 5
2. Impact of TRI Use
Public interest groups report that their use of the TRI
data has had significant impact on two main areas: the
media and its coverage of toxic chemical emissions; and
legislative, regulatory and administrative action. (Table
16) They responded that other important impacts of their
efforts are in facilitating meetings between industry and
community groups and promoting source reduction efforts.
Given the rather vague intent of SARA Section 313 as
discussed in section 1, these outcomes are noteworthy; their
enforcement or the threat of legal repercusions, but solely
to self-motivated efforts.
Interestingly, the self-identified purpose of the
organization's efforts offerred the most frequently by all
three groups is a general goal of "raising awareness," and
"informing the public." Yet, when provided with the
opportunity to do so, they accept responsibility for these
other much more specific and consequential impacts. It may
be that it is assumed such impacts naturally follow from
increased education and awareness. One respondent
elaborated on his groups' purpose (education) to say: "...to
have industry aware of requirements and thereby comply; to
have community aware of Community Right-to-Know information
and thereby have the opportunity to participate in local
activities; to have government aware of entire program and
thereby regulate and enforce more adeptly." (emphasis added)
Media coverage has been affected by all three groups,
probably because this is an effective and easy means of
raising the public's awareness and because toxic emissions
ͣ
'!gg:jj>^!]jgi;^gg^>g^5gagefli^j?'?^ ͣ^^s«^3^«?«»f-"?«;J4l«libi»|J!^^v^w*ͣ^-"i^^
Table 16
IMPACT OF ORGANIZATION'S USE OF THE TRI DATA
Percent of Response Group
Impact__________________________Interest____313 Industry
RESULTED IN MEDIA COVERAGE
OF TOXIC EMISSION SUBJECTS 8''% 61% 68%* STIMULATED LEGISLATIVE, REGULATORY
OR ADMINISTRATIVE ACTION 66 32 42 *
FACILITATED MEETINGS BETWEEN
INDUSTRY AND COMMUNITY GROUPS 49
PROMPTED SOURCE REDUCTION EFFORTS 46
RESULTED IN LITIGATION 24
16 68 **
32 68
20 0
* p<.01 ** p<.001
Given the choice, however, industry is not in favor of
media coverage to the extent that interest groups and state
agencies are, and one respondent qualified his answer with
the comment "media coverage strongly favored as long as fit
is] factual." (emphasis added) In fact the only action
strongly supported by industry is industry-public
cooperation. (Table 17) The tendency is for industry to
want to avoid further, and "excessive" regulatory burdens:
"We are making such good progress throughout the
costly and unnecessary," suggests one industry respondent.
Similarly, state agencies shy away from supporting
actions which would increase their responsibilities, without
a corresponding increase in resources. The action most
favored by them does not involve the expenditure of efforts or resources on their part, but rather requires negotiation between industry and the public. In response to a survey question eliciting preferences for specific actions, state
coordinators responded with: "I presume you mean the
enforcement would be done by EPA;" "supports of the above
actions would be conditioned upon receiving funding to
support actions our agency would be required to do in lieu
of the U.S. EPA;" and "funding for states - strongly
favored." Since inspections, for instance, could involve
any number of parties, from the public to industry to the
state and EPA, state respondents are more likely to
recommend them if it were clear that they would not be
solely responsible for mandating and conducting them.
Citizens, on the other hand, strongly support almost all
the TRI-inspired actions offered by the survey, and suggest others, such as the formation of local community action
groups and citizen oversight, expansion of Right-to-Know
efforts, school-based education programs aimed at "the next
generation," and citizen suits against companies who fail to
report. Citizen and environmental groups are in a unique
position relative to our other response groups. They
"^^^ ' ^'ms^^^^ifiWMmm-''
acting upon them and pulling them in often disparate
directions, as do both industrial organizations and
state/federal agencies. At the same time, they are not
unaffected by fiscal constraints; they rely on volunteers as
the principal source of support for their activities.
Table 17
ATTITUDES TOWARD SPECIFIC TRI-STIMULATED ACTIONS
Percent of Response Group
Action-Attitude_________________Interest_____313 Industry
MEDIA COVERAGE
Support 100% 71% 39%
Oppose 0 0 0
TOXICS USE REDUCTION LEGISLATION
Support 100 81 6
Oppose 0 0 75
TOXIC EMISSIONS REGULATION
Support 98 83 38
Oppose 0 2 31
MANDATED PLANT INSPECTION
Support 98 46 6
Oppose 0 18 75
INDUSTRY-PUBLIC COOPERATION
Support 88 93 100
Oppose 2 0 0
VOLUNTARY PLANT INSPECTIONS
Support 67 61 50
D. Limitations of the TRI Data
In addition to asking the organization to identify the
various ways it uses the TRI data, the survey also allowed
respondents to indicate any limitations they have
experienced in using the data for their purposes. The
Environmental Protection Agency has acknowledged that the
TRI data has certain limitations (EPA, 1989), related to
details that are not reported or cannot be determined from
what is reported. These include:
- the law requires only that the information be
based on reasonable estimates; actual measurements
or monitoring are not required, which limits the
accuracy of the data obtained.
- the TRI does not provide a complete picture
of all toxic emissions to a community as not all
sources of chemical releases are reported. Only
facilities of a given size are covered under the
law and many other types of facilities (such as
incinerators and dry-cleaning establishments) are
excluded.- only the annual emissions to the air, water
and land are reported, not the rate of release.
The health effects of a large release over a short
period of time are potentially very different from
those resulting from smaller releases over a long
period of time.
- the extent of public exposure cannot be
determined or even estimated from the TRI data
alone.
We hoped to discover if those who use the data share EPA's
views, and whether they have experienced additional problems
with using the TRI information for their organization's
purposes.