KENNETH FLOYD MARTINEZ. The Design and Evaluation of a Cyclone
Sampling Inlet for the Mattson-Garvin Slit-to-agar Bloaerosol Sampler (Under
the direction of Dr. Parker C. Reist.)
ABSTRACT
This study focuses on the design and evaluation of a cyclone sampling inlet
for the Mattson-Garvin slit-to-agar bloaerosol sampler. Two helical inlet
cross-sectional areas were selected based on theoretical estimates that
provide a 50% effective cut-off diameter at 8 //m. Cyclone body lengths
were selected as multiples (one, two, and three times) of the original
sampling inlet diameter. The dimensions of the exit slit were designed to
provide a cut-size of 1 //m. Each cyclone configuration was individually
placed (side-by-side with a 47-mm filter cassette) in the interior downstream
end of an aerosol chamber. Monodisperse aerosol particles, with
aerodynamic diameters of 3.6, 5.3, 7, 9.3, and 11.8 yum, of oleic acid
tagged with a fluorescent dye (uranine) were generated at the upstream end
of the chamber using the Berglund-Liu vibrating orifice monodisperse aerosol
generator. The TSI Aerodynamic Particle Sizer was used, at the sampler
location, to verify aerodynamic particle size and aerosol generating system
operation. The results indicate that the short cyclone body tube length
provides the optimum environment for separation of particles, separation
efficiency ranged from 15% to 33% for the increasing particle sizes
investigated. Helix inlet cross-sectional area had no statistically significant
ACKNOWLEDGEMENTS
I would like to extend my gratitude to Drs. Parker Reist, Russell Wiener, and
Jerry Tulis for their vision and guidance in the development of this study.
Without their knowledge and direction, the completion of this project would
have been in serious doubt. Special thanks are given to Charles Frey and
the U.S. Environmental Protection Agency (Research Triangle Park, NC)
machine shop for their mastery in the construction of the cyclone. I would
also like to extend my appreciation to James H. Jones, whose support and
confidence in my abilities have helped me to persevere, and to Dr. Dennis
O'Brien, who provided me with an informed sounding board upon which I
could bounce ideas. In addition, I would like to thank Dr. David Leith (as my
academic advisor), C.L. Lassiter, and Carol Garden without whom my
education and degree would have never come to fruition.
Finally, but by no means last, I must extend my deepest appreciation and
love to my wife Denise and my son Jarrett. For two years, they endured my
physical and emotional absence and tolerated my stressed-out personality
when I was around. Denise and Jarrett, thanks for letting me come home.
TABLE OF CONTENTS
Page
TABLE OF CONTENTS ... iv
TABLE OF TABLES... vi
TABLE OF FIGURES ... vii
LIST OF ABBREVIATIONS ... ix
LIST OF SYMBOLS... xii
I. INTRODUCTION... 1
II CYCLONE DESIGN... 6
2.1 Literature Review... 6
2.2 Cyclone Design Criteria... 11
III OBJECTIVES AND HYPOTHESIS... 17
IV CONDUCT OF EVALUATIVE EXPERIMENTS... 21
4.1 EXPERIMENTAL EQUIPMENT ... 22
4.1.1 Aerosol Chamber... 22
4.1.2 Aerosol Generation... 25
4.1.3 Verification of Aerodynamic Diameter... 30
4.1.4 Sample Analysis ... 30
4.2 EXPERIMENTAL DESIGN... 36
4.2.1 Variable Flow Rate Experimental Design ... 37
4.2.2 Various Cyclone Configurations Experimental
Design... 38
V RESULTS AND DISCUSSION... 40
5.1 Variable Flow Rate Experiment ... 40
5.2 Various Cyclone Configurations... 43
5.2.2 Statistical Analyses of the Cyclone Recovery
Efficiency...53
5.2.3 Statistical Analyses of 47-mm Filter Cassette and
APS Data...55
VI CONCLUSIONS...59
REFERENCES...62
^"f^^mmmma^^Mi^'
TABLE OF TABLES
Page
Table 1.1: Cyclone Specifications ...16
TABLE OF FIGURES
Page
Figure 1.1: Mattson-Garvin Slit-to-agar Sampler... 5
Figure 2.1: Axial Inlet Cyclone Designs... 7
Figure 2.2: Combined Cyclone Sections... 13
Figure 2.3: Wide Helical Insert . .'... 14
Figure 2.4: Exit Slit Base Unit... 14
Figure 2.5: Labeled Schematic of Combined Cyclone Sections... 15
Figure 4.1: Schematic of Aerosol Chamber... 23
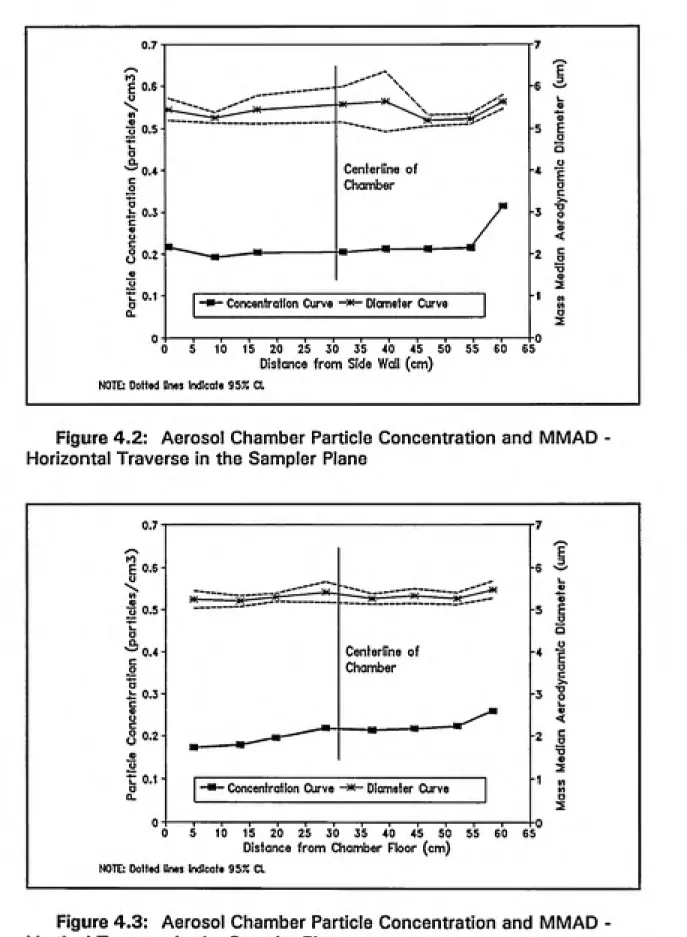
Figure 4.2: Aerosol Chamber Particle Concentration and MMAD
- Horizontal Traverse in the Sampler Plane ... 26
Figure 4.3: Aerosol Chamber Particle Concentration and MMAD
- Vertical Traverse in the Sampler Plane... 26
Figure 4.4: Schematic of Berglund-Liu Vibrating Orifice Monodisperse
Aerosol Generator... 28
Figure 4.5: Calibration Curve for VOMAG Liquid Feed System... 28
Figure 4.6: Schematic of TSI Aerodynamic Particle Sizer... 31
Figure 4.7: Excitation and Emission Spectrums for a 0.2 ywg/ml
Solution of Uranine in 0.01 N NaOH... 34
Figure 4.8: Calibration Curves... 34
Figure 4.9: Calibration Curves for In-line Rotameters ... 38
Figure 5.1: Graphical Results of Variable Flow Rate Experiment... 41
Figure 5.2: Separation Efficiency for the Thin Helix Design at
Various Cyclone Body Tube Lengths ... 46
Figure 5.4: Separation Efficiency for the Wide Helix Design at
Various Cyclone Body Tube Lengths ...47
Figure 5.5: Percent Enrichment for the Wide Helix Design at
Various Cyclone Body Tube Lengths ...47
Figure 5.6: Recovery Efficiency for the Thin Helix Design at
Various Cyclone Body Tube Lengths ...48
Figure 5.7: Recovery Efficiency for the Wide Helix Design at
Various Cyclone Body Tube Lengths ...48
Figure 5.8: Theoretical Separation Efficiency for Cyclone Sampling Inlet 52
Figure 5.9: Comparison of Simple Theory with Detailed Theoretical
Efficiency and Experimental Data...52
Figure 5.10: Particle Concentration versus Aerodynamic Diameter
for 47-mm Filter Cassette and APS...57
Figure 5.11: VOMAG Predicted Aerodynamic Diameter Versus APS
LIST OF ABBREVIATIONS
ANOVA
APS
ASHRAE
b
Bo
BLCKCAT
cC
cmg
cfm
dso
Da
d„,i.
f
f{0)
fpm
H
H2O
HEPA
I
lo
K, N
molar absorptivity for a sample at an exciting wavelength
analysis of variance
aerodynamic particle sizer
American Society for Heating, Refrigeration, and
Air-conditioning Engineers
sample path length along the axis of irradiation
distance to outlet cylinder wall from cente/line
variable block category
concentration of fluorescing material
concentration of the non-volatile solute dissolved in the
volatile solvent
cubic centimeters
Cunningham slip correction factor
cubic feet per minute
50% effective cut-off diameter
particle aerodynamic diameter generated by VOMAG
critical diameter for a particle to be separated past the outlet
cylinder
particle diameter
particle diameter generated by VOMAG
frequency
geometry depending on the effective solid angle
feet per minute
response characteristic of the detector
height particle will settle over chamber length
water
high efficiency particulate air filter
impurity concentration in alcohol
exciting radiation intensity
L
Ipm
L,
ml
mmm^
//m
MMAD
N
NaOH
nmK
P
PH
PTFE
Q
QCEFFO
a,
Re
RECEFF
RECEFFO
SAMPEFF
SAMPEFFO
SEPEFF
Stk
ucyclone body tube length
liters per minute
chamber length from last baffle to sampler location
milliliter
millimeter
cubic meters
micrograms
micrometers
mass median aerodynamic diameter
normal solution
sodium hydroxide
nanometers
number of turns made by gas in cyclone interior
pressure drop
concentration of hydrogen ions
polytetrafluoroethylene
sampler flow rate
variable corresponding to the filter cassette and APS ratio
minus 1
liquid feed rate
Reynolds number
variable corresponding to the cyclone recovery efficiency
RECEFF minus 1
sample fluorescence intensity at a given wavelength
variable corresponding to the cyclone sampling efficiency
SAMPEFF minus 1
variable corresponding to the cyclone separation efficiency
Stokes number
Uq maximum velocity for application of still-air sampling criteria
Vo cyclone inlet velocity
Vchamb-r Chamber air velocity
VOMAG vibrating orifice monodisperse aerosol generator
Vt, particle terminal settling velocity
"^^S^^p^"
LIST OF SYMBOLS
X particle relaxation time
H air viscosity
p particle density
^ 3.14159
p average density of oleic acid and uranine
X wavelength
e angle
I. INTRODUCTION
Bioaerosols have become a prominent safety and health issue with the
increased awareness of air quality in indoor environments and its effect on
the physical well-being on the occupational work force. However, the
hazards associated with bioaerosols have not been limited to indoor
environments. The assessment of exposure to infectious microbial agents
dates back as far as the study of microbiology. The interest with
non-infectious agents (specifically, microbial agents capable of eliciting
immunologic responses in susceptible individuals) has only surfaced within
the past couple of decades. Human exposure to microbial sensitizing agents
have been widely documented in agricultural situations and to a more limited
extent in the biotechnology industry (e.g. enzyme manufacturing and citric
acid production) [Strom and Blomquist, 1986; Kotimaa et al., 1984; Vincken
and Reels, 1984; Topping et al., 1985; Martinez et al., 1988]. With the
advent of genetic engineering or recombinant DNA techniques, new interest
has focused on the methodologies for sampling bioaerosols to assess risks
associated with releases of microorganisms from biotechnology processes.
There are several sampling instruments currently available for assessing the
viable microorganism concentration in the ambient air. These samplers
• Andersen Viable Cascade Impactor (six-, two-, and single-stage)
• Surface Air Sampler
• Biotest Reuter Centrifugal Sampler
• Slit-to-agar Sampler (e.g. Mattson-Garvin)
• All Glass Impinger
Only the slit-to-agar sampler is capable of producing results that include a
time factor. This is useful for assessing exposures from processes or
operations that produce periodic peak concentrations of microbial laden
aerosols. However, the slit-to-agar sampler is incapable of selective particle
size separation (unlike the Andersen six- and two-stage cascade impactors).
The concept was proposed to combine the best attributes of the Andersen
and slit-to-agar samplers into a novel bioaerosol sampler design. Two
"must" constraints on the design of this "new" sampler were selective
particle size separation and a time factor. Preliminary ideas included particle
impaction over a series of test tubes individually designed to collect
increasing particle size ranges and a rotating agar drum with various
sampling inlet designs (i.e. impactor slits or holes, filters, and cyclones) that
separate particles into various size ranges (for example, respirable and
non-respirable). Due to the focused escalation on the design of a particle size
separating inlet, the completion of a working sampler design within practical
proposal was submitted that encompassed the design and evaluation of the
sampling inlet for the Mattson-Garvin slit-to-agar sampler. Focusing this
study on the sampling inlet removes variability due to other aspects of
bioaerosol sampler design (i.e. the design of workable sampling pump and
motorized drive systems, the selection of construction materials that
facilitates effective sterilization, and the design of a sampling particle
impaction media surface or impingement liquid).
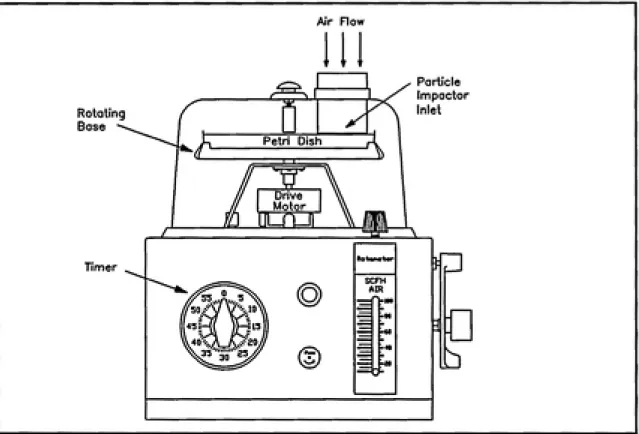
The premise behind the operation of the Mattson-Garvin slit-to-agar sampler
is based on inertial impaction theory. As a particle laden air stream suddenly
changes direction, the inertia of the particles will force them to continue
along their original path [Reist, 1984]. The impactor behavior is described
by a dimensionless parameter known as the Stokes number (Stk):
Stk= — (1)
W
where u is the velocity of the air through the slit of the sampling inlet
(Figure 1.1), W for rectangular openings is the opening half width, and x is
the relaxation time of an individual particle defined by the following
equation:
18 n ^P ""
air, Pp is the density of the particle, and C„ is the Cunningham slip
correction factor. A rotating base (which holds the oversized plastic petri
dish, 15 by 150 millimeter - mm) continually exposes a clean portion of the
agar surface to the incoming stream of air. The rotating base allows the
continuous enumeration of aerobic bacteria or fungi (based on the nutrient
media used) to be assessed over a specific time interval. The continuous
enumeration of microorganisms over time is similar to the "real-time"
instrumentation being used to assess chemical occupational exposures in
industrial settings [Gressel et al., 1988; O'Brien et al., 1989]. Four drive
motors of various speeds are provided with the sampler. These drive motors
are designed to provide sampling times of 5, 15, 30, and 60 minutes. The
sampler is manufactured with an internal pump assembly designed to
Rotating
Base
Timer
Air Flow
Petri Disln
Drive Motor
[TTP
Rota««t«r
Particle
Impactor
niet
o
lb
flSS*lli*!!WcK:.*sr.s^-^.-T.^^p5F-''?" s«ras!ii--- v
11 CYCLONE DESIGN
2.1 Literature Review
A cyclone configuration was selected as the best design for the sampling
inlet based on its ability to separate a single air mass, its relative high
separation efficiency, and its ease of use (sterilization, cleanup, etc.). Other
particle size classification devices were explored including cascade
impactors, elutriators, and centripetal devices, but only the virtual impactor
and axial inlet cyclone designs retain particle size fractions in the airborne
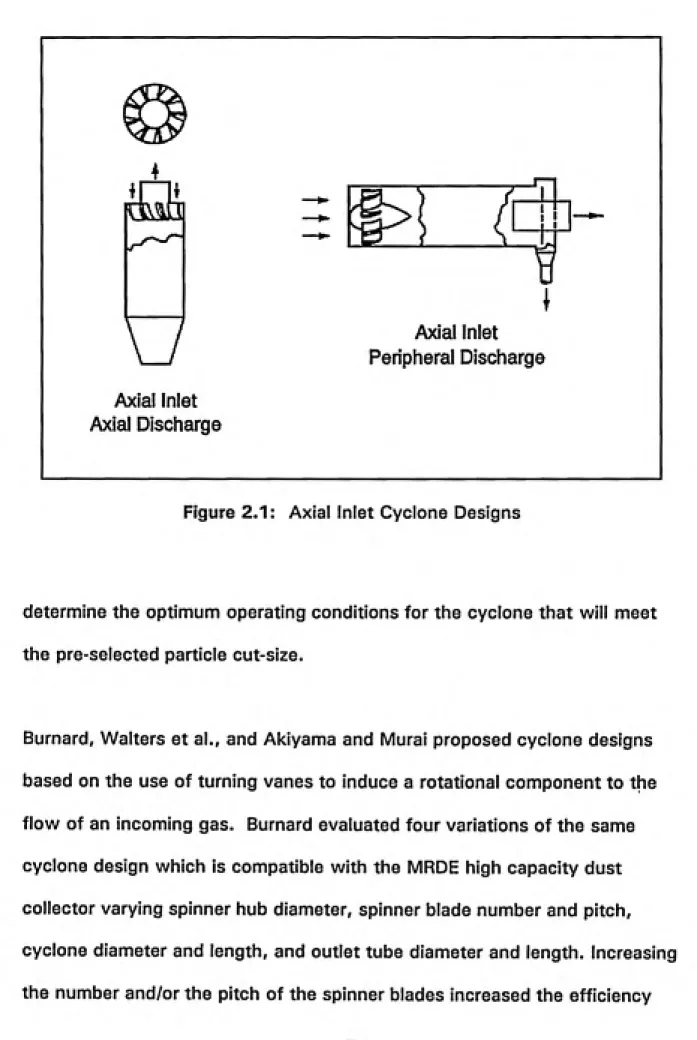
state. A cyclone with an axial inlet and a peripheral discharge was proposed
as the final sampling inlet design. Schematics of axial inlet flow cyclone
designs (using bladed swirl vanes) are shown in Figure 2.1 [Caplan, 1977].
An extensive review of the literature provided little information on the
theories of axial inlet (straight-through) cyclone design. However, a few
papers documented successful designs for industrial process and industrial
hygiene applications [Vaughan, 1988; Burnard, 1988; Akiyama and Marui,
mb]
VJ
Axial Inlet
Axial Discharge
^
Axial Inlet
Peripheral Discharge
Figure 2.1: Axial Inlet Cyclone Designs
determine the optimum operating conditions for the cyclone that will meet
the pre-selected particle cut-size.
Burnard, Walters et al., and Akiyama and Murai proposed cyclone designs
based on the use of turning vanes to induce a rotational component to the
flow of an incoming gas. Burnard evaluated four variations of the same
cyclone design which is compatible with the MRDE high capacity dust
collector varying spinner hub diameter, spinner blade number and pitch,
cyclone diameter and length, and outlet tube diameter and length. Increasing
and resistance of the system (the effect diminished progressively).
Collection efficiencies ranged from 85% to 95% for 6 to 12 blades 70
millimeters (mm) in width. Reducing the spinner hub diameter improved the
efficiency of the system while reducing air resistance. Variations of cyclone
and outlet tube diameters and lengths produced only marginal effects. It
should be noted that the designs of Burnard's systems included a water
spray nozzle prior to the entrance to the cyclone.
Walters et al. describes an axial flow cyclone designed to separate the liquid
water from clouds sampled by aircraft. Walters et al. notes that the turning
vane outlet angle is the controlling parameter for the amount of water
collected. Specifically, the more the flow is turned the greater the
streamwise acceleration and the greater the associated pressure drop.
Walters et al. theoretically examined the drop separation based on a critical
diameter of 5 micrometers (^/m). Virtually all liquid water content reached
the duct wall within 1/4 of the distance between the vanes and the
extraction slot.
Akiyama and Murai describes an enhancement to the axial flow cyclone
design that increases the swirl flow inside the cyclone. Akiyama and
Murai's design includes eight nozzles set on the duct wall which induces a
secondary air flow tangentially into the main cylindrical duct. Guide vanes
25°, 35°, and 45°. The cyclone was challenged with four dusts
(lycopodium, glass beads, fly ash-5, and fly ash-10) under controlled
conditions. Akiyama and Mural noted that large guide vanes generate
swirling flow more efficiently than small ones - less pressure drop. In
addition, the optimum duct length related to collection efficiency (as swirl
flow decays exponentially with axial distance) appears to be approximately
three times the diameter of the duct. The critical particle diameter (100%
collection efficiency) for the designed cyclone is approximately 10 fjm for fly
ash-5 and 15 jjm for the glass beads. The cut size (50% collection
efficiency) is approximately 4 fjm for the fly ash and the glass beads.
Vaughan describes an axial flow cyclone design using a thin helical turning
vane as opposed to the previous designs that used a series of blades to
induce a rotational component to the incoming air flow. The evaluation
included a number of variations of the cyclone design namely helix
configuration, body length, and flow rate. Chamber length had a
considerable effect on the collection efficiency, with the shorter chambers
giving higher collection efficiencies. Vaughan notes that for its size, at a
given flow rate, the axial flow cyclone design exhibits higher collection
efficiencies than the tangential flow cyclone design. Penetration curves for
a given axial flow cyclone configuration were extremely sharp. Based on the
penetration curves the following relationship was formulated for the 50%
'-'f^ •'•
where K and N are constants and Q is the flow rate. Attempts to correlate
the observed with the entry velocity or the Reynolds number met with
limited success. However, Vaughan proposed a more reliable (± 20%)
relationship between the dg^ and the pressure drop of the system P :
d^-^2^ (4)
Vaughan used flow visualization techniques of the internal processes of the
cyclone to explain qualitatively the results of the evaluations. Fluorescently
tagged aerosols and coal dusts were used to show where the bulk of
material came to rest within the cyclone. From the visualization techniques
it appears that the air exiting the helical channel executed a single turn
within the length of the cyclone. In addition, at higher flow rates, a distinct
ring of deposit was observed around the center underside of the helix insert.
Based an assessment of the literature, the cyclone design described by
Vaughan (helical versus bladed turning vane design) would provide the most
efficient fractionation of the respirable and non-respirable particles entering
into the modified sampler inlet. In addition, Vaughan's concept of a helical
insert is conceptually easier to machine (for the small scale required for the
inlet design specifications were based on theoretical design concepts and
the ability to machine various parts of the helical insert and the exiting slit,
2.2 Cyclone Design Criteria
Information related to the design of axial flow cyclones are limited to
isolated case studies which, in some cases, provide empirical theories on the
performance of such systems. However, it is possible to apply simple
cyclone theory as an initial approximation of the axial flow system design.
In a typical cyclone, particle bearing ambient air is introduced radially into
the upper section of the cyclone chamber causing a rotational component to
be added to the incoming flow of air. This rotational component will
accelerate particles in the air outward, by their inertia, to the chamber wall.
Larger particles will occupy the zone closer to the chamber wall while
smaller particles remain entrained in the vortex closer to the centerline of the
chamber. Based on certain parameters, the point of separation of respirable
and non-respirable particle size ranges can be predicted in the cyclone
chamber [Reist, 1984].
Assuming that a gas moves through the cyclone chamber as a rigid air
stream with a spiral velocity equal to the average velocity at the inlet, the
critical diameter (d^^ ) for a particle to be separated past the outlet cylinder
^crit =
(5)
where B^ is the distance to the outlet cylinder wall from the centerline, |x is
the viscosity of the air, p^ is the density of the particle, v„ is the cyclone
inlet velocity, and /V, is the number of turns made by the gas in the cyclone
chamber.
Based on this theoretical approach, estimates were made for a range of helix
inlet area dimensions capable of velocities (based on a flow rate of 28.3 Ipm
and an entry angle of 45°) that produce the desired 50% effective cut-off
diameter of 8 yc/m. This cut-off diameter was selected to duplicate the cut¬
off diameter for the Andersen two-stage viable impactor (designed to
produce respirable and non-respirable fractionations [Andersen Samplers,
Inc., 1976]). Two inlet areas were selected based on these estimates and
the practical limitations of the machining process. Cyclone body lengths
were selected as multiples (one, two, and three times) of the original
sampling inlet diameter. The diameter of the outlet tube was chosen at
random. The dimensions of the exit slit (designed to provide a cut-size of 1
fjm) are a function of the Stokes number (Equation 1) describing the
impaction of aerosol particles in an air stream interrupted by an obstacle. A
stable air streams into the slit and reduce the loss of particles to the bottom
of the cyclone.
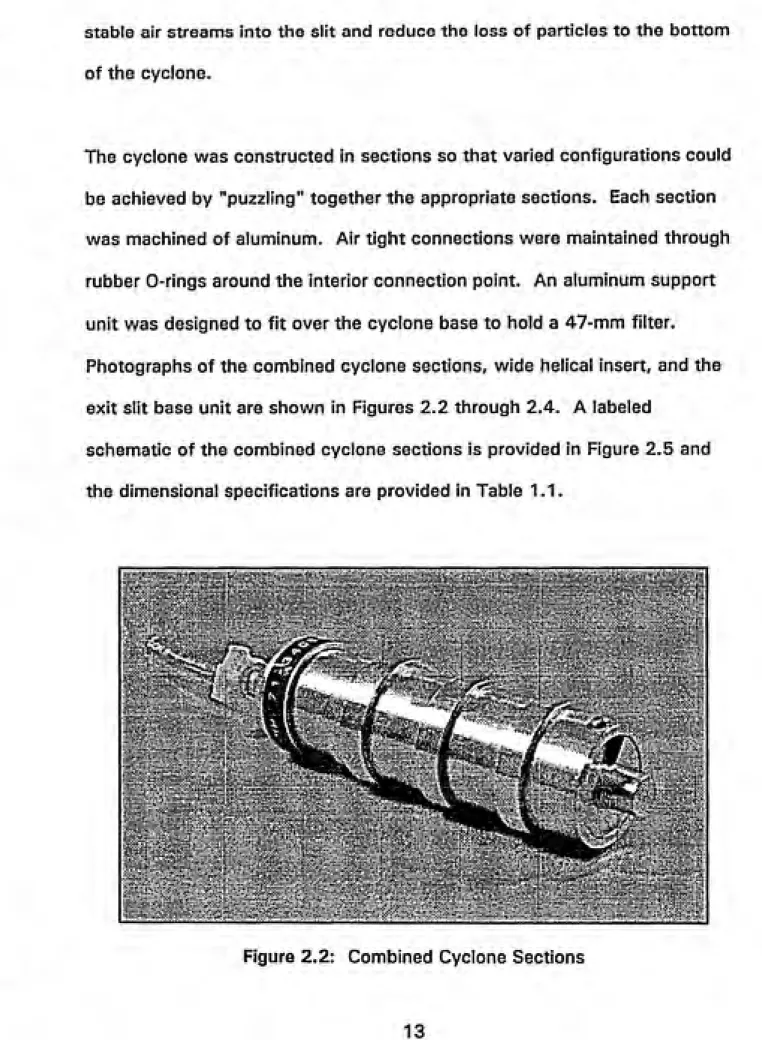
The cyclone was constructed in sections so that varied configurations could
be achieved by "puzzling" together the appropriate sections. Each section
was machined of aluminum. Air tight connections were maintained through
rubber 0-rings around the interior connection point. An aluminum support
unit was designed to fit over the cyclone base to hold a 47-mm filter.
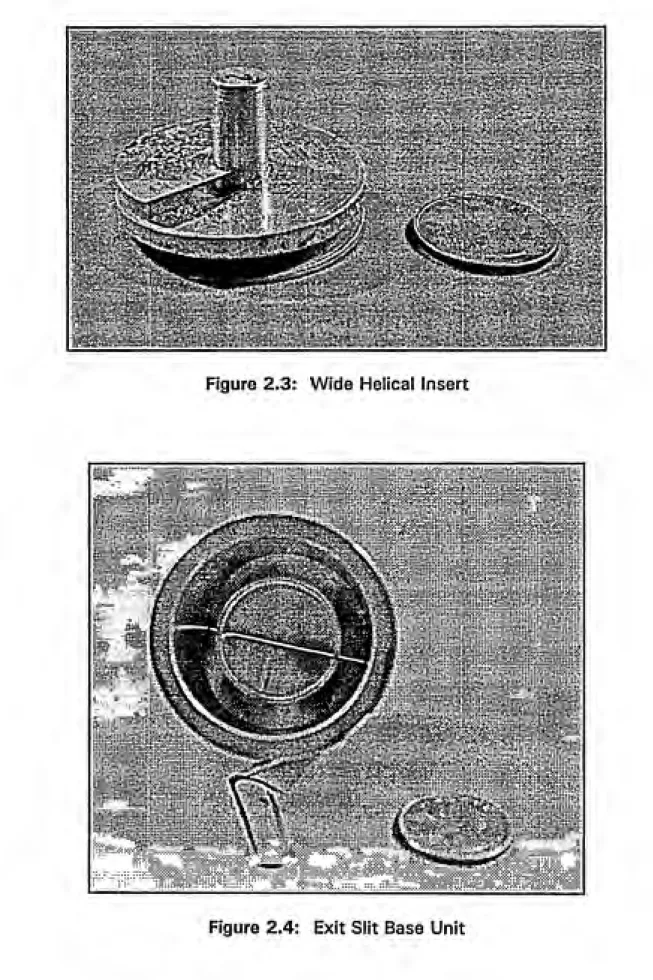
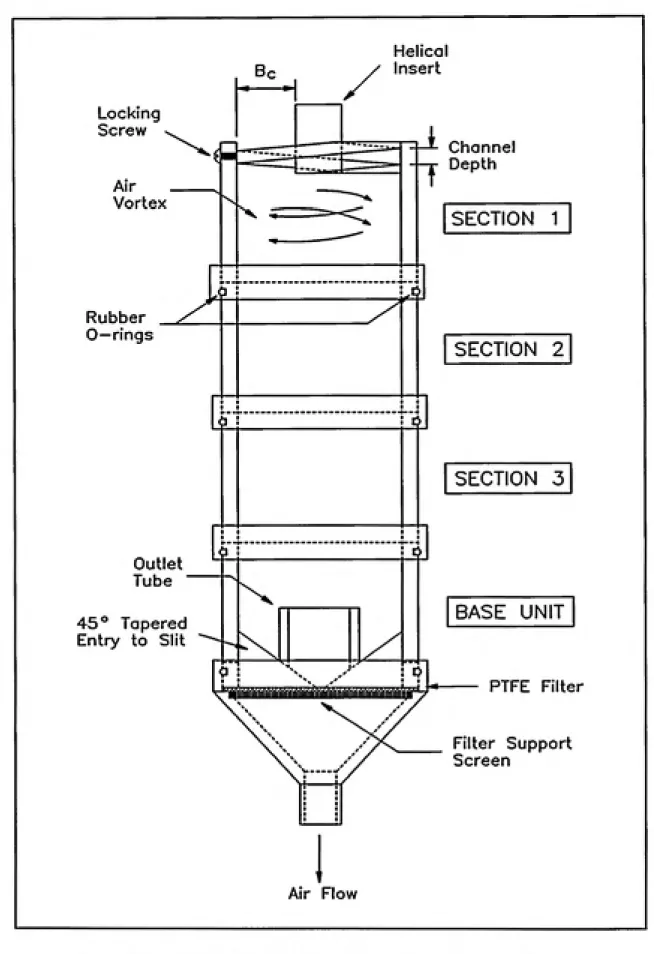
Photographs of the combined cyclone sections, wide helical insert, and the
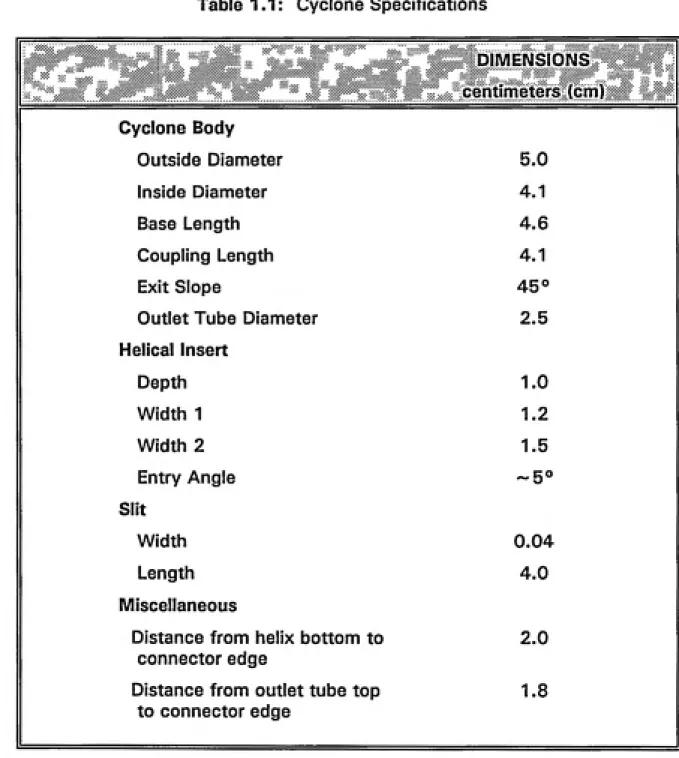
exit slit base unit are shown in Figures 2.2 through 2.4. A labeled
schematic of the combined cyclone sections is provided in Figure 2.5 and
the dimensional specifications are provided in Table 1.1.
,^Ai»:Srr?
...I'- ͣ'*
Figure 2.3: Wide Helical Insert
Locking
Screw
Air
Vortex
Rubber
O—rings
Outlet _
Tube
45° Tapered
Entry to Slit
Be
0 :
<3 :
<i :
Air Flow
Helical
Insert
Channel
Depth
SECTION 1
---.^--4
Lc>
SECTION 2
! [>
SECTION 3
: 4
BASE UNIT
PTFE Filter
Filter Support
Screen
Table 1.1: Cyclone Specifications
DIMENSIONS
centimeters (cm) |
1 Cyclone Body
1 Outside Diameter
5.0
1 Inside Diameter
4.1
Base Length
4.6
1 Coupling Length
4-1
1 Exit Slope
45°
1 Outlet Tube Diameter
2.5
Helical Insert
Depth
1.0
Width 1
1.2
Width 2
1.5
1 Entry Angle
-5° 1
Slit
Width
0.04
1 Length
4.0
II
1 Miscellaneous
1 Distance from helix bottom to
2.0
1 connector edge
1 Distance from outlet tube top
1.8
Ill OBJECTIVES AND HYPOTHESIS
The primary objective of this project is the modification of the sampling inlet
of the Mattson-Garvin slit-to-agar bioaerosol sampler to enable this sampler
to provide data (particle size fractionation and concentration over time) on
microorganism bearing particles in the ambient air. To accomplish this
objective, determinant variables affecting the ability of the modified sampler
to detect the general ambient aerosol concentration under specific conditions
must be identified and evaluated. Some of the identified determinant
variables may not be quantitatively amenable to evaluation, if at all. For
example, temperature and humidity are measurable but not practically
controllable variables. The dependent variables include:
Environmental Air (Direction and Speed of Air Movement) - relative
vector of airstream motion of the ambient sampling atmosphere
Particle Size Distribution - frequency distribution of particle sizes in the
ambient air stream
Humidity - relative water content of air as determined by wet and dry
bulb readings (psychrometer)
Surrounding Activity - natural occurrences (e.g., meteorological,
radiant energy, etc.), human events, evolution of process by-products,
etc., that effect the content, quality or other measurable parameters
of the ambient air, and of which the sampling personnel have little or
no control
IVIicrobiai Viability - capability of vegetative cell proliferation and the
capacity to elicit competent biochemical responses of the given
species
Sampler Sterility Between Samples - elimination of vegetative growth
and spore-forming activity of microorganisms on critical surfaces by
autoclaving or other sterilization techniques
Operator Sampling Technique - performance of sample collection,
handling, storage, and analyses, according to standardized or
accepted practices
Consideration of all the determinant variables (quantitatively and/or
research project. However, a systematic evaluation of an individual
determinant variable excluding the effects of the others can offer more
insight into the sampling efficiency of the modified sampler. In particular,
some these variables are not applicable to an evaluation of the sampling inlet
at the exclusion of the sampler as a whole. The excluded variables include
microbial viability, effective sampler sterility between samples, and, for
practical purposes, temperature and humidity. A working hypothesis that
summarizes the primary objective can be stated as:
"The axial flow cyclone sampling inlet design is capable of efficiently
fractionating particles into respirable and non-respirable size ranges
(50% effective cut-off diameter at 8 jjm). In addition, this modified
sampling inlet is capable of collecting ambient aerosol particles as
efficiently as the 47-mm filter cassette over a range of particle sizes
under the same experimental conditions."
The hypothesis was tested for separation efficiency and sampling efficiency
by performing independent comparisons of six cyclone configurations
(varying helix inlet cross-sectional area and cyclone chamber length) to a
reference sampler, the 47-mm filter cassette. The filter cassette, under
"calm wind" conditions, has been shown to exhibit a sampling error of less
"'3!«%i^np^;"!»jj;?5!'=«r-systematic differences or bias in the measured concentrations of aerosol
sampled as a function of the separation efficiency on the cyclone filter and
relative to the filter cassette (recovery efficiency). The null hypotheses to be
tested are that (1) the separation efficiency mean is 50% at 8 //m and (2)
the ratio mean between the cyclone and the reference sampler is 1 over a
IV CONDUCT OF EVALUATIVE EXPERIMENTS
The evaluation of each cyclone configuration was made under controlled
experimental conditions to limit the effects of certain determinant variables
to better comprehend the system operating characteristics. Using a
horizontal aerosol chamber designed for the systematic evaluation of
particulate air samplers, cyclone configurations were individually placed
(side-by-side with a 47-mm filter cassette) in the interior downstream end of
the chamber [Martinez, 1991; Jensen, 1991]. Monodisperse aerosol
particles of oleic acid tagged with a fluorescent dye (uranine) were
generated at the upstream end of the chamber using the Berglund-Liu
vibrating orifice monodisperse aerosol generator (VOMAG). The TSI
Aerodynamic Particle Sizer (APS) was used, at the sampler location, to
verify particle size and aerosol generating system operation. The
4.1 EXPERIMENTAL EQUIPMENT
4.1.1 Aerosol Chamber
Vertical laminar flow aerosol test chambers have been described in the
literature for evaluation and calibration of sampling instruments [Marple and
Rubow, 1983; Hinds and Kraske, 1987]. However, the aerosol chamber to
be used in this study was designed with a horizontal axis similar to the
American Society of Heating, Refrigeration, and Air-conditioning Engineers
(ASHRAE) air cleaner standard test duct [ASHRAE Handbook, 1983]. The
chamber is composed of a stainless steel duct of approximately 366 cm in
length and having a square cross-section of 61 cm in length on each side (a
schematic diagram is shown in Figure 4.1). High efficiency particulate air
(HEPA) filters were placed at the inlet and outlet of the chamber to provide
an uncontaminated flow of air to the samplers. Two baffles were after the
point of aerosol introduction to provide a uniform particle concentration
across the cross-sectional face of the chamber. Access to the chamber
interior was facilitated through a plexi-glass observation window held in
place with clamps. The aerosol chamber was designed to give an air
velocity at the point of the sampler challenge test of approximately 25 to 50
centimeters per second (cm/sec) resulting in a volumetric flow rate of 340 to
680 cubic meters per hour (m^/hr) of air. For a flow rate of 340 m^/hr the
resultant air velocity, obtained by conducting horizontal and vertical traverse
with a thermoanemometer (KURZ 1440, Kurz Instruments, Inc., Monterey,
ͣ
122 cm-
244 cm
2 feet
HEPA Filter
0% Hole Baffle
20% Margin Baffle
Aerosol
Introduction
Sampler
Air Flow
Ls
Flow
Straighteners
APS
HEPA Filter
aiit>-y
Ls = distonce from second baffle to
sampling plane
H3 = height of sompling inlet
velocity of 57 ± 1 cm/sec. This low velocity falls within the still-air
sampling criteria (reminiscent of real-world conditions) as defined by the
following equation [Hinds, 1982]:
u.^l
( Q V/3
Utit^J
(6)
where (/„ is the maximum air velocity for which the still-air sampling criteria
can be used, Q is the sampler flow rate in cmVsec, and x is the particle
relaxation time for a given diameter [Hinds, 1982]. For 10 //m diameter
particles (unit density spheres) at a sampler flow rate of 28 Ipm, the
maximum allowable air velocity to meet the criteria is approximately 145
cm/sec.
Elutriation, which is an inevitable consequence of the decay of an aerosol
particle trajectory along the critical path of a horizontal duct, should not be a
problem for the particle size ranges to be encountered in this study. The
height (H) that a particle will settle over the chamber length from the last
baffle plate to the sampler inlet location (I,) is given by the following
equation:
L V
H = ' '' (7)
^chamber
particle with a diameter of 10 /jm will settle 2.8 cm from the last baffle plate
to the sampler inlet. The Reynolds number (Re) associated with flow of air
inside the chamber is governed by the following equation [Reist, 1984]:
p = P^ chamber (8)
where w is the chamber width is feet, p is the density of the air, and \i is
the viscosity of the air. For a chamber air velocity of 25 cm/sec (flow rate
of 340 m^/hr), the Re is in the turbulent regime (10,200, where greater than
4000 is turbulent).
Horizontal and vertical chamber traverses were conducted in the sample
plane using an Aerodynamic Particle Sizer (a narrative of the instrument
operation can be found in section 4.1.3) which provided real-time detection
of aerodynamic particle size and particle concentration. The resultant data
from the traverses are graphically presented in Figures 4.2 and 4.3. The
mass median aerodynamic diameter (MMAD) for horizontal and vertical
traverses for the aerosol chamber design were measured to be 5.37 /ym ±
0.08 fjm and the mass concentration was measured to be 0.22 ± 0.01
particles/cm^.
4.1.2 Aerosol Generation
A Berglund-Liu vibrating orifice monodisperse aerosol generator was used to
0.7 O Q. c o o i 0.3 c V o
5 0.2
J) o o 0.1 Centerline of Chamber ͣConcentration Curve -^*^ Diameter Curve
10 15 20 25 30 35 40 45 50
Distance from Side Wall (cm)
NOTE: Dotted lines indicate 95% CI.55 60 65
0) ^— (D
E
o b o'£
D C >^ T3 O 4> < C _o TJ IS 2 o 2Figure 4.2: Aerosol Chamber Particle Concentration and MMAD
Horizontal Traverse in the Sampler Plane
0.7 ^0
E 0.6
o \ « o 0.5 o a 0.4 0.3 « o c o o 0.2 o Q. 0.1 Centerline of Chamber ͣConcentration Curve -*- Diameter Curve
10 —I— 15 —I— 25 —I— 30 —I— 35 -5 -3 -1
20 25 30 35 40 45 50
Distance from Chamber Floor (cm)
NOTE: Dotted lines Indicate 95% CI.
55 60 65
0) "id
£
o o o E a c >-ͣ o o « < c g o n n owith a nominal aerodynamic diameters of 3, 4.5, 6, 8, 10 //m [Bergiund and
Liu, 1973; Willike, 1975]. The VOMAG operates through the combined
contributions of four parts: the liquid feed system, the droplet generator, the
droplet dispersion system, and the aerosol flow system (Figure 4.4). The
liquid feed system forces a liquid (consisting of a mixture of alcohol, oleic
acid, and uranine) through a membrane filter into the droplet generator at a
constant rate. For this study, a 50 cubic centimeter (cm^) syringe was
pressurized with desiccated, filtered air, which provides a stable feed rate to
the droplet generator. The calibration curve relating pressure (kiloPascals
-kPa) and liquid feed rate (cubic centimeters per minute - cm^/min) is shown
in Figure 4.5. The droplet generator houses a 20 //m orifice disc through
which the liquid flows. An AC voltage is applied to the piezoelectric ceramic
which vibrates the disc and disturbs the liquid jet at a constant (selectable)
frequency. The dispersion air from the droplet dispersion system creates a
turbulent air stream which forces the enveloped droplet stream into a
dispersed conical shape. The aerosol flow system uniformly disperses the
droplets and allows the alcohol to volatilize leaving individual droplets of a
specific, predetermined size. From Bergiund and Liu, the size of the
individual particles (Dp) can be computed from the following formula:
Dp = C"^
< T^f J
(9)
where Q, is the liquid feed rate in cubic centimeters per minute, / is the
Piezoelectric Ceramic
Orifice Disk
Dispersed
Droplets
Drain
Tube
Dispersion
Air
Q
Liquid
Feed
AC Signal
Figure 4.4: Schematic of Berglund-Liu Vibrating Orifice Monodisperse
Aerosol Generator
220
-
200-^/
180-o
^160-4>
^
UO-/yHi
r' =0.9350 1
/ ^
in4)
/
Ql 120-
*/
C
5k/
:j 100-
X
'^
80-/
60-/
40- 1 1 tw
0 0.1 0.2 0.3 0.4 0.5
Liquid Feed Rate (cm3/min)
concentration of the nonvolatile solute dissolved in the volatile solvent. The
diameters of particles generated by the VOMAG can be calculated, from the
above equation, to less than a 1 % error from the generator operating
conditions. The stability of the generated aerosol has been determined to
have a variation in concentration less than 3% [Berglund, 1972]. Due to the
importance of keeping the orifice disc clear of particulate matter, all reagents
used in this investigation were of spectroscopic grade and solutions
underwent series filtration through two 0.45 //m pore size membrane filter.
However, some particulate matter remained suspended in solution as
determined by generation of aerosol particles of filtered alcohol and
subsequent particle size analysis with the APS. Treating the addition of
uranine as an impurity, the aerodynamic diameter (D,) can be computed
from:
D, = {{C^l.U)Dpyi^^^ (10)
where C is the volumetric concentration of oleic acid in alcohol, / is the
concentration of impurities in the alcohol, U is the concentration of uranine
in solution, and p^^g is the average density of the oleic acid and uranine.
A series of static eliminators was placed around the base of the dilution
column (approximately 5.1 cm above the point of aerosolization) to
neutralize the charge of the aerosol particles before entering the chamber.
cm short of centerline to account for the momentum of the particles in the
lateral direction (i.e. perpendicular to the flow of oncoming chamber air).
4.1.3 Verification of Aerodynamic Diameter
Real-time detection of the aerodynamic particle size and particle
concentration in the aerosol chamber were conducted in the sample plane
using an Aerodynamic Particle Sizer (APS 33B, TSI, Inc. Minneapolis, MN).
The APS accelerates aerosol particles through a nozzle which then pass
through a laser velocimeter (Figure 4.6) [Chen et al., 1985; Ananth and
Wilson, 1988; Griffiths et al., 1986]. The inertia of the particles causes the
particles to lag behind the downstream air from the nozzle. The extent of
the lag between the particle velocity and the gas velocity is based on the
aerodynamic diameter of the particle. The APS was originally calibrated
with Polystyrene Latex spheres (solid particles), therefore the effect of liquid
droplet deformation in the sample air stream will indicate particle diameters
smaller than that predicted by the VOMAG [Baron, 1986]. However, the
droplet deformation would not affect the particle count. The duration of
each APS sampling period was 10 minutes.
4.1.4 Sample Analysis
Total Flow
5 Ipm
1 1 1
Aerosol1 Ipm
4 Ipm
Filtered
Sheath Air
Laser Beams
Figure 4.6: Schematic of TSI Aerodynamic Particle Sizer
concentration and fluorescence, it is possible to construct a calibration curve
based on a standard. During the process of aerosolization from the VOMAG,
the alcohol volatilizes leaving fluorescently tagged oleic acid particles. These
particles can then be quantified in solution based on the resultant
fluorescence produced. The method is pH sensitive (optimal pH is
approximately 10). A Perkin-Elmer fluorescence spectrophotometer (Mode!
650-1 OS) was used to quantify the amount of aerosol that had been
collected by the cyclone and 47-mm filter cassette. This instrument is
specifically designed for the measurement fluorescence excitation and
emission spectra. The light source is a 150-watt xenon lamp. Both grating
20 nanometers (nm). The sample is irradiated by the light from the
excitation monochromator in the 220 to 830 nm wavelength range. The
emitted light from the sample passes through the emission monochromator
(selective measurement of intensity is 220 to 820 nm) to a photomultiplier
detector [Perkin-Elmer, 1978].
The relationship between fluorescence intensity and concentration has been
well described [Underfriend, 1962; Hercules, 1966; Guilbault, 1973]:
{S,), = mg{\)l^^fabc
^ abc abc abc"
21 3! (/7+1)!
(11)
where {Sf)j^ is the sample fluorescence intensity at a given wavelength, /(6)
is the geometry depending on the effective solid angle, g{X) is the response
characteristic of the detector (varies with wavelength), /q is the intensity of
the exciting radiation, 4>/ is the quantum efficiency of the molecule, a is the
molar absorptivity for the sample at the exciting wavelength, b is the sample
path length along the axis of irradiation, and c, is the concentration of the
fluorescing material in moles per liter. In situations, as were encountered in
this study, where the concentration of fluorescing material is very small (abc
< 0.05) the equation reduces to:
solution of uranine In 0.01 N Sodium Hydroxide (NaOH) to determine the
optimum excitation and emission wavelengths (shown graphically in Figure
4.7). Calibration curves, for the low and normal photomultiplier tube gain,
were then developed using a stock solution of 20 //g/ml uranine and 0.01 N
NaOH. This solution was added to 0.01 N NaOH to produce sequential
dilutions of 0.1, 0.05, 0.01, 0.005, 0.001, 0.0005, and 0.0001 /yg/ml. The
resultant calibration curve is shown in Figure 4.8.
For the analysis of the filter samples, the fluorescence spectrophotometer
slit widths were set at 5 and 10 nm for the excitation and emission
wavelengths, respectively. The narrower excitation slit width was selected
to guard against photo-chemical reactivity of the sample solutions. The
excitation wavelength was reduced to 484 nm, which is below the optimum
wavelength of 492 nm as determined by the spectral scan. The reduction of
the excitation wavelength and the narrower excitation band pass promoted
the minimization of interference of Rayleigh scatter peaks with emission
peaks due to the close proximity of the excitation and emission peaks
[Perkin-Elmer, 1978]. The optimum emission wavelength of 512 nm was
used for all analyses.
1.4-512 nm A
1.2-Excitation
1
-i=
0.8-0 >
Emission
Response
o o *. at
11492 nm J \
0.2-
/ l\
0-
—.=.—JA V,
-0.2-2C0 300 400 500 600
Wavelength (nm)
700 800
Figure 4.7: Excitation and Emission Spectrums for a 0.2 jt/g/ml Solution of
Uranine in 0.01 N NaOH
1200
0» 800
r^ = 0.99987
0.99976 4) 600
(S 400
ͤLow PM Gain
Normal PM Gain
0.02 0.04 0.06 0.08 0.1
Uranine/NaOH Concentration (ug/ml)
two outer sections and the inner section are represented by two tangentially
intersecting lines at the diameter of the cyclone exit tube. The outer and
inner sections were separately placed in two separate glass jars for later
analysis. The filters from the cyclone or the filter cassette were placed face
down in each jar. For the cyclone sample, 15 ml of 0.01 N NaOH was
added to each outer and inner section jar. For the filter cassette sample, 30
ml of 0.01 N NaOH was added to each jar. The samples were then placed
in an ultrasonic bath for 30 minutes. Analysis in the fluorescence
spectrophotometer was facilitated by placing approximately a 4 ml aliquot of
the sample solution into a cuvette. Response readings from the digital
display were converted to units of /jg/m^ of air based on the calibration
curve. The selection of the filter media, wash-off solution, and analytical
technique were based on the results of Tseng [Tseng, 1991]. Tseng
conducted experiments evaluating the effects of two filter medias (glass
fiber and PTFE filters) and various wash-off solutions (HjO with and without
a buffer, 0.001, 0.01, and 0.1 N NaOH solutions, and ethanol with and
without a buffer). Tseng found (1) no background reading from PTFE filters,
(2) 0.01 N NaOH is a suitable solvent for PTFE filters based on its high
'Wmvww
4.2 EXPERIMENTAL DESIGN
Preliminary investigation of the operating characteristics of the modified
sampling inlet revealed shortcomings related to its sampling efficiency. At a
VOMAG generated particle size of 12 pm, tandem sampling runs with a
single cyclone configuration and the 47-mm filter cassette resulted in
sampling efficiency of less than 0.05% and separation efficiencies
inconsistent with the design aspects of the cyclone. Based on these
observations, a series of experiments were initiated to investigate the effect
of various cyclone flow rates to improve the sampling efficiency of the
system. Experiments to evaluate the effect of cyclone configurations on the
separation efficiency were then conducted after the determination of an
optimum flow rate.
Each sampler (i.e. cyclone, 47-mm filter cassette, and APS) was oriented in
the chamber so that the midline of the sampler is facing the aerosol
generator output source at a predetermined reference point. This particular
sampler orientation resulted in isoaxial sampling. The criteria of isokinetic
sampling are not applicable here due to the still-air sampling assumption. All
sampling devices were located 276.9 cm downstream of the second
located 43.2 cm above the chamber floor and 12.7 cm from the chamber
wall to the right of the cyclone. The 47-mm filter cassette and the APS
were operated at flow rates of 14 and 5 Ipm, respectively. The filter
cassette was fitted with a 2.5 cm diameter cone to provide a "sharp-edged
orifice" entry.
A rotameter (Cole-Parmer, Chicago, Illinois) was placed in-line between each
sampler (i.e. cyclone and 47-mm filter cassette) and rotary pump (used to
pull the required volumetric flow of air). The cyclone and the 47-mm filter
cassette were calibrated over a range of flow rates, from 0.9 to 34.3 Ipm,
using a 150 liter spirometer. All calibration measurements were made with
the PTFE filters inserted into the appropriate sampling device. Desired
adjustments to the sampler flow rate during experimental runs were made
based on the rotameter calibration curve. The calibration curves are shown
in Figure 4.9.
4.2.1 Variable Flow Rate Experimental Design
A single cyclone configuration (wide helix cross-sectional inlet area and
medium cyclone body length) was used to evaluate the effect of varying
flow rates on the collection efficiency of the system. Each experimental run
(one cyclone configuration) was conducted in tandem with the 47-mm filter
cassette and the APS over a 15 minute sampling period. Six experimental
40 n
35-
30-Q.
^20-0)
-4-o
0=
15-o
^
10-
5-
0-
-5-C
0
r^ = 0.9883
Filter Cassette
Cyclone
...5^
^'^^^^ r2 = 0.9935
1 20 40 60 80 100 120
, Rotameter Reading
140
16
Figure 4.9: Calibration Curves for In-line Rotameters
14.1 /ym and by varying cyclone flow rate at levels of 7, 14, and 28 Ipm.
Experimental study blocks were designated over a full day with all flow rates
being evaluated three times at a specific particle size on any given day. The
sequence order for flow rates within a given day were randomly allocated.
In addition, particle size was randomly selected over successive days of
experimental sampling. The experimental design allowed 6 repetitions at a
specific flow rate and particle size.
collection efficiency of the cyclone. Each experimental run was conducted
in tandem with the 47-mm filter cassette and the APS for a 15 minute
sampling period. Thirty experimental conditions were studied by varying
helix cross-sectional inlet area at two levels, clone body length at three
levels, and particle size at levels of 3.6, 5.3, 7, 9.3, and 11.8 fjm.
V RESULTS AND DISCUSSION
5.1 Variable Flow Rate Experiment
The summary results of the experimental runs evaluating the effect of
different sampler flow rates on sampling efficiency is presented in tabular
format in Table 5.1 and graphically in Figure 5.1. The individual results are
presented in the appendix.
Table 5.1: Summary Results of Variable Flow Rate Experiment
Aerodynamic
Particle
Size (/jm)
Flow Rate
(Ipm)
Sampling Efficiency
Mean
Standard
Deviation
3.5
7
60.2%
7.3%
14
54.3%
2.8%
28
28.8%
1.4%
9.4
7
43.3%
2.6%
14
6.3%
0.7%
28
<0.1%
<0.1%
14.1
7
10.4%
2.0%
14
<0.1%
<0.1%
28
<0.1%
<o.i% 1
To facilitate statistical analysis, the concentration for the cyclone was
divided by the paired measurement from the 47-mm filter cassette to
70% 1
60%-
>.50%-c
•-•^
40%-
*-UJ
c
~30%-—
0
"20%-
10%-
o%-1
1,
0-Q—
7 Ipm
-Ar-14 Ipm
-«—
28 Ipm
10
Aerodynamic Diameter (um)
1C
Figure 5.1: Graphical Results of Variable Flow Rate Experiment
the system). A separate variable, SAMPEFFO, was subsequently created by
subtracting the value 1 from SAMPEFF. Complete agreement in measured
levels between the cyclone and the filter cassette would imply that all
differences are from a population with a mean of zero (the cyclone and the
filter cassette obtain the same concentrations of the sampled air or
SAMPEFFO = 0). Agreement, except for a stable or consistent bias, would
imply the same result but the mean of the response variable would be non¬
zero. Systematic differences in measurements (bias due to flow rate and/or
A two-way Analysis of Variance (ANOVA) was used to determine the
agreement between the cyclone and the filter cassette using the response
variable SAMPEFFO. First, the null hypothesis of no overall bias is tested by
reference to the F-ratio for all effects in the model, i.e. the flow rate effect,
the particle size effect, and the intercept. Lack of significance at the 0.05
level indicates no statistical difference of the population means. No further
statistical testing is conducted in this case. A significant F-ratio indicates
the presence of some bias. If this test indicates the presence of a bias, it
could be a consistent bias of the same magnitude for all flow rates and
particle sizes or that the level of bias varies among the three flow rates
and/or three particle sizes. A significant flow rate and/or particle size
indicates the latter condition. If particle size is not significant, it is
meaningful to test for a consistent bias by testing that the grand mean,
intercept, is zero.
The results from the statistical analyses indicate that the overall bias was
significant (p< 0.001) and the variation of bias by flow rate and/or particle
size was significant (p<0.001). The mean bias was negative, at the 0.05
significance level (p<0.001), indicating that the cyclone underestimates the
filter cassette. In addition, a significant bias (p< 0.001) was detected for
the interaction between flow rate and particle size.
designed value (28 Ipm) can improve the sampling efficiency of the system.
These results gain further validity upon observation of the helical insert. A
deposit of uranine was visible below the entry lip to the helix at the higher
flow rates and larger particle sizes. The entry to the helix may act as an
impaction device, whereupon larger particles cannot make the high velocity
turn from the ambient air stream into the vortex of the cyclone. The entry
lip deposit was not as pronounced or non-existent for the low flow rate (7
Ipm) and the smallest particle size investigated (3.5 jjm). Based on these
analyses and observations, the flow rate of the cyclone was reduced to 7
Ipm for the investigation of the various cyclone configurations. It was
suspected, prior to the initiation of the cyclone configuration study, that a
reduction of the cyclone flow rate would shift the separation efficiency
curve to the right, effectively increasing the value of the 50% cut-off
diameter. Even at this reduced flow rate of 7 Ipm, the cyclone system will
under-estimate the concentration inside the chamber as compared to the
filter cassette based on the results of the flow rate study. However, the
continued evaluation of the system will reveal the cyclones ability to
function as designed, i.e. aerosols will move to the walls of the cyclone,
hence, be separated into two zones of collection on the filter based on the
particle aerodynamic diameter.
5.2 Various Cyclone Configurations
various cyclone configurations on separation efficiency and recovery
efficiency is presented in tabular format in Table 5.2 and graphically in
Figures 5.2, 5.4, 5.6, and 5.7. The separation efficiency calculated on an
equal area basis (termed percent enrichment) is graphically presented in
Figures 5.3 and 5.5. The general trends between sampling efficiency and
percent enrichment remain consistent, however, percent enrichment
indicates higher values. The higher values are the result of a smaller area on
the outer filter zone available for particulate collection. The use of
separation efficiency or percent enrichment for the statistical analyses will
not affect the conclusions. The term recovery efficiency is used in place of
sampling efficiency because this experiment includes the separation of the
cyclone filter. The physical division of the filter may reduce the apparent
sampling efficiency of the system. The individual results are presented in
the appendix.
5.2.1 Statistical Analyses of the Cyclone Separation Efficiency
The statistical analyses used to assess the effect of the various cyclone
configurations on the separation efficiency of the system were very similar
to those used in the variable flow rate experiment. The particle
concentration in the outer zone of the cyclone filter was divided by the
particle concentration on the entire filter to create a variable SEPEFF
(corresponding to the separation efficiency of the system). Systematic
Table 5.2: Summary Results of Various Cyclone Configurations
Helix
1 Design
Cyclone
TubeLength
Aerodynamic
ParticleSize iijm)
Separation
Efficiency
Recovery
Efficiency
Mean
ͣ
..;:::::STa;..,
Mean STDThin
Short
3.6 15.5 2.4 54.8
2.1 1
5.3 21.1 6.5 74.6
9.6 1
7 29.7 16.1 54.9 5.3
9.3 31.0 3.3 32.0 6.8
11.8 33.3 7.6 15.9
1.1 1
IMedium
3.6 18.4 4.5 59 1.4
5.3 19.9 8.3 67.4 15.2
7 29.6 9.0 56.5
3.1 1
9.3 23.0 3.2 31.9 8.0
11.8 27.7 5.0 16.3 4.4
Long
3.6 15.5 1.9 54.5
5.7 1
5.3 16.4 10.4 68.9 15.7
7 20.8 3.1 57.6 4.4
9.3 21.1 5.3 32.5
6.0 1
11.8 23.9 5.4 16.5 2.0
Short
3.6 16.0 1.1 60.2
4.9 1
5.3 17 7.2 63.9 7.3
7 29.2 9.8 65.8
6.4 1
9.3 26.2 1.5 46.9 6.0
1 Wide
1
11.8 32.5 2.9 32.7
1.7 II
IVIedlum
3.6 21.2 6.2 65.1
3.6 1
5.3 22.0 13.3 64.4 26.8
7 23.9 7.4 58
8.7 1
9.3 24.4 2.3 44.8 3.4
11.8 20.7 5.0 35.9
4.1 1
Long
3.6 15.9 2.7 57.1
3.3 II
5.3 13.8 7.6 69.8
12.1 II
7 22.1 7.4 61.0 2.6
9.3 23.0 4.9 47.0 3.6
35%
/
ͣ
30%
r
>.
/\ A
c/ \ /
-H-
|25%-
**-UJ
/ V
Short Body
-A-Medium Body
o
jff /
-s-
o20%- 0-4)
A. r
Long Body
%^
--
15%1 0%
-1 10
Aerodynamic Diameter (um)
100
Figure 5.2: Separation Efficiency for the Thin Helix Design at Various
Cyclone Body Tube Lengths
110%n
100%
/
H- 90%
i
o80%-1.
c LiJ
•£70%-»
"2
60%-W^^
ͣ
/y
-B-Short Body
Medium Body
-s-Long Body
v/
50%
i^
40%
1 10 1C0
Aerodynamic Diameter (um)
35% n
30%-/
>'^
l\J
o/
-B-^25% J
/^a/
Short Body
*•-Ul
r^'\2\
-A-c
^-^f W^^x
Medium Body
o
A—^^/ r V
^1-
B20%-
O-<D
V)
/ /
Long Body
_j/
r
15%-:^ : \ •.:
1 0% H
1 10
Aerodynamic Diameter (um)
100 1
Figure 5.4: Separation Efficiency for the Wide Helix Design at Various
Cyclone Body Tube Lengths
110%-
100%-J
^
90%-c «
E
K
/ \l ¥
-e-o
80%-c iij
\J
Short Body
Medium Body
t
70%-<D
°-
60%-a^WTv
Long Body
j/
50%-
<i
ͣ
'
ͣ
'
40%-1
N
0
10
1C
Aerodynamic Diameter (um)
Figure 5.5: Percent Enrichment for the Wide Helix Design at Various
100% 90% 80%
^
70%-c
1
60%-"^
50%-1.
/^
A
-H-Short Body
Medium Body
^
40%-o
\
Long Bodyͣ
tS
30%-\
20%-
\
10%u^
-1 10
Aerodynamic Diameter (um)
100
Figure 5.6: Recovery Efficiency for the Thin Helix Design at Various
Cyclone Body Tube Lengths
100%n 90%- 80%->-
70%-c
1
60%-'^
50%-t
40%-u
(S
30%- 20%-
10%-
o%-1 )0
A-^^^^
-B-Short Body
-A-Medium Body
Long Body
10
Aerodynamic Diameter (um)
1C
and/or particle size) would imply at least two populations with different
means.