Do serum estrogen levels affect the antibody response to flu vaccines in post-menopausal women?
Rand Khasawneh Honors BPSH Thesis Department of Nutrition University of North Carolina
2017
Advisor: Melinda Beck, PhD
Abstract
Public health and the improvement of human health has been a topic of interest for centuries – even more so in current society. Preventative healthcare, specifically, has become a focus in recent years. Vaccines are one of the primary methods in which health officials attempt to improve both individual and collective human health before any issues even arise. That is why it is imperative to take into account any factors that may impede the ability of vaccines to
perform to their full capacity. This includes the presence – or lack thereof – of certain hormones, like estrogen. Obesity has also been shown to have a negative effect on antibody response to the flu vaccine (Sheridan et al.). Post-menopausal women have been shown to be especially
estrogen levels were assessed and compared. As expected, mean estrogen concentrations
Acknowledgments:
I would like to thank my mentor, Dr. Melinda Beck, for her guidance during the last two years and for allowing me to use her laboratory and supplies to complete my research study. I would also like to thank Scott Neidich and Jennifer Rebeles for their guidance, as well, and for their readiness and willingness to help with the completion of this project. I would also like to thank
Beck Lab and everyone in it for their willingness to help, as well, and for their making the last two years a pleasant experience. Additionally, I would also like to thank Styblo and Coleman Labs for allowing me to use their systems and for their willingness to help whenever I had any
Introduction
What is menopause?
Menopause is formally known as the cessation of production of oestrogen and progesterone which happens when the ovarian follicle store is finally depleted (Nelson et al. 2001). The transition to menopause occurs around mid-to-late 40’s and can greatly affect women’s lives, though the exact effects vary from woman to woman. Historically, menopause has not been thoroughly studied, leaving many questions unanswered and creating a passive attitude towards symptoms associated with menopause. Rather than try to remediate some of the severe symptoms associated with menopause, such as immune system decline and osteoporosis, many women fall prey to thinking that the symptoms are normal and that they must live with them – which is not true. There are numerous new therapies and studies that show that it is possible to improve the symptoms of menopause. One of the main effects of concern associated with menopause and lower estrogen levels is a decline in immune function (Gameiro et al. 2010), indicating a decreased antibody response to the annual flu vaccine in post-menopausal women.
Estrogen and its forms
during menopause. Estradiol is the most commonly clinically measured among the three forms of estrogen. Estradiol levels of 50 pg/mL is considered low for pre-menopausal women. During the first 2-5 years of menopause (transition), however, that value drops to 25-35 pg Estradiol/mL until it eventually dips below 25 pg estradiol/mL (ESTROGEN). Estrol (E3) is the weakest of the three forms and is actually a waste product of estradiol. It is what is responsible for morning sickness in pregnant women. It is 8% as potent as estradiol and 14% as potent as estrone (ESTROGEN).
The various types of antibodies
There are five immunoglobulin classes that play a role in the human body, but
immunoglobulin G (IgG) is the most commonly found in human serum and accounts for 10-20% of plasma protein (Vidarsson et al. 2014). Immunoglobulins are glycoproteins that are composed of 82-96% protein and 4-18% carbohydrates. There are four subclasses of IgG: IgG1, IgG2, IgG3, and IgG4, with IgG1 being the most abundant subclass and IgG4 being the least abundant subclass (Vidarsson et al. 2014). The type of secondary immune response and the type and composition of the antigen entering the body determines the body’s response to any health threat. IgG1 is mainly induced by membrane proteins and soluble protein antigens and is often
accompanied by IgG3 and IgG4. Antibodies combine antigen binding sites with innate receptors’ and adaptor molecules’ binding sites to trigger effector mechanisms of the innate immune system (Vidarsson et al. 2014). For the purposes of this study, IgG total and IgG1 pre-and
Colombel et. Al. (1997) demonstrated that there is a positive correlation between increase in age and increased weight gain, more greatly in women than in men. It was also shown that this increase in weight reached a peak after 50 years of age. Another study by the name of “Healthy Women’s Study”, mentioned by Colombel, found that while there is an increase in weight gain with increasing age, this relationship is independent of menopausal status. The study divided women into three groups: pre-menopausal (who were still premenopausal by the end of the study), transitional menopausal, and post-menopausal. Some women from the latter group were also either undergoing or had already undergone hormone replacement therapy. These women were studied for three years. By the end of the three years, the increase in weight gain with increasing age was found to be significant in all three of the above mentioned groups
(Colombel), indicating the lack of a relationship between menopausal status and weight gain in women. There is speculation, however, that there is a relationship between redistribution of fat post-menopause and menopausal status, causing an increase in abdominal fat in post-menopausal women (Colombel). The exact cause, however, is unclear.
The role of estrogen in health decline
A recent review of studies led to the conclusion that though age also plays a factor, estrogen deprivation may be the cause of immune changes in post-menopausal women (Gameiro et al. 2010). This review included both human and animal studies via an electronic search on MEDLINE and the Cochrane Controlled Clinical Trials Register and identified 688 studies involving the immune system and menopause, of which 30 studies were selected.
be due to increases in IL-6 and other pro-inflammatory markers that increase in the bodies of post-menopausal women as a result of decreased estrogen levels (Gameiro et al. 2010). Some studies also showed that hormone replacement therapy (or the ending of hormone replacement therapy) also produced changes in the immune system (Gameiro et al. 2010).
The role of obesity in the response to influenza infection
Mouse models utilizing diet-induced obesity and influenza infection have demonstrated that obesity results in decreased immunity and increased morbidity and mortality from influenza (Smith et al. 2007). As with estrogen deprivation, obesity has also been associated with an increase in IL-6 and other pro-inflammatory responses of the body. Studies in humans demonstrated similar effects to the animal model. Sheridan et al, (2012). Antibody levels to influenza vaccination were analyzed at prevaccination, 30 days and 1 year post influenza vaccination. The results found a significant positive correlation between BMI and higher initial fold increase in IgG antibody response 1 month post vaccination. However, the results changed 12 months post vaccination – an association was discovered between high BMI and a decrease in antibody titer. This indicates that obesity does indeed impair antibody response, a relationship which could be dependent on time of vaccination, as well.
Mouse model with influenza infection and estrogen levels
OVEX with estradiol replacement (OVEX+E2), and sham-OVEX. The results of the study found that the mice from the latter two groups responded more significantly to the vaccine than the OVEX group, indicating that ovariectomy negatively affects immune response (Nguyen). This shows a potential negative effect via menopause on the antibody response, as well. Additionally, since mice in the OVEX+E2 group responded as significantly as mice in the sham-OVEX group, it is also potentially indicative of the importance of estrogen (specifically, estradiol) on the antibody response to the flu vaccine. As of 2011, when this study was published, there had not been any human studies looking into the effects of estradiol on antibody response to the influenza vaccine (Nguyen et al.).
Summary
There seems to be a well-established relationship between menopause and weight gain, weight gain and immune system impairment, and menopause and immune system impairment. Thus, I hypothesize that post-menopausal women with higher estradiol levels at initial blood draw will have higher antibody response to the influenza vaccine, while post-menopausal women with lower estradiol levels will have lower antibody response to the influenza vaccine.
Methods
Serum Sample Collection
Antibody ELISA
In order to assess the IgG total and IgG1 antibody response to the influenza vaccine, an indirect enzyme-linked immunosorbent assay (ELISA) will be used to analyze the pre- and post-vaccination serum samples of each of the 24 women involved in the study using a protocol previously designed in Beck Lab. ELISAs make it possible to bind specific antibodies needed for analysis (ENZYME). There are different types of ELISAs that can be performed, some of which are shown in the figure below:
(H1N1) vaccine strain(1:160 for IgG1 and 1:80 for IgG total) and coating each well in a 96-well plate with 31.25 µL of the dilution. The plate is then kept overnight in a 4 degrees Celsius refrigerator in a ziplock bag with a moist paper towel in order to keep the wells from drying out. The following day, the wells are blocked with 200 µL of block buffer (nonfat dry milk, PBS, Na2CO3 and NaHCO3) and incubated at 37 degrees for one hour. During this incubation time, each of the 48 serum samples (24 patients’ pre- and post-vaccination samples) was diluted (1:800 for IgG1 and 1:25600 for IgG total) with dilution buffer (nonfat dry milk and PBS). After the one-hour incubation was over, the plates were washed with PBSt to wash away any
nonspecifically bound materials and 50 µL of each of the dilution samples was put into its own respective well in triplicates with controls and blanks in each plate. Each plate fit the triplicates of 30 samples total, not including the control and blank samples, so a total of two plates were used. After putting in the diluted serum samples, the plates were incubated at 37 degrees Celsius for 2 hours. Afterwards, the plates were then washed again and 50 µL of a 1:1000 dilution of goat anti-human IgG conjugated to horseradish peroxidase in dilution buffer were added to each well and incubated for another hour at 37 degrees Celsius. The plates were then again washed and 100 µL of TMB substrate solution mix were added to each plate and allowed to incubate at room temperature for 30 minutes. The reaction was then stopped with 100 µL of 2M Sulfuric Acid. The absorbance of the samples in the plates was then read in a plate reader at 450 nm. Estrogen ELISA
In order to assess pre-vaccination estradiol in the 24 women, a pre-coated AChE
The table below shows the layout of the plates. The serum samples this time were analyzed in duplicates. The last column was left blank, while the second and third columns were used to analyze the standard in order to covert the absorbance values to concentrations. Only one plate was necessary, since only the pre-vaccination estradiol levels were assessed.
HAU/HAI
(Acharya)
In an HAI, if antibodies to the virus being studied are present, the virus will not be able to attach to the RBC, thereby preventing hemagglutination (Acharya). An HAI titer is the highest dilution of serum that prevents hemagglutination (Acharya). Hemagglutination will be present in all of the cells if the antibody is not present. However, if the antibodies are present, it will be at the point at which the antibodies are diluted properly (Acharya). The highest dilutions of serum are interpreted using the dilution standard values shown in the figure below:
(Acharya)
The serum samples must all be treated with receptor destroying enzyme (RDE) prior to performing the assay in order to prevent complications by any nonspecific inhibitors of
were run with 4 samples on each plate (2 patients’ pre- and post-vaccination serum samples) using the layout shown below:
The previously RDE treated serum was thawed in a water bath and stored on ice until it was ready to use. 25µL of PBS were added to all wells except for the first row. 50µL of serum sample were added to the first eight columns (4 samples total with duplicates for each), and the rest of the first row was filled with 50 µL of positive control, negative control, diluted virus, and PBS, respectively. A serial dilution was performed on the entire plate. 25µL of the diluted virus were then added to all of the wells in columns 1-10 and 25µL of PBS were added to columns 11 and 12. The plates were then incubated for 15 minutes, after which 50µL 0.5% RBC suspension was added to each well. The plate was then incubated for 20 minutes and observed for
Results:
In this study, 24 women’s isolated pre- and post-vaccination serum samples from the 2014-2015 study were used to test the above stated hypothesis. For this study, an indirect ELISA, a competitive ELISA, and a HAI were all performed on the 48 total samples. The women were grouped in various ways but were primarily grouped by BMI. A summary of this data and the data from the various tests performed is shown in the table below.
BMI Category Mean BMI Estradiol (pg/ml)
Healthy 21.3 5.463396 19.94403 14.9043 5.81
Overweight 28.4 5.551467 50.43823 93.7402 2
Obese 37.5 6.181821 -10.1922 40.4567 5.82
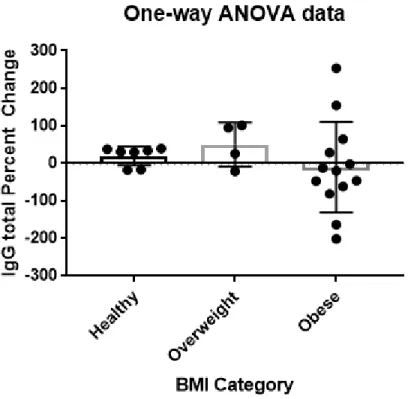
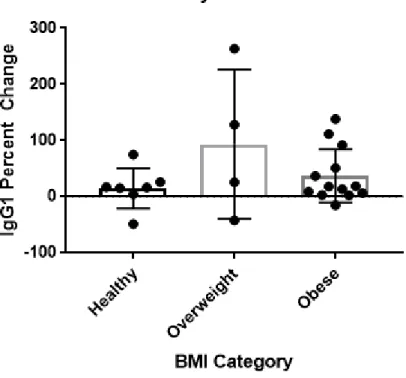
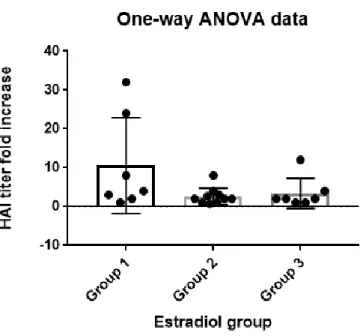
The relationship between BMI and antibody response
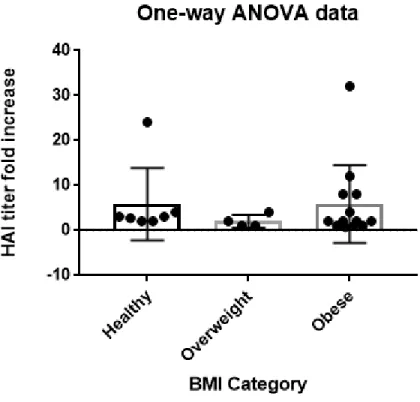
Figure 1. The graph above shows the one-way ANOVA test assessing the relationship between BMI and HAI titer antibody response. The p-value for this data was 0.6776 with a R-square value 0.03639, indicating no significance and weak correlation.
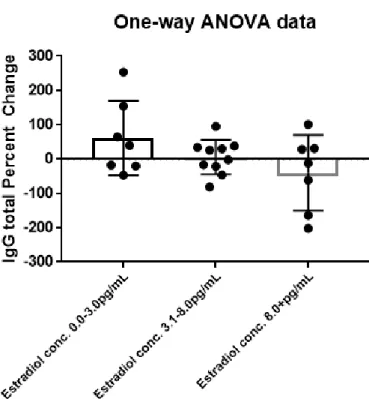
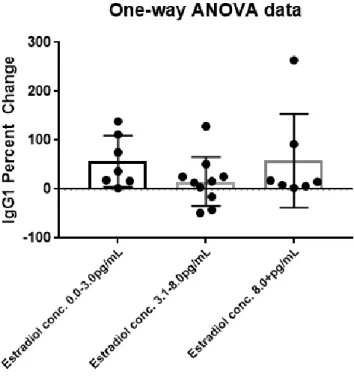
The relationship between estradiol serum concentration and antibody response
The concentration of estradiol present in each woman’s serum sample was also measured via a competitive ELISA kit. In this case, however, the pre-vaccination sample was assessed for estradiol concentration rather than pre- and post-vaccination. The significance of the relationship between initial estradiol serum concentration and antibody response (IgG total, IgG1, and HAI titer) was also tested via a one-way ANOVA. The women were grouped by estradiol
group 2 included women with estradiol concentrations of 3.1 to 8 pg/mL; and group 3 included women with estradiol concentrations of 8.1 pg/mL and above.
Figure 1. The graph above shows a linear regression test assessing the relationship between initial estradiol serum concentrations and IgG total antibody response. The p-value for this data was 0.0586 with a R-square value 0.1531, indicating no significance and weak correlation.
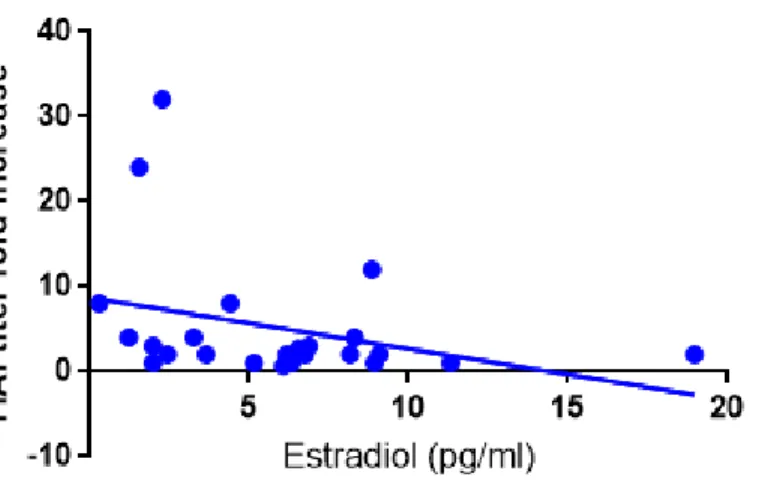
Figure 1. The graph above shows a linear regression test assessing the relationship between initial estradiol serum concentrations and HAI titer antibody response. The p-value for this data was 0.1237 with a R-square value 0.1043, indicating no significance and weak correlation.
Since all of the above tests came back insignificant and some of them were very close to having a p-value of 0.05 significance, a two-way ANOVA was also performed on the
into low estradiol and high estradiol. The low estradiol group included women who had initial estradiol serum concentrations of 6 pg/mL or lower, while the high estradiol group included women who had initial estradiol serum concentrations of 6.1 pg/mL or higher. In the third two-way ANOVA, the women were grouped based on age. The first group included women ages 45 to 53 years old, while the second group included women ages 53.1 years old or older. They were additionally grouped into not responded and responded categories, as well, based on their HAI titer fold increase. Women with HAI titer fold increases of 4 or greater were categorized as having responded, while women with HAI titer fold increases of less than 4 were categorized as not having responded. The graphs are shown below:
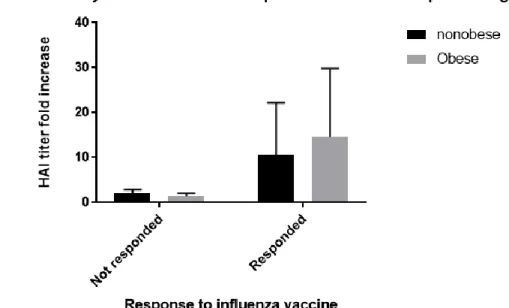
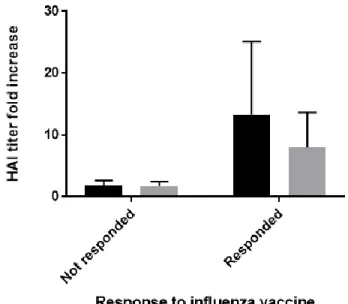
Figure 1. The graph above shows a two-way ANOVA test assessing the relationship between BMI and HAI titer antibody response. The p-value for the relationship between not
the difference in antibody response between those who responded and didn’t respond, but that obesity was not the cause of this significant difference.
Figure 1. The graph above shows a two-way ANOVA test assessing the relationship between initial serum estradiol concentrations and HAI titer antibody response. The p-value for the relationship between not responded:low estradiol vs. responded:low estradiol was 0.0197, indicating that there is significance between the difference in antibody response between those who responded and didn’t respond, but that initial estradiol serum concentration was not the cause of this significant difference.
Figure 1. The graph above shows a two-way ANOVA test assessing the relationship between age and HAI titer antibody response. The p-value for the relationship between not responded:age 53.1-60 years old vs. responded:age 53.1-60 years old was 0.0063, indicating that there is
significance between the difference in antibody response between those who responded and didn’t respond, but that age was not the cause of this significant difference.
Discussion
The primary consequence of menopause is a decline in estradiol levels which then causes various other consequences like a decline in immune function (Gameiro). A mouse model study done prior to this study by Nguyen et al showed that mice that were modeled to be
1.5 years ago in the spring of 2016, it was the only human study to observe the relationship between estradiol and antibody response to the flu vaccine and was thus modeled after the Nguyen study.
Measuring antibody response and estradiol concentrations
In order to assess the antibody response of the 24 women, indirect ELISA assays were conducted to study the amount of IgG total and IgG1 present in the sample, while HAI assays were conducted in order to study the amount of virus-specific antibody in the sample. These tests were run on the pre- and post-vaccination samples of the 24 women and the percent change of the IgG total and IgG1 data was calculated from the ELISA assays, while the fold increase of the HAI titer data was calculated from the HAI titers. In order to assess the estradiol concentrations present in the pre-vaccination sample, a competitive ELISA kit was used.
Grouping the women
concentrations of 8.1 pg/mL and above. Using this system of grouping, a one-way ANOVA was run on the relationship between estradiol serum concentration and IgG total or IgG1 percent change/HAI titer fold increase in order to assess the significance. A linear regression was also run on the estradiol concentrations and IgG total or IgG1 percent change/HAI titer fold increase without grouping in order to further assess the significance of the relationship. Lastly, two-way ANOVAs were also run in order to test the relationship between BMI and antibody response, estradiol concentrations and antibody response, and age and antibody response. For the two-way ANOVA, the women were this time categorized into obese versus nonobese, where obese women had BMI’s of 30kg/m^2 or greater and nonobese women had BMIs of less than 30kg/m^2. The women were also grouped into low estradiol versus high estradiol, where low estradiol was categorized as 6.0 pg/mL or less and high estradiol was categorized as 6.1 pg/mL or greater. The women were further grouped by age, where the first group consisted of women ages 45 to 53 years old and the second group consisted of women ages 53.1 to 60 years old. In all three two-way ANOVAs, the women were additionally grouped into responsive versus
nonresponsive to the flu vaccine. Nonresponsive was defined as having a HAI titer fold increase of less than 4, while responsive was defined as having a HAI titer fold increase of 4 or greater.
Insignificance between BMI and antibody response
correlation. The p-value for the one-way ANOVA assessing the relationship between BMI and HAI titer fold increase was found to be 0.6776 with a R-square value of 0.03639, indicating no significance and no correlation. This is unsupported by the literature.
Insignificance between estradiol serum concentrations and antibody response
A two-way ANOVA was conducted to study the relationship between initial estradiol serum concentation and antibody response using the grouping system mentioned above. A linear regression was also run on the data, as well. The p-value found via the two-way ANOVA for estradiol serum concentration and IgG total mean percent change was found to be 0.1284 with a R-square value of 0.1776, indicating no significance and no correlation. The p-value found via the two-way ANOVA for estradiol serum concentration and IgG1 mean percent change was found to be 0.3417 with a R-square value of 0.0972, indicating no significance and no
Significance between antibody response groups
A two-way ANOVA was also run to assess the relationship between estradiol
concentrations and HAI titer fold increase grouped in the way described above and a p-value of 0.0197 was found for the relationship between the not responded:low estradiol and
responded:low estradiol, indicating significance between those who responded to the vaccine and those who did not respond to the vaccine. However, this also means that estradiol concentration is not the cause of the significance of the difference between the two groups. A two-way
ANOVA was also run to assess the relationship between estradiol concentration and HAI titer fold increase grouped in the way described above and a p-value of 0.0313 was found for the relationship between the not responded:obese and responded:nonobese, indicating significance between those who responded to the vaccine and those who did not respond to the vaccine. Again, however, this also means that BMI is not the cause of the significance of the difference between the two groups. A two-way ANOVA was also run to assess the relationship between age and HAI titer fold increase grouped in the way described above and a p-value of 0.0197 was found for the relationship between the not responded:45-53 years old and responded:53.1-60 years old, indicating significance between those who responded to the vaccine and those who did not respond to the vaccine. However, this also means that age is not the cause of the significance of the difference between the two groups.
There were many limitations in this study. First, post-menopausal women have such low estradiol concentration levels that the ELISA kit used to measure the concentration in each sample may not have been sensitive enough to accurately measure the concentration in these specific women, since it measures such a wide range. Additionally, due to various technicalities and changes made throughout the study, the study only included 24 women. This is an extremely small sample size, which makes it very difficult to make significant conclusions. Additionally, post-menopausal women have very small differences in estradiol concentrations, so this study may have improved by comparing pre- and post-menopausal women’s antibody response to the flu vaccine.
Conclusions and future studies
The hypothesis was proven incorrect. There was found to be no significance between BMI and antibody response nor between estradiol and antibody response, which does not agree with the hypothesis nor with the literature used to form the hypothesis and this study. Though the hypothesis could not be accepted, it is still possible that BMI and estradiol concentrations do indeed affect the antibody response to the flu vaccine. As mentioned above, the sample size was too small to make a significant conclusion and the ELISA kit used may have had too wide of a range to be accurate enough for the purposes of this study. Additionally, since post-menopausal women have very low estradiol levels, it may be difficult to find significance between their estradiol levels, as well. Thus, for future studies, I would suggest conducting this study with a larger sample size and by comparing estradiol levels in pre- and post-menopausal women. I would also suggest using an ELISA kit that has a more narrow range of measurement values.
References
1. Acharya, Tankeshwar. "Hemagglutination Inhibition Test (HAI): Principle, Procedure, Result and Interpretations." Microbe Online. N.p., 25 Dec. 2014. Web. 2. Colombel, A., & Charbonnel, B. (1997). Weight gain and cardiovascular risk factors
in the post-menopausal women. Oxford Journal, 12.
3. "ELISA – Enzyme Linked Immunosorbent Assay." Exploreable. N.p., 23 June 2011. Web. 10 Mar. 2017.
4. "Enzyme-linked Immunosorbent Assay (ELISA) Overview." Thermo Fisher Scientific. N.p., n.d. Web.
5. "ESTROGENS: E1, E2, E3." (n.d.): n. pag. RX Compound Centre. Web. 6. Freeman, Ellen, Mary Sammel, Hui Lin, and Clarisa Gracia. "Obesity and
Reproductive Hormone Levels in the Transition to Menopause." Pubmed Central. National Center for Biotechnology Information, July 2010.
7. Gameiro, C. M., Romao, F., & Castelo-Branco, C. (2010). Menopause and Aging: Changes in the Immune System - A review. Maturitas.
8. Nelson, L. R., and S. E. Bulun. "Estrogen Production and Action." Journal of the American Academy of Dermatology. U.S. National Library of Medicine, Sept. 2001. Web.
10. Sheridan, PA, Paich HA, Handy J, Karlsson EA, Hudgens MG, Sammon AB, Holland LA< Weir S, Noah TL and Beck MA. “Obesity is associated with impaired immune response to influenza vaccination in humans. Int J Obes 2012:36:1072
11. Smith, Alexia G., Patricia A. Sheridan, and Joyce B. Harp. "Diet-Induced Obese Mice Have Increased Mortality and Altered Immune Responses When Infected with
Influenza Virus." The Journal of Nutrition, 01 May 2007. Web.
12. Vidarsson, Gestur, Gillian Dekkers, and Theo Rispens. "IgG Subclasses and
Allotypes: From Structure to Effector Functions." Frontiers in Immunology. Frontiers Media S.A., 20 Oct. 2014. Web.