Neural Circuitry of Reward Loss in Autism Spectrum Disorders
Dillon Cockrell
University of North Carolina at Chapel Hill
Spring 2013
A thesis presented to the faculty of The University of North Carolina at Chapel Hill in partial fulfillment of the requirements for the Bachelor of Science
degree with Honors in Psychology
Acknowledgements
I would like to thank my adviser, Dr. Gabriel Dichter, for all of his support and assistance over the past three years as I have had the chance to be involved in psychological research
Abstract
Neural Circuitry of Reward Loss in Autism Spectrum Disorders
According to the Diagnostic and Statistical Manual of Mental Disorders (DSM-IV), individuals with Autism Spectrum Disorders (ASD) are characterized by deficits in social interaction and communication as well as restricted repetitive behaviors (American Psychiatric Association, 1994). Past findings have pointed to the possibility that core impairments of reward circuitry may be the cause of the social impairments in individuals with ASD (Dawson et al., 2004). One of the key implications of the reward circuitry system is determining the motivation of individuals to seek out different rewarding stimuli. Etiologically, the social motivation hypothesis asserts that the lack of reward processing of social stimuli by infants with ASD may result in the presentation of maladaptive social dysfunction throughout the remainder of his or her life (Schmitz et al., 2008; Scott-Van Zeeland, Dapretto, Ghahremani, Poldrack, &
Bookheimer, 2010). Similarly, the feature of having restricted repetitive behaviors, which are associated with strong desires for sameness and intense interests in constricted subjects (American Psychiatric Association, 1994), may also result from irregular functioning of the reward processing systems of individuals with ASD (Dichter et al., 2012).
Researching Reward Processing
two phases together reflect reward processing, research indicates that the neural circuitry of the processes are fundamentally separate (Knutson, Fong, Adams, Varner, & Hommer, 2001).
In examining the neural correlates of reward processing, functional magnetic resonance imaging (fMRI) is a proven method for researching social rewards and ASD (Dichter et al., 2012; Dichter et al., 2012; Kohls et al., 2011; Larson et al., 2011; Schmitz et al., 2008; Scott-Van Zeeland et al., 2010). Prior research studies using fMRI have determined a reward network of the brain to be composed of the anterior cingulate (ACC), orbitofrontal cortex (OFC), and the ventral striatum (VS) (O’Doherty, Kringelbach, Rolls, Hornak, & Andrews, 2001). According to Breiter and Gasic (2004), fMRI has become a gold standard for examining the underlying neural processes of motivation that give insight to the etiological basis for neuropsychiatric disorders. Since understanding motivation is important for studying behavior, comprehension of how ASD individuals differ in social motivation compared to typical individuals is necessary to improve the social functioning of autistic individuals.
Reward Processing and Autism
For most individuals, social situations begin to elicit a positive response in the brain at a very young age, but research indicates that this is not the case in the majority of individuals with ASD (Dawson et al., 2004). According to the “social motivation hypothesis,” a diminished neural reward response of infants with ASD to social stimuli may cause the individuals to
Reward processing was studied in ASD by Scott-Van Zeeland et al. (2010) using monetary and social rewards. In their study, an implicit learning task was employed with
separate trials for the different reward types across both TD and ASD subjects. Results indicated that ASD participants had decreased activity for the monetary reward task in the ventral striatum (VS), an important region for coding the incentive motivation salience of potential future
rewards. Furthermore, the results also found an even greater hypoactivation of the VS for the ASD group for the social reward task when compared to TD participants, suggesting that ASD individuals have specifically low neural responses to social rewards (Scott-Van Zeeland et al., 2010).
Reward Loss and Reward Gain
While many studies have been conducted assessing the neural circuitry of various types of reward gains as it pertains to ASD (Dichter et al., 2012; Dichter et al., 2012; Kohls et al., 2011; Larson et al., 2011; Schmitz et al., 2008; Scott-Van Zeeland et al., 2010), no research has been conducted to determine whether there is a fundamental difference in reward anticipation or outcome in autism verses TD participants when rewards are lost rather than gained. Given recent findings that suggest that there may be a more general impairment of reward processing in ASD as opposed to a deficit strictly based on social stimuli (Kohls et al., 2011), it is important to gain comprehensive knowledge on all aspects of reward and motivation to further understanding of the basis of social deficits in ASD. The significance of considering reward loss in addition to reward gain has been recognized in a number of other neuropsychological disorders (Elman et al., 2009; Gotlib et al., 2010; Vollm et al., 2007), but has yet to be researched for autism.
In 2007, Vollm and colleagues noted that looking at the loss, or punishment, condition of reward processing and motivation could provide insight by determining if certain behavior is a result of positive goal-directed behavior or a diminished sensitivity to punishment. In the study, the researchers used monetary gain and monetary loss tasks to employ the two systems for comparison between healthy participants and Cluster B (antisocial and borderline) personality disorder participants. This distinction between motivations for gaining rewards versus avoidance of reward loss was shown to be important etiologically as different psychopathology may have resulted depending on which psychological process was impaired (Vollm et al., 2007).
In a study by Elman et al. (2009), fMRI was used to study the anticipation and outcome of both monetary reward gain and loss to compare a PTSD group with a healthy group. The study results showed that a lower activation of the VS for monetary gains compared to losses was associated with reduced social motivation. The implementation of using a behavioral test for reward loss was important in providing a framework for comparison of the participants’ relative motivation for achieving a reward against their motivation to avoid losing a similar reward. These findings carried important treatment relevance, as they implied that behavioral therapy or psychopharmacological treatments should be directed towards increasing reward processing activation (Elman et al., 2009).
The Current Study
While the anticipation and outcome of both social rewards and monetary rewards have been studied as they relate to ASD (Dichter, Richey, Rittenberg, Sabatino, & Bodfish, 2012; Kohls et al., 2011; Larson, South, Krauskopf, Clawson, & Crowley, 2011; Schmitz et al., 2008; Scott-Van Zeeland et al., 2010), there have been essentially no studies conducted to assess the correlates of the loss of such rewards. The present study examines the neural processing of reward loss in both the anticipation and outcome of children with ASD compared to typically developing (TD) children. This paradigm will be administered through a modified Monetary Incentive Delay (MID) task (Knutson, Westdorp, Kaiser, & Hommer, 2000) with conditions varied according to stimulus type (social or non-social) and reward type (gain or loss). Furthermore, the reward processing system of individuals with ASD has been found to be
impaired through several past research studies (Dichter et al., 2012; Dichter et al., 2012; Kohls et al., 2011; Larson et al., 2011; Schmitz et al., 2008; Scott-Van Zeeland et al., 2010). These studies have often utilized a modified MID task (Knutson, et al., 2000) designed to create a paradigm for examining the neural correlates of reward processing based on the anticipation and outcome phases of different types of rewards (Delmonte et al., 2012; Demurie, Roeyers,
Baeyens, & Sonuga‐Barke, 2011; Dichter et al., 2012). This study will be the first to employ a
modified MID task based on reward loss in studying ASD.
Methods
Participants
Recruitment of this study aimed for 20 TD children and 20 children with diagnoses of high-functioning autism. Unfortunately, data for only 15 autistic children and 10 typically developing children was collected prior to analysis. The age of the participants ranged from 9 to 18 years old with the autistic group being collectively older (M=15.06 years old, SD=2.97 years old) than the control group (M=13.28 years old, SD=3.36 years old). The recruitment of children with ASD was conducted through the Autism Subject Registry and TD children were recruited through the Child Development Research Registry. Each of these registries is maintained by the Carolina Institute for Developmental Disorders. All children included in the ASD group were previously diagnosed with an autism spectrum disorder prior to the study. Each ASD participant scored according to their diagnosis as well on the Autism Diagnostic Observation Schedule (ADOS) – Module 3 or 4.
Clinical Measures
Each participant was scored on multiple neuropsychological tests prior to taking part in the study task. The Social Responsiveness Scale (SRS) (Constantino et al., 2003) was used to measured social impairment symptoms of autism. In order to assess restricted repetitive
FMRI Mock Scan
In order to acclimate participants to testing conditions prior to scanning sessions, all children completed a brief training of the behavioral task of the study while being in a mock fMRI scanner. All participants scored >95% on a training behavioral task simulating the MID task during the mock scan.
Reward Stimuli
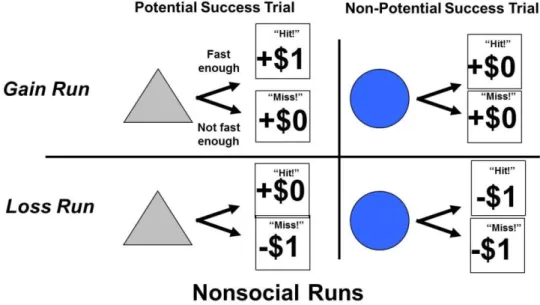
The modified incentive delay (MID) task was employed during separate runs for four different reward conditions: monetary gain, monetary loss, social gain, and social loss. For these runs, participants had the chance to gain money, avoid losing money, gain images of faces with happy expressions, or avoid seeing faces with sad expressions based on their response times.
FMRI Imaging Session
Each of the four MID task runs were conducted while in the fMRI scanner with 40, 6 second trials. At the start of each trial, one of two cue shapes (a grey triangle for potential success trials and a blue circle for non-potential success trials) were presented for 250 milliseconds to indicate to the participant the implications of each trial. After the shape
The four MID task runs were characterized by reward type as either monetary or social and by the gain or loss paradigm and thus were described as “Money Gain,” “Money Loss,” “Face Gain,” and “Face Loss.” For the social tasks, participants had the chance to either “gain” the image of a smiling face or avoid the “loss” of viewing a face with a sad expression. Non-social tasks involved monetary rewards in which participants were given the chance of gaining a dollar or avoid losing a dollar from a set amount of money prior to the task. At the beginning of each trial, participants were shown either a grey triangle or a blue circle. If shown the grey triangle, participants were aware that their performance on the task would determine if they received, or avoided losing, a reward. If shown the blue circle, participants were aware that they did not have the opportunity to gain an award or avoid losing a reward regardless of their
Imaging Methods
The methods for collecting the imaging data for the study are similar to those employed by Dichter et al. (2012). The scanning of each participant was conducted using a “GE Health Technologies, 3 Tesla Signa Excite HD scanner with 50-mT/m gradients (General Electric, Waukesha, Wisconsin, USA). Head movement was restricted using foam cushions. An eight-channel head coil was used for parallel imaging. Thirty high resolution images were acquired using a 3D fast SPGR pulse sequence (TR = 7.332 ms; TE = 3.032 ms; FOV = 22 cm; image matrix = 2562; voxel size = 0.86 × 0.86 × 3.80 mm) and used for coregistration with the functional data. Structural images were aligned in the near-axial plane defined by the anterior and posterior commissures. Whole-brain functional images consisted of 30 slices parallel to the AC-PC plane using a BOLD-sensitive gradient-echo EPI sequence with higher-order shimming, at TR of 2,000 ms (TE: 30 ms; FOV: 22 cm; isotropic voxel size: 3.4375 × 3.4375 × 4.0000). Runs began with 4 discarded RF excitations to allow for steady state equilibrium (Dichter et al., 2012).”
Symptom Correlations
Results
Although there was no support for the hypotheses of hypoactivation of the VS for the ASD group compared to the control group, there were several interesting findings.
Imaging Results
Because of time limitations for the analysis of data for this thesis, the Money Loss and Face Loss conditions were selected to be analyzed over the Money Gain and Face Gain
conditions, which have been examined in prior literature. Differences in brain activation were evaluated by observing significantly different clusters of activity between the ASD and control groups during the anticipation and outcome phases of the Money Loss and Face Loss trials. Despite the small sample size of the study, a conservative threshold for significant activation (Z>2.54) was used during analysis.
Table 1.
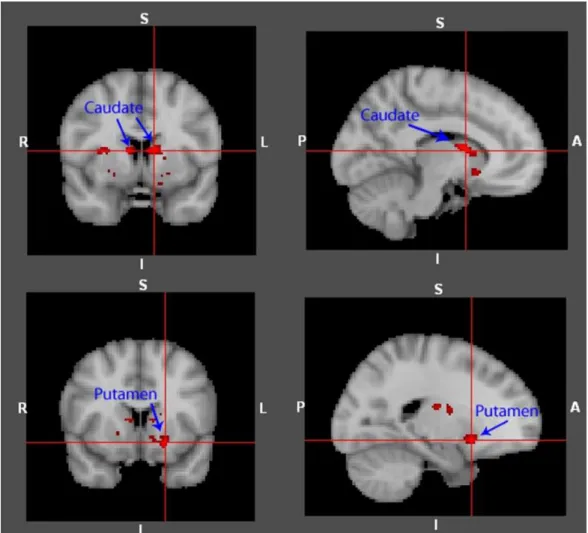
Significant Main Effect Differences in Activation of Control > ASD during the Anticipation Phase of Face Loss Trials
Region Cluster Size
(mm^3)
Mean Activation (Z)
Max Activation (Z)
MNI Brain Coordinates
x y z
Left Putamen 88 2.82 3.34 -20 12 -10
Right Caudate 48 2.81 3.39 10 6 10
Left Caudate 220 2.88 3.53 -10 6 10
Table 1.
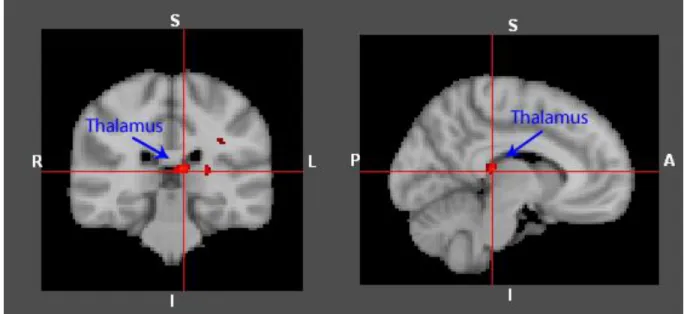
Significant Main Effect Differences in Activation of Control > ASD during the Outcome Phase of Money Loss Trials
Region Cluster Size
(mm^3)
Mean Activation (Z)
Max Activation (Z)
MNI Brain Coordinates
x y z
Right Thalamus 21 2.71 3.09 14 -20 -4
Left Thalamus 47 2.95 3.60 -12 -4 4
Table 3.
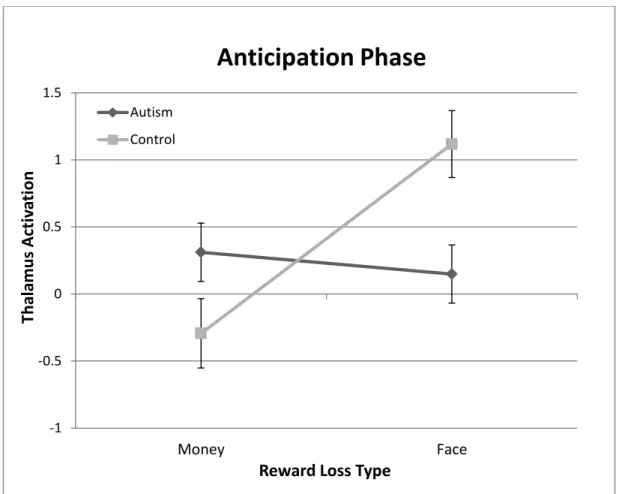
Significant Interaction Effect of Activation between Groups of the Anticipation Phases of Money Loss and Face Loss Trials
Region Cluster Size
(mm^3)
Mean Activation (Z)
Max Activation
(Z) MNI Brain Coordinates
x y z
Figure 4. Graphical representation of the significant interaction effect of activation between groups of the anticipation phases of Money Loss and Face Loss trials.
-1 -0.5 0 0.5 1 1.5
Money Face
Th
al
am
u
s
A
ct
iv
ati
on
Reward Loss Type
Anticipation Phase
Autism
Correlational Results
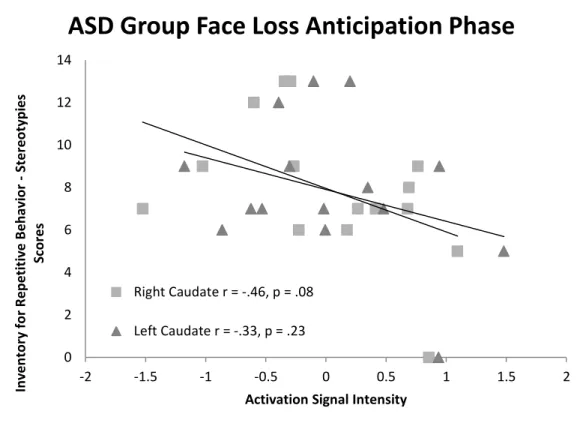
Figure 5. Graphical representation of the negative correlation between caudate signal intensity and IRB – Stereotypies scores within the ASD group.
0 2 4 6 8 10 12 14
-2 -1.5 -1 -0.5 0 0.5 1 1.5 2
In ve n to ry fo r R e p e titi ve B e h av io r - Ste re o typ ie s Sc o re s
Activation Signal Intensity
ASD Group Face Loss Anticipation Phase
Right Caudate r = -.46, p = .08
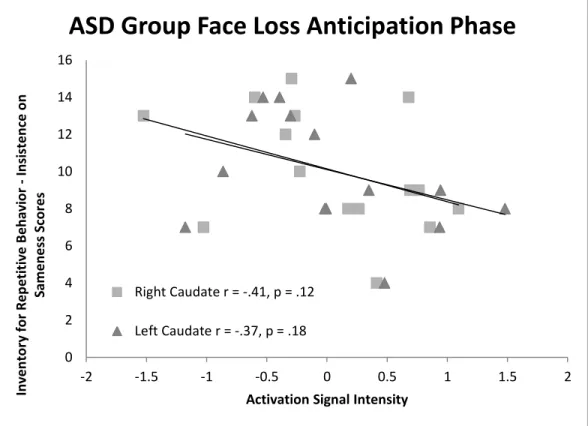
Figure 6. Graphical representation of the negative correlation between caudate signal intensity and IRB – Insistence on Sameness scores within the ASD group.
0 2 4 6 8 10 12 14 16
-2 -1.5 -1 -0.5 0 0.5 1 1.5 2
In ve n to ry fo r R e p e titi ve B e h av io r - In si ste n ce o n Sam e n e ss S co re s
Activation Signal Intensity
ASD Group Face Loss Anticipation Phase
Right Caudate r = -.41, p = .12
Figure 7. Graphical representation of the positive correlation between thalamus signal intensity and RBSR – Restricted Behavior scores within the ASD group.
0 2 4 6 8 10 12
-2.5 -2 -1.5 -1 -0.5 0 0.5 1 1.5 2 2.5
R e p e tt iv e B e h av io r Sc al e ( re vi sed ) - R e str ic te d B e h av io r Su b sco re s
Activation Signal Intensity
ASD Group Money Loss Outcome Phase
Right Thalamus r = .71, p = .003
Behavioral Results
Table 4.
Reaction Time Means for Groups during Performance for Each Task Type
Group t df
Control (ms) ASD (ms)
Money Gain Reward 229.88 206.50 -2.71** 280
Money Gain Non-reward 240.95 218.40 -2.07* 237
Money Loss Reward 246.87 236.33 -1.48 251
Money Loss Non-reward 254.17 259.61 0.59 214
Face Gain Reward 243.15 215.98 -3.10** 306
Face Gain Non-reward 260.70 235.06 -2.52* 230
Face Loss Reward 241.54 211.50 -3.03** 239
Face Loss Non-reward 257.15 227.22 -2.75** 247
Total 242.76 224.65 -5.19*** 1813
Discussion
Instrumental Social Learning
Though prior research has found hypoactivation in the ventral striatum to be common for autistic individuals for paradigms of reward gain (Dichter et al., 2012; Dichter et al., 2012; Scott-Van Zeeland et al., 2010), the results of this study suggest abnormal functioning of the
subcortical regions of the dorsal striatum may impact autistic reward loss processing for social situations. As discussed, the caudate and the putamen, both regions of the dorsal striatum, were significantly hypoactive in the ASD group compared to the control group of the study during the anticipation phase of the Face Loss condition. In order to psychologically interpret these
findings, it is important to consider the past research on the complementary roles of the ventral and dorsal striatum.
situations to prevent similar outcomes in future scenarios. Because of the inability to anticipate these negative social outcomes, children with ASD may continue to act in ways that are
considered awkward or inappropriate by their peers. These assertions are also supported by the behavioral findings of Lin, Rangel, and Adolphs (2012) which involved adults with autism showing impairment in reward learning to be greater for social rewards than for monetary rewards.
Autism and the Thalamus
Autism Symptomatology and the Dorsal Striatum
The correlational results of the study indicated that as caudate activity within the ASD group increased during the Face Loss anticipation phase, scores on measures of stereotyped behavior and insistence on sameness tended to improve. While not all of these measurements yielded significant correlations, a larger sample of ASD children may have resulted in significant results given the moderate to strong correlation coefficients. Although the symptoms of
stereotyped behavior, or persistent actions that are typically not adaptive, and insistence on sameness do not always present identically between the two disorders, these are each common features of both autism and obsessive-compulsive disorder (OCD). Little research has been done examining the caudate and autism symptomatology, but prior findings have implicated the dorsal striatum as being functionally reduced in patients of OCD (Harrison et al., 2009). The findings of the current study further support the notion that hypoactivity of the caudate is associated with both stereotypy behavior and insistence on sameness and may provide some context to the link between the high rate of comorbidity between autism and OCD.
The Money Loss Condition
to the MID task significantly quicker than the control group. While it may be difficult to psychologically interpret these results, these findings may suggest some generalized abnormal functioning of the thalamus during either anticipation or outcome phases of reward loss avoidance in autism. Further research should be directed toward these paradigms for interpretation clarity.
Limitations
The small sample size of this study (ASD n = 15; Control n = 10) is a concern for the potential variability that may influence these findings. Although finding significant differences in brain regions was encouraging given the low number of participants, the correlational results should be interpreted with caution given their lack of directionality and further reduced sample size (ASD group only). Another limitation of this study is the inability to assume that images of faces during the social conditions perfectly simulate brain responses to actual social
environments. Though this paradigm has been used extensively in other research studies, it is important to consider this when generalizing the results to real-world scenarios. One final consideration is the discrepancy in age between the ASD group and the control group. The ASD group (M=15.06 years old, SD=2.97 years old) was older than the control group (M=13.28 years old, SD=3.36 years old), which could have influenced the results given the developmental changes of the brain that occur during this age range.
Implications and Future Directions
affecting their ability to learn the results of actions in a social context and to actively modify their behavior in response to social cues. Reduced caudate functioning has also been implicated as being correlated with higher rates of autism symptoms that are commonly shared with OCD. Another important finding of this study is that children with autism may not experience
psychopathology of the same brain regions in response to forms of losing rewards compared to gaining rewards, as the dorsal striatum (not the ventral striatum as in reward gain) was found to be significantly aberrant in loss conditions.
References
American Psychiatric Association. Task Force on DSM-IV. (1994). Diagnostic and statistical manual of mental disorders : DSM-IV(4th ed.). Washington, DC: American Psychiatric Association.
Bodfish, J.W. (2003). The Interview for Repetitive Behaviors. Unpublished Instrument,
Department of Psychiatry, University of North Carolina-Chapel Hill, Chapel Hill, North Carolina.
Bodfish, J.W., Symons, F.W., & Lewis, M.H. (1999). The Repetitive Behavior Scale- Revised, Western Carolina Center Research Reports.
Breiter, H. C., & Gasic, G. P. (2004). A General Circuitry Processing Reward/Aversion Information and Its Implications for Neuropsychiatric Illness. In M. S. Gazzaniga (Ed.), The cognitive neurosciences (3rd ed.) (pp. 1043-1065). Cambridge, MA US: MIT Press.
Constantino, J. N., Davis, S. A., Todd, R. D., Schindler, M. K., Gross, M. M., Brophy, S. L., . . . Reich, W. (2003). Validation of a brief quantitative measure of autistic traits: comparison of the social responsiveness scale with the autism diagnostic interview-revised. J Autism Dev Disord, 33(4), 427-433.
Dawson, G., Toth, K., Abbott, R., Osterling, J., Munson, J., Estes, A., & Liaw, J. (2004). Early Social Attention Impairments in Autism: Social Orienting, Joint Attention, and Attention to Distress. Developmental Psychology, 40(2), 271-283.
Delmonte, S., Balsters, J. H., McGrath, J., Fitzgerald, J., Brennan, S., Fagan, A. J., & Gallagher, L. (2012). Social and monetary reward processing in autism spectrum disorders.
Molecular autism, 3(1), 7.doi:10.1186/2040-2392-3-7
Demurie, E., Roeyers, H., Baeyens, D., & Sonuga‐Barke, E. (2011). Common alterations in
sensitivity to type but not amount of reward in ADHD and autism spectrum disorders. Journal of Child Psychology and Psychiatry, 52(11), 1164-1173. doi:10.1111/j.1469-7610.2010.02374.x
Dichter, G. S., Felder, J. N., Green, S. R., Rittenberg, A. M., Sasson, N. J., & Bodfish, J. W. (2012). Reward circuitry function in autism spectrum disorders. Social Cognitive and Affective Neuroscience. doi: 10.1093/scan/nsq095
Dichter, G. S., Richey, J. A., Rittenberg, A. M., Sabatino, A., & Bodfish, J. W. (2012). Reward Circuitry Function in Autism during Face Anticipation and Outcomes.
Journal of Autism and Developmental Disorders. doi:10.1007/s10803-011-1221-1 Elman, I., Lowen, S., Frederick, B. B., Chi, W., Becerra, L., & Pitman, R. K. (2009). Functional
neuroimaging of reward circuitry responsivity to monetary gains and losses in posttraumatic stress disorder. Biological Psychiatry, 66(12), 1083-1090. doi:10.1016/j.biopsych.2009.06.006
Gotlib, I. H., Hamilton, J., Cooney, R. E., Singh, M. K., Henry, M. L., & Joormann, J. (2010). Neural processing of reward and loss in girls at risk for major depression. Archives of General Psychiatry, 67(4), 380-387. doi:10.1001/archgenpsychiatry.2010.13
Haber, S.N. & Calzavara, R. (2009). The cortico-basal ganglia integrative network: the role of the thalamus. Brain research bulletin, 78(2-3), 69-74.
Hardan, A. et al. (2008). An MRI and proton spectroscopy study of the thalamus in children with autism. Psychiatry research. Neuroimaging, 163(2), 97-105.
doi:10.1016/j.pscychresns.2007.12.002
Harrison, B. J., Soriano-Mas, C., Pujol, J., Ortiz, H., López-Solà, M., Hernández-Ribas, R., & ... Cardoner, N. (2009). Altered corticostriatal functional connectivity in
obsessive-compulsive disorder. Archives Of General Psychiatry, 66(11), 1189-1200. doi:10.1001/archgenpsychiatry.2009.152
Knutson, B., Westdorp, A., Kaiser, E., & Hommer, D. (2000). FMRI visualization of brain activity during a monetary incentive delay task. Neuroimage, 12(1), 20–27.
Knutson, B., Fong, G. W., Adams, C. M., Varner, J. L., & Hommer, D. (2001). Dissociation of reward anticipation and outcome with event-related fMRI. Neuroreport, 12(17), 3683-3687.
Kohls, G., Peltzer, J., Schulte-Ruther, M., Kamp-Becker, I., Remschmidt, H., Herpertz- Dahlmann, B., & Konrad, K. (2011). Atypical Brain Responses to Reward Cues in Autism as Revealed by Event-Related Potentials. Journal of Autism
Developmental Disorders. doi: 10.1007/s10803-011-1177-1
Larson, M. J., South, M., Krauskopf, E., Clawson, A., & Crowley, M. J. (2011). Feedback and reward processing in high-functioning autism. Psychiatry Research, 187(1-2), 198-203. doi: 10.1016/j.psychres.2010.11.006
Lin, A., Rangel, A., & Adolphs, R. (2012). Impaired learning of social compared to monetary rewards in autism. Frontiers in neuroscience, 6, 143.doi:10.3389/fnins.2012.00143 Nanda, U., Xi, Z., & Jansen, B. H. (2012). Image and Emotion: From Outcomes to Brain
O'Doherty, J. J., Kringelbach, M. L., Rolls, E. T., Hornak, J. J., & Andrews, C. C. (2001). Abstract reward and punishment representations in the human orbitofrontal
cortex. Nature Neuroscience, 4(1), 95-102. doi:10.1038/82959
O'Doherty, J. J. (2004). Dissociable roles of ventral and dorsal striatum in instrumental conditioning. Science, 304(5669), 452-4.doi:10.1126/science.1094285
Schmitz, N., Rubia, K., van Amelsvoort, T., Daly, E., Smith, A., & Murphy, D. G. (2008). Neural correlates of reward in autism. British Journal of Psychiatry, 192(1), 19-24. doi: 10.1192/bjp.bp.107.036921
Scott-Van Zeeland, A. A., Dapretto, M., Ghahremani, D. G., Poldrack, R. A., &
Bookheimer, S. Y. (2010). Reward processing in autism. Autism Research, 3(2), 53-67. doi: 10.1002/aur.122