by
Haoting Hu
A Masters Project submitted to the faculty of the University of North Carolina at Chapel Hill
in partial fulfillment of the requirements for the degree of Master of City and Regional Planning
in the Department of City and Regional Planning
Chapel Hill
2014
Impact of the Built Environment on Teen Walking Behavior
Contents
Introduction ... 3
Literature Review ... 4
Study Area Description ... 5
Methodology ... 5
Demographic information ... 6
Secondary data ... 7
Logistic Regression Model ... 8
Results ... 8
Built Environment Impact ... 8
Grade Impact ... 10
Perception of Environment Impact ... 10
Final Model Results ... 11
Discussion and Conclusion ... 15
Acknowledgement ... 16
Appendix ... 16
Reference ... 16
Abstract
Introduction
According to the National Center for Health Statistics, obesity has more than doubled in children and quadrupled in adolescents in the past 30 years (National Center for Health Statistics, 20111). Active transport is an important and utilitarian source of physical activity, and therefore is of interest to many researchers and scientists (Wong et al., 20112; Sallis et al., 20043). Teenagers who walk a lot are more physically active than those who are predominantly driven (Tudor-Locke et al., 20034; Alexander et al., 20055). In addition, lifelong patterns of physical activity are established in childhood, so children who walk become more willing to engage in active transportation for daily activities over the long-term (Blair S et al., 19886). Promoting active travel will meet urban planning and public health goals—creating active, healthy, and sustainable lifestyles that can benefit human beings and the environment simultaneously.
Active travel such as walking and bicycling have been suggested as an important source of physical activity for young people (Babey et al., 20097; Frank et al., 20078) Researchers have assessed a wide range of correlations between active travel and demographic, individual, family, social, and economics characteristics and the influence of the physical environment. Some of them have become concerned with built-environmental factors which promote “active transport” modes of travel, driven largely by the need to reduce auto-generated pollution (Handy et al., 20029; Litman, 200310). Others proposed it as a strategy for increasing youth physical activity and decreasing the prevalence of overweight (Sirard and Slater, 200811).
Built environment and neighborhood design affect travel behavior (Frank, 200012; Handy et al., 200513).Two fundamental concepts of urban form that impact active transport are the proximity (land use density and mix) and connectivity between complementary activities (e.g. work, shop, play). A fair number of studies now decompose built environment into a variety and specific factors, such as access to post offices, bus stops, convenience stores, news agencies, shopping malls, and transit stations where different structure and function of built environment could contribute to a different result (McCormack, 200714).
Most of them demonstrate the relationship between built environment and physical activities in terms of adults and dependent children. Less attention has been paid to the transitional period between 15 to 18 years old when youth began to decrease physical activity with the decline being greatest in girls (Sallis, 199315; Booth et al., 199716; Kimm et al., 200217).
In order to evaluate the built environment association with teenager’s walking behavior and supplement the way of stratifying built environment in a microscopic level, I use ArcGIS to develop precise measures of the built environment and analyze a unique longitudinal dataset on teenage girls in San Diego and Minneapolis to quantify the walking behavior. Although the data is from these two cities only, rather than from nationwide survey, I try to answer the general questions of the influence of built environment on walking for adolescents:
1) What is the built environment’s impact on adolescent girls’ walking behavior? 2) How do different aspects of the built environment (such as restaurants,
Literature Review
Many researchers have studied built environment impact on travel mode (Simons et al., 201318), physical activity (Handy et al., 200219; Jarrett et al., 201320), and health issues (Slater et al., 201321). The link between the built environment and human behavior has long been of interest to the field of urban planning, but direct assessments of the links between the physical activity from built environment and health is limited (Handy et al., 2002).
Most articles agree that the built environment influences active travel for adults (Frank, 2000; Handy et al., 2005). Physical design elements advocated by the new urbanism movement (such as mixed land uses, higher densities, and improvements in street and sidewalk connectivity) change the price or utility of travel, and therefore increase active travel (Handy et al., 2002). Proximity and mix of destinations appears strongly associated with walking for transport, but not walking for recreation or vigorous activity (McCormack et al., 2007). Increasing the diversity of destinations may contribute to adults doing more transport-related walking and achieving recommended levels of physical activity (McCormack et al., 2007). Although strong evidence shows particular urban forms like intersections and sidewalk have impact on the physical activities for adults, comparable association in children has not been sufficiently examined (Buck et al., 201122).
Relationship between active travel and urban form may differ for children than for adults (Frank et al., 2007). For example, mixed land use (i.e., having commercial destinations within walking distance) may not be relevant with active travels for children but is an important environmental factor for adults (Ewing et al., 200423). Children’s active travel behavior has a direct relationship with many effects such as travel time and distance, trip purpose, and the car possession of the household. The degree of urbanization is also another important explanatory variable for participation in walking and bicycling by children (Kemperman and Timmermans, 201224). Dense urban residential structure allowed for independent mobility but did not promote active transport (Broberg etc., 201225). More importantly, neighborhoods with a greater proportion of park area are associated with greater physical activity in young children (Roemmich et al., 200626). Other factors include age, gender, independent mobility (Villanueva et al., 201227), family income, neighborhood safety and aesthetics (Vires et al., 201028), and even ethnicity (Frank et al., 2007).
Although many studies examined a range of correlates of active travel on children, fewer analyses focused on teenagers between 10-12th grades, because of the undeniable fact that they are more complicated and in the edge between children and adult. Several studies found older children were more likely to actively commute (Timperioet al., 200629; McDonald, 200730). Also, high-quality and stimulating routes may be possible to encourage teenage pedestrians to walk farther (Rodriguez31 et al., 2014). The access to cars could be the key factors whether they have dependent activities on their parents, since some teenagers who have access to cars may show much more independent travel behavior, such as driving themselves to schools, friends’ house and social activities with their peers. Built environment is important but not the sole factor that influences school travel mode choice (Heinonen et al., 201032).
travel time, high autonomy, good social support, low costs, good access to transport modes and facilities, and good weather was important for choosing active transport over other transport forms for travelling short distances to various destinations. Other well-known factors such as safety, ecology and health seemed not to have a big influence on their transport mode choice. Two more articles have same result that perceptions of neighborhood safety are not associated with adolescent active commuting (Babey et al., 2009; Evenson et al., 2006).
Study Area Description
San Diego County is located in the southwestern corner of the State of California, on the coast of the Pacific Ocean in Southern California with 4,526 square miles and 3,095,313 people in 2010 (2010 census). Reported adolescent girls are from 3 high schools within San Diego County where 298,088 children are under 18 years old and 59 % of people are white. 29% of people are Hispanic or Latino origin. The median family income in the past 12 months (in 2012 inflation adjusted dollars) for families with own children is $70,806. 19% of them live with public assistance (U.S. Census Bureau, 2008-2012 American Community Survey).
Minneapolis-Saint Paul is the most populous urban area in the U.S. state of Minnesota, and is composed of 182 cities and townships built around the Mississippi, Minnesota and St. Croix rivers. The area is also nicknamed the Twin Cities for its two largest cities, Minneapolis, with the highest population, and Saint Paul, the state capital. Reported adolescent girls are from 3 high schools within Hennepin County that contains Minneapolis city and Ramsey County that has Saint Paul city. According to the 2010 census, the population is 1,661,065 for the two counties where 403,233 children under 18 years old and 73% of people are white. Only 7% of people in these two counties are Hispanic or Latino origin. The median family income is $61,586, which is less than the income in San Diego. Approximately one-quarter of Minneapolis/St. Paul residents receive public assistance (U.S. Census Bureau, 2008-2012 American Community Survey36). Minneapolis traditionally has followed urban growth patterns similar to Manhattan’s strict grid system. However, in an urban planning effort to utilize the automobile, a system of freeways has been created over the past fifty years to support urban growth.
Data in 2008-2012 American Community Survey suggest adults in Minneapolis are more likely to use non-auto travel modes with 14 percent of people taking public transportation to work, 6 percent of people walk and 4 percent bicycling; compared with San Diego, only 4 percent of people take public transit and less than 4 percent people walking or bicycling. No matter whether 2010 TAAG2 teenage girls’ activity diary and GPS data shows consistent travel mode choices with adults, these two cities have different travel patterns and trends.
Methodology
Data on teenage girls’ walking behavior in San Diego and Minneapolis were collected between 2008 and 2010 from selected participants who had participated as 8th graders in the Trail of Activity for Adolescent Girls. Stevens, et al.37 (2005) provides information on the protocols of the original TAAG study.
McDonald et al. 38(2014) gives clear data cleaning process for these diaries. Researchers determined the street address using online maps based on self-reported information in the diary when respondents provided a partial address or location description. Abnormal activities that were 70 kilometers away from home or downtown were deleted.
The dependent variable is binary and distinguishes whether the respondent reported any walking trips during their 7-day activity diary. For over 90% of respondents, this information is available at two time points – 2008 and 2010. In total, information on travel mode is available for 294 girl-waves in San Diego with 6529 trips and 7412 trips for 296 girl-waves in Minneapolis (table 1). In San Diego, approximately 65 percent of students report at least one walking trips, whereas in Minneapolis only 39 percent reported at least one walking trip. The average number of walking trips for each respondent in San Diego is twice in Minneapolis.
Table 1: Reported Travel Mode
Minneapolis San Diego
Wave 1 Wave 2 Wave 1 Wave 2
Number of students 150 146 153 141
Percent of students have at
least one walking trips 46.7% 31.5% 68.0% 61.0% Average number of walking
trips for each student 1.7 1.0 3.2 2.5 Percent of all trips that use
walk 6.8% 3.8% 15.4% 11.4%
Demographic information
Respondents completed surveys which included information on age, grade, race, access to own cars, employment, free lunch qualifications, parental employment and education, licensure, and body mass index. Some variables changed over time (e.g. age, grade, licensure, access to own cars) while others were stable (e.g. race, parental education, free lunch qualifications). Regional differences between Minneapolis and San Diego include licensure, access to own cars, race (White and Latina), free lunch qualifications, parental education and teenage girls’ employment status. In San Diego, less than 10 percent teenage girls had full driver licenses compared with 14-37 percent in Minneapolis. Over half the girls identified themselves as Latina compared with 4 percent in Minneapolis. Mother’s education level, teen employment status and access to household vehicles were lower in San Diego, while low income percentage represented by the enrollment of federal free lunch program was higher (table 2).
Table 2: Demographics Characteristics Minneapolis San Diego
Wave 1 Wave 2 Wave 1 Wave 2
Number of students 150 146 153 141
Mean Age 16.4 17.4 16.3 17.2
Mean Grade 10.5 11.5 10.5 11.5
License Category
Learner's 28.0% 54.8% 5.2% 11.4%
Provisional 12.7% 17.8% 8.5% 21.3%
Full License 36.7% 14.4% 9.8% 9.9%
Has Access to Own Car 31.3% 55.5% 16.3% 26.2%
White 82.0% 82.9% 24.2% 25.5%
Latina1 4.0% 4.1% 54.2% 52.5%
Asian 7.3% 6.8% 7.8% 7.8%
Black 3.3% 2.7% 5.9% 5.7%
Qualifies for Free School
Lunch 16.0% 17.8% 35.9% 34.8%
Mother has College
Education 55.3% 53.4% 17.8% 18.4%
On School Team(s) 53.3% 47.3% 43.1% 36.9%
Employed 48.7% 59.6% 12.4% 16.3%
Body Mass Index2 22.98 23.14 24.19 24.62
1-Latina people are not included in counts of white or black. 2-Normal weight = 18.5–24.9; Overweight = 25–29.9; Obesity = BMI of 30 or greater from U.S. Department of Health & Human Services.
Secondary data
One type of objective measure of the built environment is those focused on access to destinations (McCormack, Giles-Corti, and Bulsara 2008). Built environment data come from 2010’s Reference USA database, which includes longitude and latitude and type of common destinations throughout the US. I identified 12 types of destinations using NAICS and SIC code. The classification table defining the scope of each type is in the appendix part of this paper and the 12 destination types are: restaurants/food outlets, post offices, museums, cinemas, liquor stores, libraries and bookstores, supermarkets and grocery stores, convenience stores, other retail stores, local recreation facilities, amusement parks, and shopping centers and malls. Besides those destinations, schools and parks shapefiles are also taken into account.
To assess destinations in the local environment, I measured the number of above 14 common destinations within 800 and 1600m (straight-line) of respondents’ residences as well as distance to the closest destination of each type. The 800m and 1600m buffers are designed because research suggests that walkable distances for 10-12 year-old children range from 250 to 1600m (Timperio et al., 2006; McDonald and Alborg, 200939), resulting in ‘neighborhood’ definitions ranging between 400 and 1600m distances around individual’s homes (Hooper et al., 201240
). Since this dataset used activity diaries between 10th to 12th grade teenage girls, larger activity space around home is expected and therefore I decide to use 800m and 1600m buffer for calculating the surrounding built environment. The distance to the closest destination incorporated network distances. The street network was provided by ArcPad 10 StreetMap Premium Tele Atlas N AMER (2009’s Nation Wide Street Network Dataset). All the network distance calculation of each category was finished by ArcGIS network analyst tools. For polygon layer-parks, I generated points at park boundaries with 25 m intervals to represent ‘access points’. The access point closest to the girl’s house was used for network distance calculation.
the diversity of destinations is important for adults in the development of new neighborhoods and for retrofitting the existing neighborhoods (McCormack, Giles-Corti, and Bulsara 2008). Their impacts on adolescents are not consistently significant and have mixed results; therefore I include them in my independent variables list.
Table 3: Built Environment Data
Minneapolis San Diego
Wave 1 Wave 2 Wave 1 Wave 2
Destinations within 800m 8.5 8.7 11.6 11.8
# of Types of Destinations within 800m 3.2 3.3 4.8 4.9
Destinations within 1600m 32.8 32.3 44.0 44.3
# of Types of Destinations Within 1600m 7.3 7.3 8.5 8.5
The average destinations within 1600 meters buffer of respondents’ residence in two cities are four times destinations within the 800 meters buffer, which meets my expectation because of the circular buffer radius assumption. Meanwhile, the average number of destination types within 1600 meters buffer is twice the number of destination types within 800 meters buffer. In order to reduce the multicollinearity between the 800 meters measures and the 1600 meters measures, I use 800 meters buffer and donut buffer between 800m and 1600m as study built environment area in logistic regression model. Final donut buffer destination counts and destination types in the logistic regression model subtract the 800m’s result from 1600m’s. San Diego respondents had 37 percent more destinations close to home than Minneapolis respondents.
Logistic Regression Model
Logistic regression is conducted to evaluate built environment impact on teenage girls’ walking behavior. Logistic regression is appropriate because the dependent variable is a binary variable indicating whether respondents have walking trips (1 is yes and 0 is no). Independent variables are the built environment factors, as well as important covariates such as grade, driver license, access to own car, race etc.
The odds ratio refers to the probability of teenage girls having walking
trips over not having walking trips. X variables here contain built environment factors and other control variables.
Results
Built Environment Impact
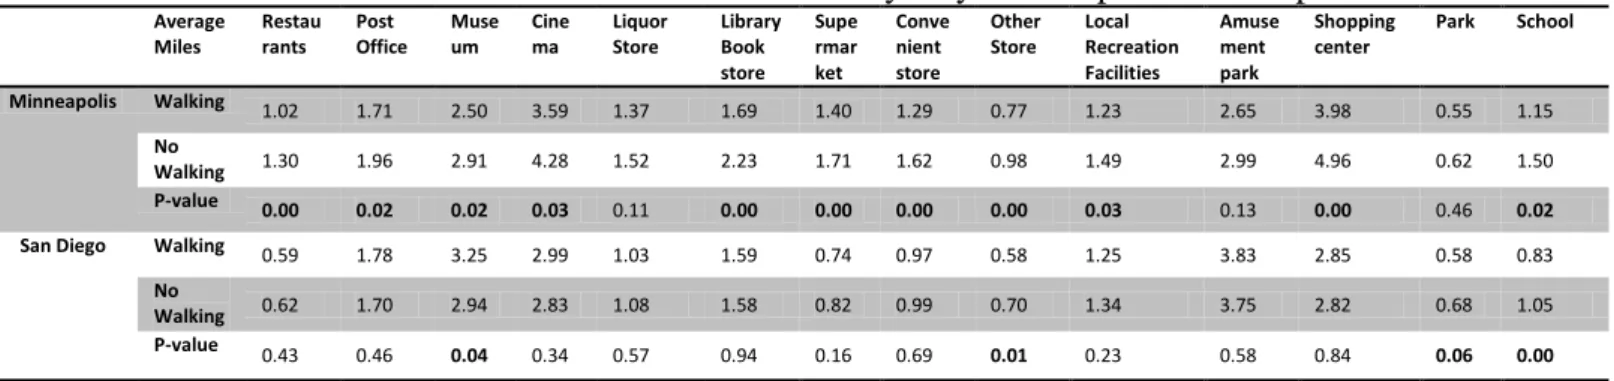
Having more restaurants, liquor stores, library or book stores, convenience stores, other stores, parks, and schools near home are correlated with teenage walking trips for San Diego and Minneapolis. For Minneapolis with 800m buffer (table 5), having restaurants (P=0.06), museums (P=0.03), convenience stores (P=0.02), and schools (P=0.08) are associated with teenage girls’ walking behavior. Whereas in San Diego, cinemas (P=0.08), libraries or book store (P=0.07), shopping centers (P=0.03), parks (P=0.05), and schools (P=0.00) are associated with walking. Built environment within donut buffer between 800m radius and 1600m radius shows different pattern (table 6). In Minneapolis, number of restaurants (P=0.00), liquor stores (P=0.04), library book stores (P=0.00), supermarkets (P=0.02), convenience stores (P=0.00), other stores (P=0.02), local recreational centers (P=0.05), amusement parks (P=0.08), parks (P=0.06) and schools (P=0.04) are statistically significant larger for teenage girls walking than not. In San Diego, only museums (P=0.07) that reflect daily necessary distance facilitate walking. Further relationships between precise physical environment factors and teenage girls’ walking behavior controlling other non-environment factors are analyzed through logistic regression model in the later part of this paper.
Table 4: Distance to Nearest Destinations by City and Respondent Group Average Miles Restau rants Post Office Muse um Cine ma Liquor Store Library Book store Supe rmar ket Conve nient store Other Store Local Recreation Facilities Amuse ment park Shopping center
Park School
Minneapolis Walking 1.02 1.71 2.50 3.59 1.37 1.69 1.40 1.29 0.77 1.23 2.65 3.98 0.55 1.15 No
Walking 1.30 1.96 2.91 4.28 1.52 2.23 1.71 1.62 0.98 1.49 2.99 4.96 0.62 1.50 P-value 0.00 0.02 0.02 0.03 0.11 0.00 0.00 0.00 0.00 0.03 0.13 0.00 0.46 0.02 San Diego Walking 0.59 1.78 3.25 2.99 1.03 1.59 0.74 0.97 0.58 1.25 3.83 2.85 0.58 0.83
No
Walking 0.62 1.70 2.94 2.83 1.08 1.58 0.82 0.99 0.70 1.34 3.75 2.82 0.68 1.05 P-value
0.43 0.46 0.04 0.34 0.57 0.94 0.16 0.69 0.01 0.23 0.58 0.84 0.06 0.00
Table 5: Count of Destinations within 800m Buffer Average Counts Restau rants Post Office Mus eum Cine ma Liquor store Library book store Supe rmar ket Conve nient store Other Store Local Recreation Facilities Amuse ment park Shopping center
Park School
Minneapolis Walking
2.59 0.16 0.09 0.04 0.28 0.22 0.22 0.28 3.69 0.51 0.14 0.02 2.03 0.58 No
Walking 1.37 0.10 0.02 0.04 0.24 0.13 0.18 0.13 2.02 0.42 0.13 0.02 1.99 0.42 P-value
0.06 0.12 0.03 0.87 0.58 0.12 0.57 0.02 0.11 0.28 0.84 0.97 0.84 0.08 San Diego Walking 4.59 0.15 0.04 0.06 0.54 0.23 1.02 0.69 2.67 0.34 0.01 0.12 0.95 0.92
No
Walking 3.87 0.13 0.05 0.01 0.49 0.13 1.06 0.64 2.2 0.34 0.01 0.05 0.78 0.58 P-value 0.31 0.77 0.64 0.08 0.62 0.07 0.81 0.69 0.25 0.94 0.94 0.03 0.05 0.00
Table 6: Count of Destinations within Donut Buffer between 800m and 1600m Average Counts Restau rants Post Office Muse um Cine ma Liquor Store Library Book store Supe rmar ket Conve nient store Other Store Local Recreation Facilities Amuse ment park Shopping center
Park School
Minneapolis Walking 9.13 0.42 0.13 0.07 1.16 0.76 0.96 1.20 8.88 1.84 0.31 0.14 3.94 1.20 No
Walking 5.32 0.34 0.11 0.05 0.87 0.43 0.65 0.72 5.22 1.39 0.19 0.12 3.35 0.91 P-value 0.00 0.25 0.53 0.56 0.04 0.00 0.02 0.00 0.02 0.05 0.08 0.59 0.06 0.04 San Diego Walking 13.45 0.25 0.07 0.13 1.25 0.59 2.95 1.20 8.59 0.56 0.05 0.15 2.05 1.96
No
Grade Impact
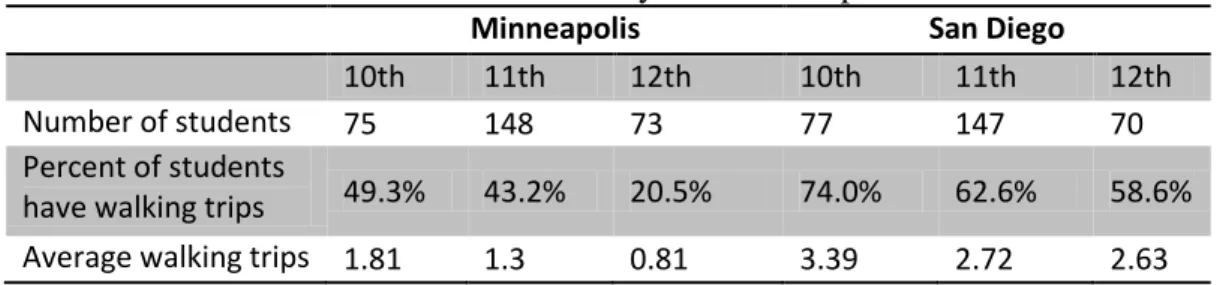
Many studies on children’s travel behavior have mentioned the importance of parental surveillance (Pooley, Turnbull, and Adams, 200541; Holt et al., 200942; Villanueva et al., 2012). Since ten to twelfth-graders have more independence on walking; their mode choices reflect their own attitudes and mode preferences. Broberg (2012) stated that the age of the child was significantly associated with independence and activity. Younger children travelled significantly more often to the places on foot or by bicycle, while older children used public transport, with the proportion of places travelled to by car. Although older children have less active travel than younger children, the places they traveled are often significantly further away from home.
My findings agree with his theory that older adolescents have less active travel (table 7). The percent of students having walking trips and average walking trips decreases with higher grades both in San Diego and Minneapolis. In Minneapolis, higher grades are associated with less walking behavior (chi-square with 2 degree of freedom, p value is 0.0006); whereas in San Diego, this conclusion is not statistically significant (chi-square with 2 degree of freedom, p value is 0.1127). However, the overall effect is statistically significant that higher grades are associated with less walking controlling for two cities (General Association with 2 degree of freedom, p value is 0.0004). Therefore, grade or age impacts adolescents’ walking. Besides age, San Diego adolescent girls’ average walking trips and percent of students have walking trips are around twice large than Minneapolis. The stark difference between San Diego and Minneapolis suggest the significant impact of location.
Table 7: Summary of Grade Impact
Minneapolis San Diego
10th 11th 12th 10th 11th 12th
Number of students 75 148 73 77 147 70
Percent of students
have walking trips 49.3% 43.2% 20.5% 74.0% 62.6% 58.6%
Average walking trips 1.81 1.3 0.81 3.39 2.72 2.63
Perception of Environment Impact
Respondents completed 10 survey questions about their perception of built environment near their home. They were asked to tell how much they agree or disagree with the following statements, such as “There are many places I like to go within easy walking distance of my home”, “There are sidewalks on most of the streets in my neighborhood”, “It is safe to walk or jog in my neighborhood” etc. Teenage girls were more inclined to walk if there were many places they like to go within easy walking distance of their homes, but would not walk if nearby interesting places are absent. Subjective impression of surrounding environment can have direct impact on teenage girls’ walking behavior (table 8). However, perceptions of safety and crime issue are not that much important (table 9).
more specific measures in understanding adolescent and parental safety concerns related to active commuting. Evenson (2006) suggest it may be that parents' perceptions of safety are more important than those of youth in determining active transport to school. In fact, the Australian study found that there were some discrepancies between parental and child report of perceptions of traffic and safety and that indeed the parental perceptions might be more important (Timperio et al., 200443). Also, it could be explained by the age group, as older adolescents get to make more travel decisions by themselves; they are less influenced by parental concerns about safety issues than younger adolescents (Wong et al., 201144). The third explanation is related with effectiveness of the attitude survey. Although a lot of participants said something about safety, it did not seem to be a very important factor of transport mode choice (Simons et al., 2013). Some respondents reported safety concerns to show their carefulness but would not change their transport mode for safety reasons. Therefore, I only include the perceived goodness of built environment as one of the independent variables.
Table 8: There are many places I like to go within easy walking distance of my home dummy_walk Disagree
a lot
Disagree a little
Neither Agree nor Disagree
Agree a little
Agree a lot
MN Walking 26.9% 32.3% 34.0% 40.0% 52.9%
SD Walking 48.7% 59.6% 67.4% 63.2% 78.5%
Table 9: It is safe to walk or jog in my neighborhood dummy_walk Disagree
a lot
Disagree a little
Neither Agree nor Disagree
Agree a little
Agree a lot
MN Walking 33.3% 38.5% 56.0% 47.4% 33.5%
SD Walking 61.5% 58.5% 58.2% 72.5% 65.5%
Final Model Results
I created five models to test the associations between the built environment and walking trips of teenage girls (table 10). All models include the same demographic and attitudinal factors. The first model uses aggregate metrics of the built environment – street density and the number of types of destinations within 1600m. The remainder of the models attempt to disentangle built environment impacts by looking at proximity by specific destinations such as supermarkets and libraries. Models 2 to 4 look at the number of destinations by type within specific buffers. The fifth model relies on distance from each respondent’s home to the closest destination.
Aggregated built environment variables are significant in the first model with Pseudo R2 equals to 0.165. Street density (P<0.10) and total destinations (P<0.05) are significant, but diversity of destination variable is excluded in the model because of its multicollinearity issue with these two and place controlling variables.
centers (P<0.05), and schools (P<0.01) are statistically significant. For model 3, number of post offices (P<0.10), library or bookstores (P<0.10), shopping centers (P<0.10), and schools (P<0.10) are statistically significant. For model 4, only number of post offices (P<0.10), library or bookstores (P<0.05), and convenience stores (P<0.10) are statistically significant.
Model 4 is preferred because of the smallest AIC (725.753) and BIC (852.777) among the three models. AIC and BIC are both penalized-likelihood criteria. AIC is an estimate of a constant plus the relative distance between the unknown true likelihood function of the data and the fitted likelihood function of the model, so that a lower AIC means a model is considered to be closer to the truth. BIC is an estimate of a function of the posterior probability of a model being true, under a certain Bayesian setup, so that a lower BIC means larger likelihood to be the true model. This model shows having more commercial retail stores (such as library or bookstores, and convenience stores) close to homes are likely to increase teenagers’ walking trips.
Model 5 specifically measures the impact of distance from each respondent’s home to the closet destination. Living close to restaurants, library or bookstores, convenient stores, other stores, amusement parks, shopping centers, parks, and schools facilitate walking. Whereas, living far away from post offices, liquor stores, and amusement parks promote adolescents’ active walking behavior. However, only distance to the nearest other stores variable (P<0.05) is statistically significant. The Pseudo R2 for this model is 0.178, which is better than the model 1(0.165) but worse than the model 4(0.183).
Social demographic variables have significant and consistent impact on teenage girls walking behavior across all models. Access to household vehicles, being twelfth grade, and white race reduce teenage girls’ likelihood of walking in San Diego and Minneapolis. While, mother having college or higher degree, teenagers eligible for federal free lunch and have good perception of nearby places, dense street density, and more surrounding total destinations have higher likelihood of having walking behaviors. Similar to previous literature result, logistic regression indicate that those more likely to actively commute were from lower-income families and other races (not white). Teenagers’ active travel is limited due to car possessions.
Table 10: Factors Influencing Adolescent Walking Behavior Dependent Variables Model 1:
Aggregate Impact
Model 2: 800m Buffer
Model 3:
800m and 1600m Donut Buffer
Model 4: 1600m Buffer
Model 5: Distance Impact
San Diego 0.547 0.986** 0.823 0.752 0.459
Access to Own Car -1.000*** -1.128*** -1.140*** -1.058*** -1.008***
Year 0.034 0.115 0.118 0.071 0.048
Grade11 -0.009 -0.025 -0.011 -0.017 -0.048
Grade12 -0.993** -1.078** -1.079** -1.070** -1.126**
San Diego*Grade11 -0.454 -0.515 -0.596 -0.52 -0.429
San Diego*Grade12 0.391 0.342 0.225 0.337 0.518
Mother Has College Degree 0.620*** 0.555** 0.612*** 0.561** 0.569**
Free Lunch 0.483** 0.419* 0.448* 0.486** 0.478**
Employed 0.035 -0.044 -0.031 0.016 0.014
White -0.607** -0.529** -0.574** -0.559** -0.545**
Perception of Good Places Nearby
Agree a Lot 0.840** 0.814** 0.768** 0.711* 0.785**
Aggregate Built Environment Impact
Street Density (mile per square mile) 6.632*
Total Destinations (1600m) 0.008**
Specific Built Environment Factors Impact within 800m Buffer, 800-1600m Donut Buffer, or 1600m Buffer
800m Buffer 800m Buffer 1600m Donut Buffer 1600m Buffer
Number of Restaurants -0.01 0.012
Number of Post offices -0.653* -0.715* -0.391 -0.474*
Number of Museums 0.287 0.68 0.395 0.445
Number of Cinemas -0.103 -0.075 0.032 0.095
Number of Liquor Stores -0.248 -0.293 -0.008 -0.049
Number of Library or Bookstore 0.203 0.205 0.298* 0.296**
Dependent Variables Model 1:
Aggregate Impact
Model 2: 800m Buffer
Model 3:
800m and 1600m Donut Buffer
Model 4: 1600m Buffer
Model 5: Distance Impact
Number of Convenience Store 0.234 0.255 0.154 0.173*
Number of Other Stores 0.037 0.02 -0.011 -0.002
Number of Local Recreation Facilities 0.071 0.03 -0.013 -0.009
Number of Amusement Parks -0.418 -0.437 0.372 0.072
Number of Shopping Centers 1.183** 1.027* 0.127 0.402
Number of Parks 0.124 0.09 -0.012 0.026
Number of Schools 0.388*** 0.246* 0.064 0.101
Distance to Nearest Built Environment (mile)
Distance to Nearest Restaurant -0.204
Distance to Nearest Post Office 0.132
Distance to Nearest Liquor Store 0.244
Distance to Nearest Library or Book Store
-0.097
Distance to Nearest Convenient Store -0.152
Distance to Nearest Other Store -0.666**
Distance to Nearest Amusement Park 0.04
Distance to Nearest Shopping Center -0.036
Distance to Nearest School -0.246
Distance to Nearest Park -0.013
constant -1.132* -0.458 -0.596 -0.596 0.93
Pseudo R2 0.165 0.178 0.196 0.183 0.178
AIC 718.275 731.487 743.215 725.753 723.78
BIC 797.117 862.891 931.56 852.777 837.663
P 0 0 0 0 0
Discussion and Conclusion
This paper has found consistent result with traditional built environment and physical activity research. Street density and number of destinations around home have positive impact on teenage girls’ walking trips. Interestingly, with more library or bookstores (P<0.05) and convenience stores (P<0.10) within 1600 meters buffer around home, more teenage girls tend to walk. The closer other stores (P<0.01) near homes (other store here are identified as the combination of sporting goods stores, cosmetic & beauty supply store, discount department store, hobby toy & game stores, jewelry stores, musical instrument & supplies stores, pet & pet supplies stores, gift novelty & souvenir stores, and other clothing stores), more likelihood of walking trips are found. This may relate with the choice of research object that teenage girls incline to shopping and reading.
Teenage girls’ social and demographic characteristics have a large impact on their walking behaviors. Having access to own car, older age, and white race usually restrain active transport. Whereas, mother has higher education degree and teenage girls enrolled in free lunch program are associate with higher likelihood in walking trips. Family education and environment play a key role for teenagers’ active travel since teenagers from low-income family spontaneously walk, whereas teenagers from middle to high-income family are affected by their mothers’ education level and health consciousness. If parents can appropriately reduce teen driving opportunities, encourage public transit and walking, more physical activities will help reducing the occurrence of obesity and chronic diseases among teenagers.
Furthermore, built environment that teenagers perceived is important for their mode choice. Perception of good places nearby (P<0.05) promotes their walking trips that may need further research effort. Different impacts of existing built environment and the built environment that they perceived could be further investigated in the later studies.
The limitations of this paper include the quality of built environment variables and accuracy of self-reported activities. Although the urban form variables were assessed objectively using geographic information software and the methods have worked well in other studies (McCormack et al., 2008; Heinonen et al., 2010), there are limitations in the completeness and accuracy of all built environment databases-ReferenceUSA. How to stratify and combine the built environment through SIC/SNACODE code can be time consuming and a challenge. Also, I assume the built environment near home is the main determinant of teenage girls’ walking activities. If they have walking trips outside of the 1600 meters home buffer or near schools, the measure of the built environment around the home may not be relevant. If possible, later studies should use the built environment along with teenage girls’ real routes (or around several different frequented locations, i.e. home, school, etc.) to verify its impact. What’s more, the walking variables were all self-reported; therefore, some bias and inaccuracy can be expected. Besides, more dependent variables such as number of walking trips or walking activity spaces may needed to test the strength of their influence.
physical environment, none-built environment factors such as mothers’ education level, family income, race and access to vehicles also have positive or negative impacts on active travel. Other policies geared toward increasing the cost of driving and taxes on additional household vehicles may also be effective agents at promoting physical activity in youth. Therefore, we could increase teenage girls’ physical activities through efforts from their parents and public sectors to increase more active transport options, attractive built environment, and family health consciousness.
Acknowledgement
I would like to thank Professor Noreen McDonald and Dr. Louis Merlin for their help and advices on this paper.
Appendix
Table 11: Resource and Classification of Built Environment Factors
Object SNACODE(6digit+2infousacode) SNATITL SIC SICD
restaurants 72211019 FULL-SERVICE RESTAURANTS 581208 RESTAURANTS 72211002 FULL-SERVICE RESTAURANTS 581215 BOX LUNCHES 72211016 FULL-SERVICE RESTAURANTS 581222 PIZZA 72211021 FULL-SERVICE RESTAURANTS 581224 BARBECUE 72221106 LIMITED-SERVICE RESTAURANTS 581206 FOODS-CARRY OUT 72221103 LIMITED-SERVICE RESTAURANTS 581209 DELICATESSENS 72221104 LIMITED-SERVICE RESTAURANTS 581219 SANDWICHES
72221201 CAFETERIAS 581213 CAFETERIAS
72221202 CAFETERIAS 581214 CAFES
72221203 CAFETERIAS 581254 RESTAURANTS-CYBER CAFES 72221302 SNACK & NONALCOHOLIC BEVERAGE BARS 546101 BAGELS
72221310 SNACK & NONALCOHOLIC BEVERAGE BARS 546105 DOUGHNUTS 72221307 SNACK & NONALCOHOLIC BEVERAGE BARS 546107 COOKIES & CRACKERS 72221315 SNACK & NONALCOHOLIC BEVERAGE BARS 546108 PRETZELS-RETAIL 72221303 SNACK & NONALCOHOLIC BEVERAGE BARS 549938 ESPRESSO & ESPRESSO BARS 72221313 SNACK & NONALCOHOLIC BEVERAGE BARS 581203 ICE CREAM PARLORS 72221304 SNACK & NONALCOHOLIC BEVERAGE BARS 581204 WEDDING BAKERIES 72221311 SNACK & NONALCOHOLIC BEVERAGE BARS 581205 HAMBURGER & HOT DOG STANDS 72221317 SNACK & NONALCOHOLIC BEVERAGE BARS 581218 SODA FOUNTAIN SHOPS 72221320 SNACK & NONALCOHOLIC BEVERAGE BARS 581225 BEVERAGES-NON-ALCOHOLIC-RETAIL 72221305 SNACK & NONALCOHOLIC BEVERAGE BARS 581228 COFFEE SHOPS
72221318 SNACK & NONALCOHOLIC BEVERAGE BARS 581236 TEA ROOMS 72221319 SNACK & NONALCOHOLIC BEVERAGE BARS 581248 JUICE BARS
post office 49111001 POSTAL SVC 431101 POST OFFICES
museums 71211001 MUSEUMS 841201 MUSEUMS
71211004 MUSEUMS 841202 ARTS ORGANIZATIONS & INFORMATION
71211009 MUSEUMS 841210 ART
cinemas 51213101 MOTION PICTURE THEATERS EXCEPT DRIVE-INS 783201 THEATRES-MOVIE
liquor stores 44531004 BEER WINE & LIQUOR STORES 592102 LIQUORS-RETAIL 44531005 BEER WINE & LIQUOR STORES 592103 WINES-RETAIL 44531001 BEER WINE & LIQUOR STORES 592104 BEER & ALE-RETAIL
local library and bookstores
51912003 LIBRARIES & ARCHIVES 823101 FEDERAL GOVERNMENT-LIBRARIES 51912001 LIBRARIES & ARCHIVES 823104 CITY GOVERNMENT-LIBRARIES 51912006 LIBRARIES & ARCHIVES 823106 LIBRARIES-PUBLIC 51912005 LIBRARIES & ARCHIVES 823109 LIBRARIES-INSTITUTIONAL 51912010 LIBRARIES & ARCHIVES 823111 SPECIAL INTEREST LIBRARIES 45121105 BOOK STORES 594201 BOOK DEALERS-RETAIL
45121110 BOOK STORES 594203 LAW BOOKS
45121108 BOOK STORES 594205 COMIC BOOKS
45121101 BOOK STORES 594207 AUTOMOBILE REPAIR MANUALS
supermarkets and grocery stores
44511001 SUPERMARKETS & OTHER GROCERY STORES 541101 FOOD MARKETS 44511005 SUPERMARKETS & OTHER GROCERY STORES 541102 SNACK PRODUCTS 44511002 SUPERMARKETS & OTHER GROCERY STORES 541104 FOOD PRODUCTS-RETAIL 44511003 SUPERMARKETS & OTHER GROCERY STORES 541105 GROCERS-RETAIL
Convenience Stores 44512001 CONVENIENCE STORES 541103 CONVENIENCE STORES
Other Stores 45111035 SPORTING GOODS STORES 594101 NETTINGS-RETAIL 45111037 SPORTING GOODS STORES 594102 PARACHUTES
45111040 SPORTING GOODS STORES 594103 RUNNING & JOGGING SUPPLIES 45111068 SPORTING GOODS STORES 594105 WATER SPORTS EQUIPMENT SALES & SERVICE 45111065 SPORTING GOODS STORES 594106 WATER SKIING EQUIPMENT & SUPPLIES 45111064 SPORTING GOODS STORES 594107 TRAPPING EQUIPMENT & SUPPLIES 45111062 SPORTING GOODS STORES 594109 TENTS-RETAIL
45111061 SPORTING GOODS STORES 594110 TENNIS EQUIPMENT & SUPPLIES-RETAIL 45111059 SPORTING GOODS STORES 594111 SURVIVAL PRODUCTS & SUPPLIES 45111057 SPORTING GOODS STORES 594112 SURFBOARDS
45111055 SPORTING GOODS STORES 594113 SPORTING GOODS-RETAIL 45111048 SPORTING GOODS STORES 594115 SKIING EQUIPMENT-RETAIL 45111044 SPORTING GOODS STORES 594116 SKATEBOARDS & EQUIPMENT 45111045 SPORTING GOODS STORES 594117 SKATING EQUIPMENT & SUPPLIES 45111042 SPORTING GOODS STORES 594119 SAUNA EQUIPMENT & SUPPLIES 45111041 SPORTING GOODS STORES 594120 SADDLERY & HARNESS 45111038 SPORTING GOODS STORES 594122 PLAYGROUND EQUIPMENT
45111033 SPORTING GOODS STORES 594124 MARTIAL ARTS SUPPLIES & EQUIPMENT 45111026 SPORTING GOODS STORES 594126 HOCKEY EQUIPMENT
45111025 SPORTING GOODS STORES 594127 GYMNASIUMS EQUIPMENT & SUPPLIES 45111023 SPORTING GOODS STORES 594129 GUNS & GUNSMITHS
45111021 SPORTING GOODS STORES 594130 GOLF EQUIPMENT & SUPPLIES-RETAIL 45111019 SPORTING GOODS STORES 594131 FISHING TACKLE-DEALERS 45111020 SPORTING GOODS STORES 594132 FISHING TACKLE-REPAIRING & PARTS 45111017 SPORTING GOODS STORES 594133 FISHING BAIT
45111015 SPORTING GOODS STORES 594136 EXERCISE EQUIPMENT-RETAIL 45111014 SPORTING GOODS STORES 594137 DIVERS EQUIPMENT & SUPPLIES 45111010 SPORTING GOODS STORES 594138 CAMPING EQUIPMENT 45111009 SPORTING GOODS STORES 594139 BOWLING APPAREL & ACCESSORIES 45111007 SPORTING GOODS STORES 594140 BICYCLES-PARTS & SUPPLIES 45111006 SPORTING GOODS STORES 594141 BICYCLES-DEALERS
45111005 SPORTING GOODS STORES 594142 BICYCLE RACKS & SECURITY SYSTEMS 45111003 SPORTING GOODS STORES 594143 ARCHERY EQUIPMENT & SUPPLIES 45111002 SPORTING GOODS STORES 594144 AMMUNITION RELOADING EQUIPMENT & SUPLS 45111058 SPORTING GOODS STORES 594146 SURFING EQUIPMENT
45111050 SPORTING GOODS STORES 594147 SNOWBOARDS-RETAIL 45111052 SPORTING GOODS STORES 594148 SOCCER EQUIPMENT & SUPPLIES 45111036 SPORTING GOODS STORES 594151 OUTFITTERS
45111029 SPORTING GOODS STORES 594156 JET SKI-DEALERS 45111027 SPORTING GOODS STORES 594164 HORSE FURNISHINGS
45111070 SPORTING GOODS STORES 594166 OUTDOOR EQUIPMENT ACCESSORIES 45111077 SPORTING GOODS STORES 594171 KITESURFING
45111078 SPORTING GOODS STORES 594173 WAKEBOARDING 45111054 SPORTING GOODS STORES 769933 SPORTING GOODS-REPAIRING
45111022 SPORTING GOODS STORES 769948 GOLF EQUIPMENT-REPAIRING & REFINISHING 45111008 SPORTING GOODS STORES 769974 BICYCLES-REPAIRING
44612003 COSMETIC & BEAUTY SUPPLY STORES 599973 PERFUME-RETAIL
44612001 COSMETIC & BEAUTY SUPPLY STORES 599992 COSMETICS & PERFUMES-RETAIL 45211203 DISCOUNT DEPARTMENT STORES 531101 RESIDENT BUYERS 45211101 DEPARTMENT STORES EXCEPT DISCOUNT 531102 DEPARTMENT STORES 45211201 DISCOUNT DEPARTMENT STORES 531104 RETAIL SHOPS 45211204 DISCOUNT DEPARTMENT STORES 531110 WHOLESALE CLUBS 45112042 HOBBY TOY & GAME STORES 509955 MAGNETS-RETAIL (WHLS) 45112011 HOBBY TOY & GAME STORES 594501 CRAFT SUPPLIES 45112029 HOBBY TOY & GAME STORES 594502 MUSIC BOXES
45112014 HOBBY TOY & GAME STORES 594504 DOLL CLOTHING & ACCESSORIES 45112026 HOBBY TOY & GAME STORES 594505 MINIATURE ITEMS FOR COLLECTORS 45112025 HOBBY TOY & GAME STORES 594506 MAGICIANS SUPPLIES 45112023 HOBBY TOY & GAME STORES 594507 KITES-RETAIL
45112021 HOBBY TOY & GAME STORES 594508 HOBBY & MODEL CONSTR SUPPLIES-RETAIL 45112020 HOBBY TOY & GAME STORES 594509 GAMES & GAME SUPPLIES
45112017 HOBBY TOY & GAME STORES 594510 DOLLS-RETAIL
45112015 HOBBY TOY & GAME STORES 594511 DOLL HOUSES & ACCESSORIES 45112006 HOBBY TOY & GAME STORES 594513 CERAMIC EQUIPMENT & SUPPLIES 45112007 HOBBY TOY & GAME STORES 594514 CERAMIC PRODUCTS-DECORATIVE 45112003 HOBBY TOY & GAME STORES 594515 BASKETS
45112035 HOBBY TOY & GAME STORES 594517 TOYS-RETAIL 45112033 HOBBY TOY & GAME STORES 594518 ROCK SHOPS 45112012 HOBBY TOY & GAME STORES 594520 CRAFTS 45112018 HOBBY TOY & GAME STORES 594530 ELECTRIC TRAINS-TOY
45112039 HOBBY TOY & GAME STORES 594539 VIDEO GAMES & EQUIPMENT-SALES & RENTAL 45112041 HOBBY TOY & GAME STORES 594542 TOYS-SPECIALTY
45112045 HOBBY TOY & GAME STORES 594545 BEADS-RETAIL
44831016 JEWELRY STORES 594402 PEARLS
44831020 JEWELRY STORES 594403 WATCHES-DEALERS
44831006 JEWELRY STORES 594404 DIAMONDS
44831005 JEWELRY STORES 594405 DIAMOND SETTERS 44831003 JEWELRY STORES 594407 CLOCKS-DEALERS 44831013 JEWELRY STORES 594408 JEWELRY DESIGNERS 44831012 JEWELRY STORES 594409 JEWELERS-RETAIL
44831010 JEWELRY STORES 594411 GOLD SILVER & PLATINUM-DEALERS
44831008 JEWELRY STORES 594412 GEMOLOGISTS
45114013 MUSICAL INSTRUMENT & SUPPLIES STORES 573601 PIANOS-USED 45114012 MUSICAL INSTRUMENT & SUPPLIES STORES 573602 PIANOS 45114010 MUSICAL INSTRUMENT & SUPPLIES STORES 573603 ORGANS 45114014 MUSICAL INSTRUMENT & SUPPLIES STORES 573604 VIOLINS 45114001 MUSICAL INSTRUMENT & SUPPLIES STORES 573606 ACCORDIONS
45114009 MUSICAL INSTRUMENT & SUPPLIES STORES 573607 MUSICAL INSTRUMENTS-SUPPLIES & ACCES 45114008 MUSICAL INSTRUMENT & SUPPLIES STORES 573608 MUSICAL INSTRUMENTS-DEALERS 45114006 MUSICAL INSTRUMENT & SUPPLIES STORES 573609 MUSIC DEALERS
45114003 MUSICAL INSTRUMENT & SUPPLIES STORES 573611 GUITARS 45391005 PET & PET SUPPLIES STORES 599910 TROPICAL FISH-RETAIL 45391004 PET & PET SUPPLIES STORES 599929 PET SUPPLIES & FOODS-RETAIL 45391003 PET & PET SUPPLIES STORES 599930 PET SHOPS
45391002 PET & PET SUPPLIES STORES 599955 BIRDS
45391001 PET & PET SUPPLIES STORES 599970 AQUARIUMS & AQUARIUM SUPLS 45322049 GIFT NOVELTY & SOUVENIR STORES 594178 GIFTS-CORPORATE
45322002 GIFT NOVELTY & SOUVENIR STORES 594701 BALLOON ARTISTS 45322005 GIFT NOVELTY & SOUVENIR STORES 594705 COLLECTIBLES 45322024 GIFT NOVELTY & SOUVENIR STORES 594707 NOVELTIES-RETAIL
45322018 GIFT NOVELTY & SOUVENIR STORES 594708 INVITATIONS & ANNOUNCEMENTS-RETAIL 45322017 GIFT NOVELTY & SOUVENIR STORES 594709 NATIVE AMERICAN GOODS
45322015 GIFT NOVELTY & SOUVENIR STORES 594710 GREETING CARDS-RETAIL 45322013 GIFT NOVELTY & SOUVENIR STORES 594712 GIFT SHOPS 45322012 GIFT NOVELTY & SOUVENIR STORES 594713 GIFT BASKETS & PARCELS 45322033 GIFT NOVELTY & SOUVENIR STORES 594715 SOUVENIRS-RETAIL 45322026 GIFT NOVELTY & SOUVENIR STORES 594716 PARTY SUPPLIES
45322035 GIFT NOVELTY & SOUVENIR STORES 594717 WEDDING ANNOUNCEMENTS & INVITATIONS 45322009 GIFT NOVELTY & SOUVENIR STORES 594720 FAVORS
45322038 GIFT NOVELTY & SOUVENIR STORES 594738 GLASS-HAND BLOWN ART
44811006 MEN'S CLOTHING STORES 561101 MEN'S CLOTHING & FURNISHINGS-RETAIL 44811001 MEN'S CLOTHING STORES 561104 ARMY & NAVY GOODS
44811004 MEN'S CLOTHING STORES 561106 JEANS
44811005 MEN'S CLOTHING STORES 561107 LEATHER CLOTHING-RETAIL 44811011 MEN'S CLOTHING STORES 561109 WORK CLOTHING-RETAIL 44811010 MEN'S CLOTHING STORES 561112 TUXEDOS
44811009 MEN'S CLOTHING STORES 561116 CLOTHING & ACCESSORIES MEN BIG & TALL 44812010 WOMEN'S CLOTHING STORES 562101 WOMEN'S APPAREL-RETAIL
44812006 WOMEN'S CLOTHING STORES 562103 MATERNITY APPAREL 44812002 WOMEN'S CLOTHING STORES 562104 BRIDAL SHOPS 44812001 WOMEN'S CLOTHING STORES 562105 BOUTIQUE ITEMS-RETAIL 44819009 OTHER CLOTHING STORES 563204 CORSETS GIRDLES & BRASSIERES 44819005 OTHER CLOTHING STORES 563205 BRASSIERES
44819016 OTHER CLOTHING STORES 563206 HOSIERY-RETAIL 44819019 OTHER CLOTHING STORES 563210 LINGERIE 44819042 OTHER CLOTHING STORES 563211 GIFTS-SPECIALTY 44813001 CHILDREN'S & INFANTS CLOTHING STORES 564101 BABY ACCESSORIES 44813004 CHILDREN'S & INFANTS CLOTHING STORES 564102 GIRLS APPAREL
44813003 CHILDREN'S & INFANTS CLOTHING STORES 564103 CHILDRENS & INFANTS WEAR-RETAIL 44813002 CHILDREN'S & INFANTS CLOTHING STORES 564115 BABY ACCESSORIES-RENTAL 44814001 FAMILY CLOTHING STORES 565101 CLOTHING-RETAIL 44814002 FAMILY CLOTHING STORES 565104 HAWAIIAN WEAR-RETAIL
44819010 OTHER CLOTHING STORES 569905 COSTUMES-MASQUERADE & THEATRICAL 44819011 OTHER CLOTHING STORES 569906 DRESSMAKERS
44819032 OTHER CLOTHING STORES 569907 WESTERN APPAREL 44819022 OTHER CLOTHING STORES 569910 SHEEPSKIN SPECIALTIES 44819021 OTHER CLOTHING STORES 569911 RIDING APPAREL & EQUIPMENT 44819023 OTHER CLOTHING STORES 569912 SHIRTS-CUSTOM MADE 44819026 OTHER CLOTHING STORES 569913 SPORTSWEAR-RETAIL 44819029 OTHER CLOTHING STORES 569917 T-SHIRTS-RETAIL 44819030 OTHER CLOTHING STORES 569919 TAILORS 44819035 OTHER CLOTHING STORES 569922 UNIFORMS 44819001 OTHER CLOTHING STORES 569932 ALTERATIONS-CLOTHING 44819007 OTHER CLOTHING STORES 569934 CLOTHING-CUSTOM MADE 44819013 OTHER CLOTHING STORES 569943 FENCING APPAREL & EQUIPMENT 44819015 OTHER CLOTHING STORES 569944 CLOTHING FOR THE DISABLED 44819002 OTHER CLOTHING STORES 569947 APPAREL & GARMENTS-RETAIL 44819012 OTHER CLOTHING STORES 569960 EXERCISE & PHYSICAL FITNESS WEAR 44819028 OTHER CLOTHING STORES 569979 T-SHIRTS-CUSTOM PRINTED
Local Amusement and Recreation
71395001 BOWLING CENTERS 793301 BOWLING CENTERS
71394011 FITNESS & RECREATIONAL SPORTS CENTERS 799101 HEALTH CLUBS STUDIOS & GYMNASIUMS 71394009 FITNESS & RECREATIONAL SPORTS CENTERS 799102 GYMNASIUMS
71394017 FITNESS & RECREATIONAL SPORTS CENTERS 799105 HEALTH SPAS
71394013 FITNESS & RECREATIONAL SPORTS CENTERS 799106 PERSONAL TRAINERS-FITNESS 71394023 FITNESS & RECREATIONAL SPORTS CENTERS 799107 PILATES
71394024 FITNESS & RECREATIONAL SPORTS CENTERS 799108 CHILDREN'S FITNESS
71394030 FITNESS & RECREATIONAL SPORTS CENTERS 799111 SPORTS & RECREATION FACILITIES PROGRAM 71394031 FITNESS & RECREATIONAL SPORTS CENTERS 799112 HEALTH & FITNESS CENTER MANAGEMENT 71394015 FITNESS & RECREATIONAL SPORTS CENTERS 799701 RECREATION CENTERS
71394014 FITNESS & RECREATIONAL SPORTS CENTERS 799702 RACQUETBALL COURTS-PRIVATE 71394021 FITNESS & RECREATIONAL SPORTS CENTERS 799703 TENNIS COURTS-PRIVATE 71394019 FITNESS & RECREATIONAL SPORTS CENTERS 799704 SWIMMING POOLS-PRIVATE 71394012 FITNESS & RECREATIONAL SPORTS CENTERS 799705 HOCKEY CLUBS 71394025 FITNESS & RECREATIONAL SPORTS CENTERS 799901 SKATING RINKS 71394004 FITNESS & RECREATIONAL SPORTS CENTERS 799908 BASEBALL BATTING RANGES 71394010 FITNESS & RECREATIONAL SPORTS CENTERS 799935 HALLS & AUDITORIUMS 71394020 FITNESS & RECREATIONAL SPORTS CENTERS 799969 SWIMMING POOLS-PUBLIC 71394022 FITNESS & RECREATIONAL SPORTS CENTERS 799971 TENNIS COURTS-PUBLIC 71394032 FITNESS & RECREATIONAL SPORTS CENTERS 799984 SQUASH COURTS-PUBLIC 71391002 GOLF COURSES & COUNTRY CLUBS 799201 GOLF COURSES 71391004 GOLF COURSES & COUNTRY CLUBS 799202 PUTTING GREENS 71391003 GOLF COURSES & COUNTRY CLUBS 799723 TEE TIMES
Amusement parks 71312003 AMUSEMENT ARCADES 799301 AMUSEMENT DEVICES
71312001 AMUSEMENT ARCADES 799303 ARCADES
71312004 AMUSEMENT ARCADES 799309 RACING SIMULATORS 71311001 AMUSEMENT & THEME PARKS 799601 AMUSEMENT PLACES 71311002 AMUSEMENT & THEME PARKS 799602 WATER PARKS
71311004 AMUSEMENT & THEME PARKS 799604 AMUSEMENT & THEME PARKS
Shopping Centers &Malls
651201 SHOPPING CENTERS & MALLS
Reference
1National Center for Health Statistics. Health, United States. (2011). With Special
Features on Socioeconomic Status and Health. Hyattsville, MD; U.S. Department of Health and Human Services; 2012.
2
3
James F. Sallis et al. (2004). Active transportation and physical activity: opportunities for collaboration on transportation and public health research.
Transportation Research Part A 38 (2004) 249–268.
4Tudor-Locke, C., Ainsworth, B.E., Adair, L.S., Popkin, B.M. (2003). Objective
physical activity of Filipino youth stratified for commuting mode to school. Med. Sci.
Sport Exer. 35, 465–471.
5Alexander, L.M., Inchley, J., Todd, J., Currie, D., Cooper, R., Currie, C. (2005). The
broader impact of walking to school among adolescents: seven day accelerometry
based study. BMJ 331, 1061–1082.
6
Blair S, Clark D, Cureon K. (1988). Exercise and fitness in childhood: implications for a lifetime of health. In Perspective in exercise science and sports medicine: youth, exercise and sport. Edited by: Gisolfi C, Lamb D. Indianapolis (IN): Benchmark Press; 1988:401-430.
7
Babey, S. H., Hastert, T. A., Huang, W., & Brown, E. R. (2009). Sociodemographic, family, and environmental factors associated with active commuting to school among US adolescents. Journal of Public Health Policy, 30, S203-S220.
8
Lawrence Frank, Jacqueline Kerr, Jim Chapman, and James Sallis. (2007). Urban
form relationships with walk trip frequency and distance among youth. American Journal of Health Promotion: March/April 2007, Vol. 21, No. 4s, pp. 305-311. 9
Handy, S.L., Boarnet, M.G., Ewing, R., Killingsworth, R.E. (2002). How the built environment affects physical activity. American Journal of Preventive Medicine 23 (Suppl. 2), 64–73
10
Litman, T. (2003). Active transportation policy issues. Victoria, B.C., Canada. www.vtpi.org/act_tran.pdf
11
Sirard JR, Slater ME. (2008). Walking and bicycling to school: A review. AJLM
2008,1559827608320127. 12
Frank, L.D. (2000). Land use and transportation interaction: implications on public health and quality of life. Journal of Planning Education and Research 20, 6–22. 13
Susan Handy, Xinyu Cao, Patricia Mokhtarian. (2005). Correlation or causality between the built environment and travel behavior? Evidence from Northern California. Transportation Research Part D 10 (2005) 427–444
14
Gavin R. McCormack, Billie Giles-Corti, Max Bulsara. (2007). The relationship between destination proximity, destination mix and physical activity behaviors.
Preventive Medicine 46 (2008) 33–40. 15
Sallis, J. (1993) Epidemiology of physical activity and fitness in children and adolescents. Critical Reviews in Food Science and Nutrition, 33, pp. 403-408. 16
Booth, M., Macaskill, P., McLellan, L., Phongsavan, P., Okely, T., Patterson, J., Wright, J., Mauman, A. and Baur,L. (1997). NSW Schools Fitness and Physical Activity Survey 1997. Sydney, AUS: NSW Department of School Education. 17
Sue Y.S. Kimm et al. (2002). Decline in physical activity in black girls and white girls during adolescence. The New England Journal of Medicine Vol. 347, No.10, 709-715.
18
Dorien Simons et al. (2013). Factors influencing mode of transport in older adolescents: a qualitative study.BMC Public Health, 13, 323. doi: 10.1186/1471-2458-13-323
19
Susan L Handy, Marion G Boarnet, Reid Ewing, Richard E Killingsworth. (2002). How the built environment affects physical activity: Views form urban planning.
20
Jerrett, M, PhD, Almanza, E., MPH, Davies, M., MS, Wolch, J., PhD, Dunton, G., PhD, Spruitj-Metz, D., PhD, Pentz, M.A., PhD. (2013). Smart Growth Community
Design and Physical Activity in Children. American Journal of Preventive Medicine,
45(4), 386-392
21
Sandy J. Slater et al. (2013). Walkable communities and adolescent weight. Am J Prev Med. 2013 February; 44(2): 164–168. doi:10.1016/j.amepre.2012.10.015. 22
Christoph Buck et al. (2011). Development and application of a moveability index to quantify possibilities for physical activity in the built environment of children.
Health & Place 17 (2011) 1191–1201. 23
Ewing R, Schroeer W, Greene W. (2004). School location and student travel: analysis of factors affecting mode choice. Transport Res Rec. 2004;1895:55–63. 24
Astrid Kemperman and Harry Timmermans. (2012). Environmental Correlates of Active Travel Behavior of Children. Environment and Behavior published online 7 December 2012.
25
Anna Broberg, Samuli Salminen, Marketta Kyttä. (2012). Physical environmental characteristics promoting independent and active transport to children’s meaningful places. Applied Geography 38 (2013) 43e52.
26
James N. Roemmich, Leonard H. Epstein etc. (2006). Association of access to parks and recreational facilities with the physical activity of young children.
Preventive Medicine 43 (2006) 437–441.
27
Karen Villanueva, Billie Giles-Corti etc. (2012). Where do Children Travel to and What Local Opportunities Are Available? The Relationship Between Neighborhood Destinations and Children's Independent Mobility. Environment and Behavior
published online 24 April 2012. 28
Vries, de S. I., Hopman-Rock, M., Bakker, I., Hirasing, R. A., & Van Mechelen, W. (2010). Built environmental correlates of walking and cycling in Dutch Urban
children: Results from the SPACE study. International Journal of Environmental Research and Public Health, 7, 2309-2324.
29
Timperio A, Ball K, Salmon J, Roberts R, Giles-Corti B, Simmons D, Baur LA, Crawford D. (2006). Personal, family, social, and environmental correlates of active commuting to school. Am J Prev Med. 2006530:45-51.
30
McDonald NC. (2007). Active transportation to school: trends among U.S. schoolchildren, 1969-2001. Am J Prev Med. 200753 2: 509-1 6.
31
Daniel A. Rodriguez et al. (2014). Influence of the built environment on pedestrian route choices of adolescent girls. Environment and Behavior.
32
Janne Boone-Heinonen et al. (2010). RBeuseairlcth and socioeconomic
environments: patterning and associations with physical activity in U.S. adolescents.
International Journal of Behavioral Nutrition and Physical Activity 2010, 7:45 33
Kelly R Evenson et al. (2006). Girls’ perception of physical environmental factors and transportation: Reliability and association with physical activity and active transport to school. International Journal of Behavioral Nutrition and Physical Activity 2006, 3:28.
34
Reihane Marzoughi. (2011). Barriers to teenage mobility in the greater Toronto Area, Ontario, Canada-Attitudes, concerns, and policy implications. Journal of the Transporation Research Board 2011, pp.61-67.
35
36
U.S. Census Bureau, 2008-2012 American Community Survey. Data retrieved from http://factfinder2.census.gov/faces/tableservices/jsf/pages/productview.xhtml?pid=AC S_12_5YR_S0901
37
Stevens, June, David M. Murray, Diane J. Catellier, Peter J. Hannan, Leslie A. Lytle, John P. Elder, Deborah R. Young, Denise G. Simons-Morton, and Larry S. Webber. (2005). Design of the trial of activity in adolescent girls (TAAG). Contemporary Clinical Trials 26 (2): 223-33.
38
Noreen McDonald et al. (2014). Longitudinal analysis of adolescent girls’ activity patterns in San Diego and Minneapolis: Understanding the influence of the transition to licensure. World Society for Transport and Land Use Research2014 conference
39
Mcdonald, N.C., Alborg, A.E., 2009. Why parents drive children to school: implications for safe routes to school programs. Journal of the American Planning Association 75, 331–342.
40
Hooper, Paula, Foster, Sarah, Nathan, Andrea, & Giles-Corti, Billie (2012) Built
environmental supports for walking. InAinsworth, B. & Macera, C.A. (Eds.) Physical
Activity and Public Health Practice. CRC Press (Taylor & Francis Group), Boca Raton, FL, pp. 257-276.
41
Pooley, C. G., Turnbull, J., & Adams, M. (2005). The journey to school in Britain
since the 1940s: Continuity and change. Area, 37, 43-53.
42
Holt, N. L., Cunningham, C.-T., Sehn, Z. L., Spence, J. C., Newton, A. S., & Ball, G. D. C. (2009). Neighborhood physical opportunities for inner-city children and
youth. Health & Place, 15, 1022-1028
43
Timperio A, Crawford D, Telford A, Salmon J: Perceptions about the local neighborhood and walking and cycling among children.Prev Med 2004, 38:39-47. 44
Wong BYM, Faulkner G, Buliung R, Irving H: Mode shifting in school travel mode: examining the prevalence and correlates of active school transport in Ontario, Canada.