Abstract
This project focuses on evaluating named group recommendation algorithms and analyzing the recommendation output. Our approach is developing a Facebook-based testbed for evaluating how the recommendation can reduce user’s effort to create friend-lists and visually validating the recommendation results. The testbed has three components: a recommendation engine, a friend-list editor, and a tool for visualizing recommendations. The recommendation engine implemented in Facebook mines social graphs to make predictions on friend-lists. The Friend-list Editor allows editing recommendations and measures the efforts a user takes to create friend-lists with and without recommendations. The visualization tool provides a set of visualization methods of social graphs and friend-lists.
1. Introduction
Creating named groups is a common way for Internet users to manage their contacts or friends in social networks. Named groups exist in major social network services but in different formats. In Google+, users add their friends into Google Circles while Facebook users use friend-lists. With these groups, users can enjoy the benefits of performing group specific sharing conveniently, such as sending invitations to some groups and filtering updates from certain groups of friends.
friends and relationships [4]. Their algorithm finds maximal cliques in user’s social graph and merges the cliques that substantially overlap with each other to form groups.
In this work, we focus on creating a Facebook-based testbed that allows the named group recommendation algorithms to be evaluated and recommendation results to be visualized. We have created one testbed for Bacon and Dewan’s algorithm and present it as a starting point for a generic model of such testbeds. It has three components: a recommendation engine, a friend-list editor, and a tool for visualizing recommendations. In the rest of this paper, we discuss the design and implementation of each component of the testbed.
2. Previous Work
Besides Bacon and Dewan’s algorithm, this work also involves two previous studies on Facebook Friend-list recommendation and evaluation: Haoyang Huang’s Undergraduate Honor Thesis [5] and Jacob Bartel’s Doctoral Dissertation [6].
Huang implemented a recommendation system on Facebook that mines users’ social graphs and ran Bacon and Dewan’s algorithm to generate Friend-list predictions. She also created a Facebook app that asks users to edit and evaluate the recommended friend-lists. The friend-list editor takes Huang’s work as a starting point and extends her single-step evaluation to a multiple-step process that compares user behavior in different steps.
current social graph with the existing named groups to generate recommended evolutions of the named groups.
3. Our Approach
As mentioned above, our approach is to create a Facebook-based testbed for evaluating and visualizing recommendation results. The testbed consists of three components, as shown in Figure 3-1. The Recommendation Engine (the engine) mines users’ social graphs, converts them into a proper format, and feeds the data into the algorithms to generate recommendations. The Friend List Editor (the editor) is designed for end-users, which asks end-users to create Friend-lists and edit recommendation results. The Visualization Tool is designed for researchers to determine how well the recommendations worked.
Figure 3-1
notification to users’ Facebook accounts. By clicking the link provided by the notification, the end-users are redirected to the editor. The users’ data in the editor is logged into the department server simultaneously as they edit the recommendations. The visualization tool represents the relationships of friend-lists inside the social graphs. The researchers can use the visualization tool to load the recommendation results and the user data in the editor to visually evaluate the results and the algorithms.
4. Recommendation Engine
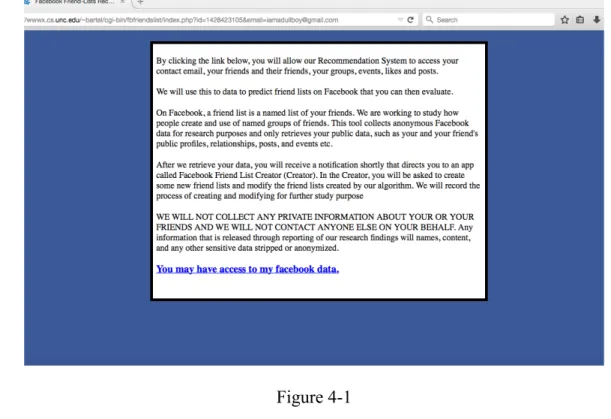
The Recommendation Engine is a Facebook app that mines the users’ social graphs to make prediction on friend-lists. As shown in Figure 4-1, the engine asks for users’ permissions to collect their data related to their Facebook account. All the data is kept anonymous in a secure folder in the department server. We use users’ Facebook Ids to avoid releasing their names.
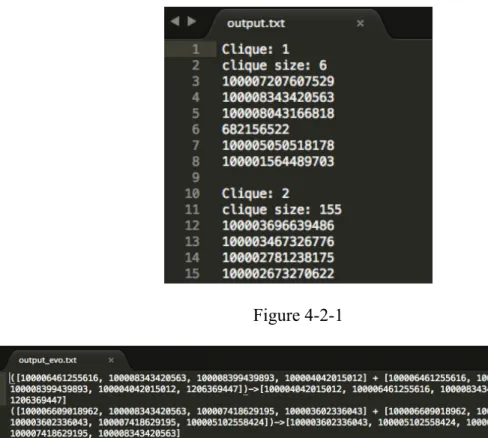
The data gathered include not only the friendships and the social graphs required by Bacon and Dewan’s algorithm but also the history of friendship formation required by Bartel’s algorithm. The friendships and the social graphs are collected through the standard Facebook Graph API [7]. As shown in Figure 4-1-1, each entry of the friendship data contains two user Ids, which indicates the two users are friends.
Figure 4-1-1
However, Facebook does not provide any APIs to collect the history of friendship formation. To gather the data, the engine retrieves at most 400 recent posts from the timelines of the user and user’s friends. It analyzes the seeds retrieved from timelines to identify the posts related to the friendship formation and gathers the timestamp when this friendship is formed. As demonstrated in Figure 4-1-2, the data contains the friendship plus the date and time of when this friendship is formed. With the friendship formation data, the engine can restore the current social graph to a past state and use these data to generate evolutionary recommendations.
Figure 4-1-2 4.2 Recommendation Results
mainly focuses on evaluating and visualizing the algorithms and the results, please refer their work for the details of the algorithms.
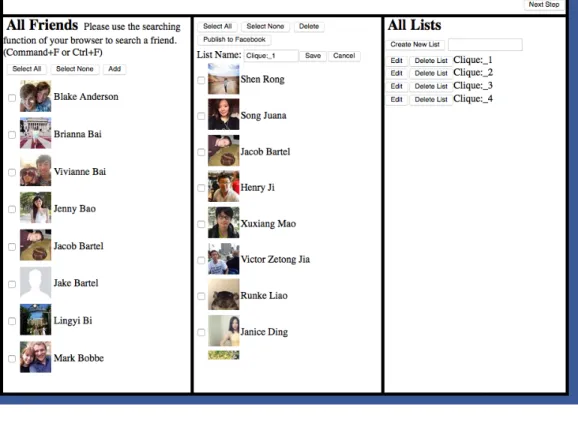
The figure 4-2-1 shows the output of Bacon and Dewan’s algorithm. Each clique in the output file is a recommended friend-list. For Bartel’s algorithm, it generates recommended friend-lists for both the current and past social graphs, which has the same format as Figure 4-2-1. Besides the recommended friend-lists, it merges and matches the results of the old social graph with the results of the current social graph to predict evolution of the named groups. In Figure 4-2-2, each line shows how a list in the past social graph matches a recommended list in the current social graph. And the list after the arrow sign is the evolved friend-list.
Figure 4-2-1
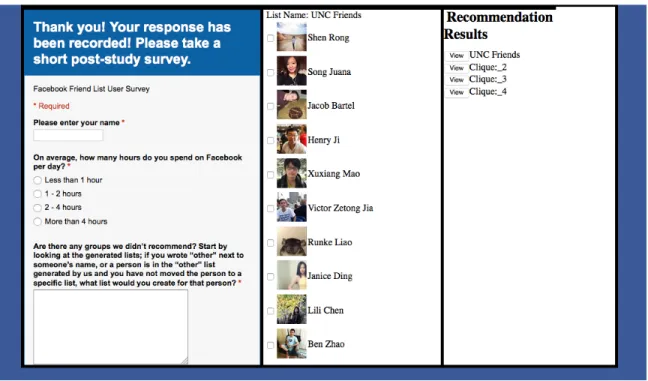
After the engine finish recommending friend-lists, the end-users will be redirected to the editor. The editor is a Facebook app that allows editing recommendations and measures the effort a user takes to create friend-lists with and without recommendations. The end-users are informed of the steps of the experiment (Figure 5-1).
Figure 5-1 5.1 Unser Interface
on the “Deleting” button. The end-user can also give a meaningful name to the friend-lists in the “All List” column by clicking on the “Rename” button. The “Publish to Facebook” button provides the user an opportunity to publish the current working list to his or her Facebook account. The end-user may also discard a list by clicking on the “Discard” button so that the researcher know it’s not a friend-list of the user.
Figure 5-1-1 5.2 Multistep Experiment
1. Undirected Creation 2. Recommendation Edition 3. Directed Creation
4. Post Study Survey
The undirected creation step asks the end-user to create some common friend-lists, such as family members, interest groups, and colleagues (Figure 5-2-1). In this step, the end-user creates the friend-lists without knowing recommendation results because we want to measure how much effort a user takes to create friend-lists manually without recommendation. We assume the effort in this step should include decision-making time and selection time because the end-user needs to think about who belongs to this list and then select this member from the “All Friend” column.
In the recommendation edition step, the end-user can view and edit the recommendation results (Figure 5-1-1). In this step, we intend to measure the user’s effort to create friend-lists with the recommendation results. The effort in this step should only include editing the recommended friend-lists.
The end-user is asked to recreate some recommended lists manually in the directed creation step (Figure 5-2-2). In this step, we want to see how the user creates the friend-lists after viewing the recommended results. The effort in this step should contain mainly the selection time, as the user has already known who belongs to this list from the recommendation results.
The post-study survey is shown in Figure 5-2-3. The survey gives us an opportunity to hear feedbacks from our users.
Figure 5-2-3 5.3 Hypotheses
The reason why we have designed this multistep experiment is to verify the hypotheses we have proposed for the editor. We have come up with the following four hypotheses.
1. The average amount of time to add a member to a list in step 3 should be smaller than step 1.
2. The average amount of time to create a list in step 2 should be smaller than step 3.
3. The average amount of time to make an addition in step 2 is same as the average amount of time to make an addition in step 1.
The rationale of Hypothesis 1 is that the end-user just needs to select the members provided by the recommendation results in step 3. However, he needs to think about who belongs to the list and select the members to the list. Thus, the end-user needs to spend more time on thinking about the members in step 1. The reason of Hypothesis 2 is that we think that users just need to edit the recommended lists in step 2 and the edition takes shorter time than the time of selection in step 3. Hypothesis 3 says that the average time required adding a member is same in step 2 and 3. The logic behind this hypothesis is that the user needs to spend time thinking about which member belongs to a specific group. Hypothesis 4 indicates that the average amount of time to add a member in step 2 is more than the time to delete a member in step 2, as we assume that it is easier to recognize a wrong entry than derive a right entry.
5.4 Data Collection
When the users create and edit lists, the log record users’ behavior, such as mouse clicks, the timestamp of each action, the members added or deleted. The log is in the following format [Date Time Action Target Detail] (Figure 5-4-1).
Figure 5-4-1
With the log, we can calculate some statistics about users’ effort to creating friend-lists and derive conclusions about the hypotheses.
There are five participants who used the Editor. Figure 5-5-1 shows the quantitative results of the study.
Figure 5-5-1
As we can see from Figure 5-5-1, three out of four valid data entries show positive evidence that supports the Hypothesis 1. And all five users indicate that the average time of creating a list of Step 2 is smaller than that of Step 3, which supports Hypothesis 2.
However, we did not find concrete evidence that could support the Hypothesis 3&4. The reason is that the Editor cannot precisely distinguish the time spent on different actions.
6. Visualization Tool
closely related to each other than non-members. Moreover, the visualization tool also wants to verify this fact for the recommended friend-lists. If we can say that the members of the recommended friend-lists are closely related like actual friend-lists, we can determine how good the recommendation algorithm is.
6.1 Jung Graph Visualization
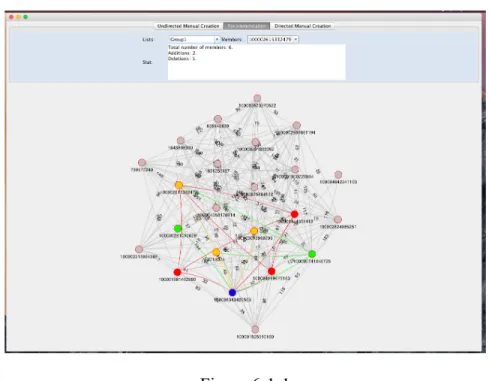
Initially, we developed a non-web standalone user interface for viewing the data collected by the editor and visualize the friend-lists. The application uses Jung Graph Framework [8]. Figure 6-1-1 shows the user interfaces of the recommendation edition step. In addition, the other two steps have the same user interfaces as Figure 6-1-1.
Figure 6-1-1
accepted recommendations, the green nodes represent user’s addition, and the red nodes represent unaccepted recommended members deleted by the user. The grey nodes are all members who are not in this friend-list.
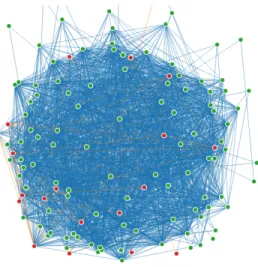
A problem with this approach is that the Jung framework cannot handle large social graphs. When the number of nodes and edges go beyond the capacity of the Jung framework, the graph cannot deliver any useful information as all nodes and edges overlap with each other. Figure 6-1-2 shows a Jung graph representation of a social graph consisting of two hundred friends.
Figure 6-1-2 6.2 D3.js Graph Representation
Figure 6-2-1
Although the D3.js Graph representation is a more capable tool, it still has the same problem as the Jung Graph representation. Figure 6-2-2 shows a large social graph displayed by the D3.js Graph representation.
Figure 6-2-2 6.3 D3.js Matrix Representation
Finally, we tried an adjacency matrix representation to show the social graphs. For example, a user has ten friends. In Figure 6-3-1, a1 to a10 are friends of the user and the colored
the matrix in a way that all members of the friend-list are listed in the left upper corner and the relationships inside the list are colored differently. As shown in Figure 6-3-1, the friend-list consists of a1, a2, a3, and a4 and the relationships among these members are colored in orange.
Figure 6-3-1
D3.js supports the adjacency matrix visualization. The matrix representation solves the capacity problem of the graph representation, as it is able to handle the large social graphs. The Figure 6-3-1 shows a matrix representation of a large social graph. It can easily distinguish the relationships inside the friend-list from the entire social graph.
6.4 Evaluation
that the relationships are denser inside the actual friend-lists. And the matrix representation can obviously show the difference in densities between inside and outside the friend-list.
Figure 6-3-2
Figure 6-4-2
Figure 6-4-4
Figure 6-3-3 shows a matrix representation of a recommended list while Figure 6-4-4 displays a randomly generated friend-list that has the same number of members. By comparing the two matrices, we can draw the same conclusion that the matrix can demonstrate the difference in densities. And it is obvious to identify which graph is more similar to the actual friend-lists.
To sum up, the matrix representation empowered by D3.js is a powerful tool to visualize the relationships of a friend-list. Thus, it can help the researchers to determine how good the algorithms are.
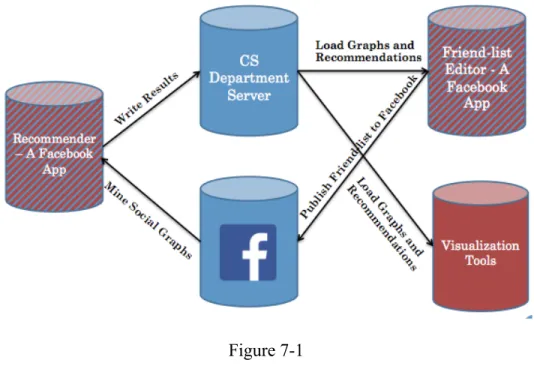
7. Technical Architecture
user’s friends from Facebook’s server and recommendation results from the department server. The data of user behavior collected by the Editor is saved in the department server. The visualization tool also loads the data from the department. But the D3.js tools need a special parser to convert the data into a Json format.
Figure 7-1
8. Conclusion and Future Work
Reference:
[1] Skeels, M. and J. Grudin (2009). When Social Networks Cross Boundaries: A Case Study of Workplace Use of Facebook and LinkedIn. Proc. Group.
[2] Olson, J. S., J. Grudin, et al. (2005). Toward Understanding Preferences for Sharing and Privacy. Proc. CHI.
[3] Newman, MW; Lauterbach D; Munson, SA; Resnick, P; Morris, ME. (2011). "It's not that I don't have problems, I'm just not putting them on Facebook": Challenges and
Opportunities in Using Online Social Networks for Health. Proc. CSCW.
[4] Bacon, K. and Dewan, P. (2011) Mixed Initiative Friend-List Creation. Proc. ECSCW 2011,
[5] Huang, H, (2013) Undergraduate Honor Thesis. Proc. University of North Carolina at Chapel Hill
[6] Bartel, J. (2015) Doctoral Dissertation. Proc. University of North Carolina at Chapel Hill [7] Facebook Graph API (2013) https://developers.facebook.com/docs/reference/api/
[8] O’Madadhain, J., D. Fisher, P. Smyth, S. White, and Y.-B.Boey (2005), Analysis and Visualization of Network Data using JUNG. Journal of Statistical Software, 2005. 25(2).
Appendix A: D3.js Matrix Representation of Real Friend-lists from Kelli Bacon’s Data and
Corresponding Randomly Generated Friend-lists
Appendix B: D3.js Matrix Representation of Recommended Friend-lists and
Corresponding Randomly Generated Friend-lists
Appendix C: How to Use the D3js Matrix Representation
The D3.js matrix representation reads data in Json as it is a web application. We have created parsers to convert Kelli Bacon’s data of real lists and our recommendation data to the required Json format. After preparing the Json data input, users can easily feed the data into our application to produce the matrix representation of friend-lists.
To run the D3.js matrix representation, you have to establish a HTTP server to host the codes. In our project, we usually establish a simple HTTP server in our local machine with the following Python command creates a local host at port 8888.
python –m SimpleHTTPServer 8888