Causes of Death in North Carolina Tuberculosis Patients, 1993-2004
By Zachary Boas
A Master's Paper submitted to the faculty of the University ofNorth Carolina at Chapel Hill
In partial fulfillment of the requirements for the degree of Master of Public Health in
the Public Health Leadership Program.
Chapel Hill
2007
Advisor
Title: Causes of Death in North Carolina Tuberculosis Patients, 1993-2004 Running Head: Causes of death following TB in North Carolina
SUMMARY
Setting: A cohort of 5,311 patients reported to the North Carolina Tuberculosis Control program from 1993-2003.
Objective: To examine the leading causes of death in North Carolina tuberculosis
patients and to determine risk factors for death, in particular deaths due to tuberculosis, in this population.
Design: This is a retrospective cohort study using data extracted from the North Carolina Tuberculosis Control Program from 1993-2003 linked to data about time and causes of death as recorded on death certificates through the United States National Death Index. Results: A total of 1,616 patients died over the study period, representing 30.1% of our cohort, with 540 (10.5%) of these deaths occurring during tuberculosis treatment. Risk factors for death were increasing age, male sex (OR 1.14 95% CI 1.02-.139), US
citizenship (OR 4.7 95% CI 2.6-8.5), known HN seropositivity (7.3 95% CI 5.8-9.4) or
unknown HN status (1.53 95% CI 1.30-1.81) and unknown alcohol status (OR 1.84 95% CI 1.52-2.24). Ten percent of deaths in our cohort were due directly to tuberculosis,
another 13% were due to HN and 22% were due to other pulmonary diseases. Excessive alcohol use was associated with an increased risk of death by TB (OR 1. 70, 95% CI 1.01-2.85) while male sex had a protective effect (OR 0.69 95% CI 0.49-0.98).
TEXT
INTRODUCTION
Despite being a curable disease, tuberculosis (TB) represents a substantial burden of illness worldwide, being directly responsible for 1.8 million deaths annually [I]. While, the TB incidence in the United States has continually decreased every year since
1993 [2], the case-fatality rate (CPR) of active tuberculosis in the US and other developed nations continues to remains unacceptably high; with some studies showing death rates up to 20%-28% [3-5]. Much of this high mortality rate is likely due to the age
distribution of the disease, with adults 65 years of age or older making up 20% of the
cases in the US and having the highest incidence of disease (7.7 per 100,000, compared to 4.6 per 100,000 in the population at large) [2, 6]. Nevertheless, evidence exists that there is increased all-cause mortality, as compared to the population at large, even in younger patients who complete treatment, with up to a 6-8 fold increase [7-9].
There are at least two possible explanations for this increased mortality; 1) patients with TB generally have poorer overall health, and their active infection is a consequence of this vulnerable health state or 2) the increased mortality is related
sequelae of active tuberculosis infection and represents long term damage accrued during infection. The latter could result in an increased propensity for other pulmonary diseases, such as bronchiectasis, COPD, or lung cancer. While some research has shown minimal
changes in pulmonary function over a short-term period following treatment [10], few studies have evaluated the long term consequences of TB infection.
Previous research on TB mortality has identified risk factors for in patients
alcohol use, previous TB treatment, and unemployment tend to be associated with an increased risk of death during or shortly after treatment (3-5, 9, 11, 12]. Work by Gadkowski, Nguyen, Stout and Hamilton further explored risk factors for dying
depending on when a person died relative to the start of treatment, and found that there were significant differences in age, underlying risk factors, and race (13]. In addition to age and HIV status, which were strong risk factors for death prior to, during and
following treatment, they demonstrated that being a US-born black (OR 1.35 95%CI 1.05-1.75), reporting alcohol use (OR 1.68 95% CI 1.05-1.75) and residing in a long-term care facility (OR 1.79 95% CI 1.63-1.97) were all risk factors for dying in the first 8 weeks of treatment.
A few retrospective studies have looked into the causes of mortality within the population and have found that there is an increase in deaths due to HIV and malignancy, particularly lung cancer, in patients diagnosed with TB (4, 7, 9]. Studies have also demonstrated that 25-75% of deaths during treatment period are due to causes other than tuberculosis [ 14-18] providing evidence of the poor health status of these patients. However, the longest follow-up in any of these studies is out to 2 years from the start of
treatment and therefore limit interpretation of the long-term consequences ofTB infection. To our knowledge, no long-term study of causes of mortality in tuberculosis patients has previously been done.
We hypothesize that the most common causes of death among patients with TB will vary depending on relative time of death, being more related to the TB illness if
a retrospective cohort study of all patients diagnosed with TB in North Carolina over a
STUDY POPULATION
The North Carolina Tuberculosis Control Program (NC TB Program) routinely collects data from all reported cases of TB in the state. Data derived from patients
diagnosed with active TB, either through positive cultures, clinical diagnosis, or during autopsy, are recorded on a standardized Report of Verified Case ofTB (RVCT) and submitted to the State TB Control Program. This information is then transmitted to the Center for Disease Control and Prevention (CDC) using the TB Information Management
System (TIMS). The RVCT registry contains information on each patient's
demographics, localization of disease, previous treatment, confirmation of diagnosis and epidemiologic and medical risk factors for TB at time of diagnosis. Specifics of the
initial TB treatment protocol are also included. Individuals who are diagnosed with TB at autopsy, or who died during TB treatment are also identified in the RVCT. In our study, we included all patients reported to the NC TB program from 1993-2003, representing a total of 5,311 total cases.
METHODS
The RVCT data were analyzed to identifY individuals who died prior to, or during TB therapy. In addition, we used the United States National Death Index (NDI) to
determine if individuals who were alive at the end ofTB treatment had died prior to December 31, 2004; we also used the NDI to confirm the deaths of patients who we
identified in our RVCT database, and to record the reported cause of death. The NDI is a
national mortality database that contains death certificate data from all fifty states, Puerto Rico, and the Virgin Islands and contains information about the time, location and
recorded cause of death. We were able to link subjects from the NDI to the RVCT database using subjects' Social Security number, full name, date of birth, race, gender and last known residence, as entered in the North Carolina TB Control Program's
database using specific link criteria (appendix B). NDI records that did not fulfill any of
the criteria were discarded as inaccurate or false matches. Any discrepancies in dates or status of patients between the two databases were resolved in favor of the NC TB Program's RVCT database.
The primary outcome of interest in this study is underlying causes of death. The NDI provided ICD9 or ICD1 0 underlying cause of death based on the information
recorded on the death certificate and using standardized CDC death tables. These results were subsequently recoded into the following categories based on the ICD code: TB (ICD9 010-1018, ICD10 A16-19), HIV/AIDS (ICD9 042-044, ICD10 B20-B24); lung
TB or HIV was recorded anywhere on the death certificate (other than as the underlying cause of death). The multiple causes of death data provided by NDI was reviewed for any ICD9/l 0 codes corresponding to HIV or TB using the ranges described above.
We grouped timing of death into three categories: those who died prior to
diagnosis, those who died during treatment and those who died after treatment. Patients
for whom a start date for treatment was not recorded were excluded from these analyses. Information on the primary localization of disease as provided by the RVCT was used to categorize patients as having pulmonary or extrapulmonary disease. Patients were
categorized as having pulmonary disease ifthe major site of infection, as recorded on RVCT, was indicated as pulmonary or pleural. If anything else was indicated as a major
site, they were classified as extrapulmonary.
Bivariate analyses were performed to examine differences in patient
characteristics amongst the various causes of death. Differences in proportions were evaluated using chi-square test or Fisher's exact test as appropriate. T-tests were used to evaluate continuous variables. Both all-cause and specific rates for each cause of death category were calculated by dividing the number of deaths by a specific cause by the total amount of years that the population was at risk. Logistic regression models were used to
RESULTS
All Cause Mortality
Between January 1993 and December 2003,5,311 cases ofTB were reported to
the North Carolina TB control program. Demographic characteristics of these patients
are shown in Table 1. The NDI reported 1,457 matches from January 1993 through
December 31,2004. The NC TB program reported an additional159 patients who were
reported as "dead" by county TB programs but were not captured by the NDI query.
Because we did not have any death certificate data, these patients were included in
all-cause mortality analysis, but not in the analysis on specific all-causes of death. The total
number of deceased individuals for our follow-up period was 1 ,616, representing 30.4%
of the total cohort. Of these, 181 died prior to diagnosis ofTB. Because these patients
died before contributing any person-time to our cohort, they were removed, resulting in a
crude mortality rate of 0.050 per person-year. A total of 540 subjects died during
treatment, with 305 dying in the first 8 weeks. An additional 895 deaths were recorded
for patients dying after the conclusion of treatment up until our censor date.
Analysis of risk factors for all cause mortality is shown in table 2. Risk factors
for death in the unadjusted analysis were increasing age, black race, positive or unknown
HIV status, unknown alcohol status, previous TB and pulmonary involvement.
Protective factors were Hispanic ethnicity, Asian/Pacific Islander and foreign birth.
Multivariate analysis results from a logistic regression model are shown in the second
column of table 2. In addition to increasing age, other risk factors for death in our cohort
were male sex (OR 1.19 95% CI 1.02-.139), US citizenship (OR 4. 7, 95% CI 2.6-8.5),
1.30-1.81) and unknown alcohol status (OR 1.84 95% CI 1.52-2.24), all significant at p<0.05. Additionally, excessive alcohol use had an adjusted odds ratio of 1.20 (95% CI 0.99- 1.46). Of note, in the multivariate analysis, race, ethnicity, previous TB diagnosis
and site of disease were not associated with all-cause mortality. The apparent beneficial effects of both ethnicity and foreign-birth seen in the unadjusted analysis reflects the very different epidemiology of those groups- most of the foreign-born individuals being young Hispanic immigrants - and once age was controlled for in the multivariate analysis, the benefit disappeared.
Cause Specific Deaths
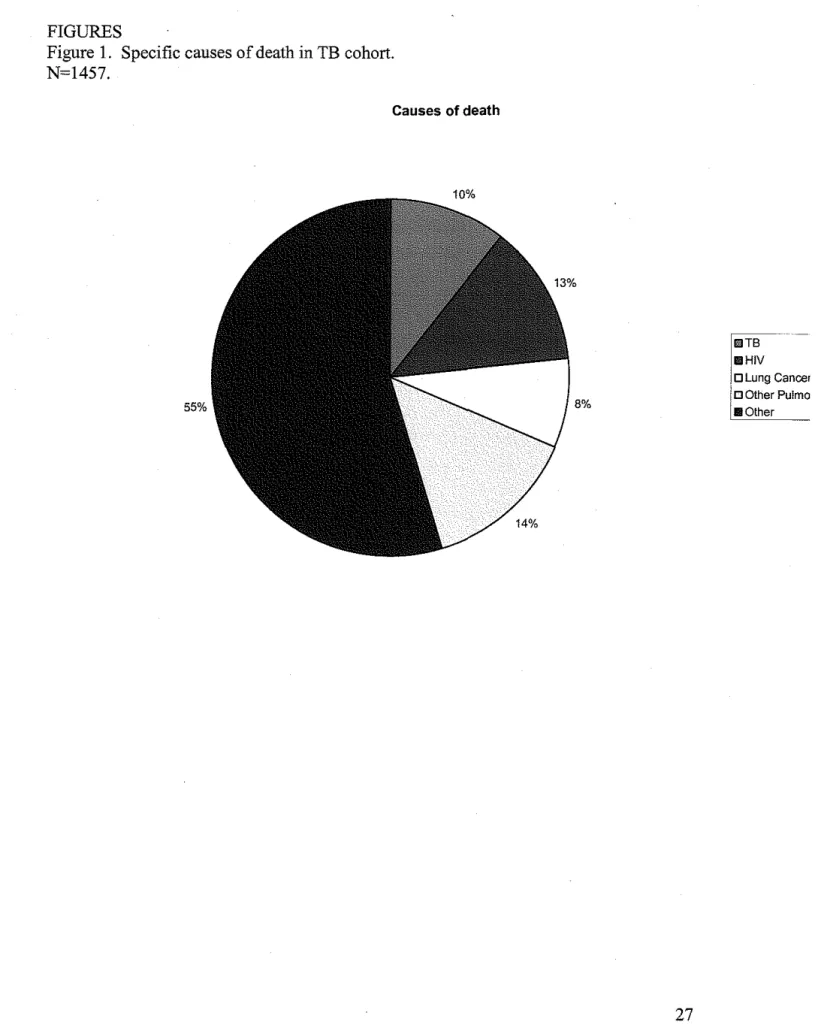
Out of the 1,457 deaths observed in our cohort, 1,305 were due to causes other than TB. A total of 188 deaths were attributed to HIV, 116 to lung cancer and 202 to
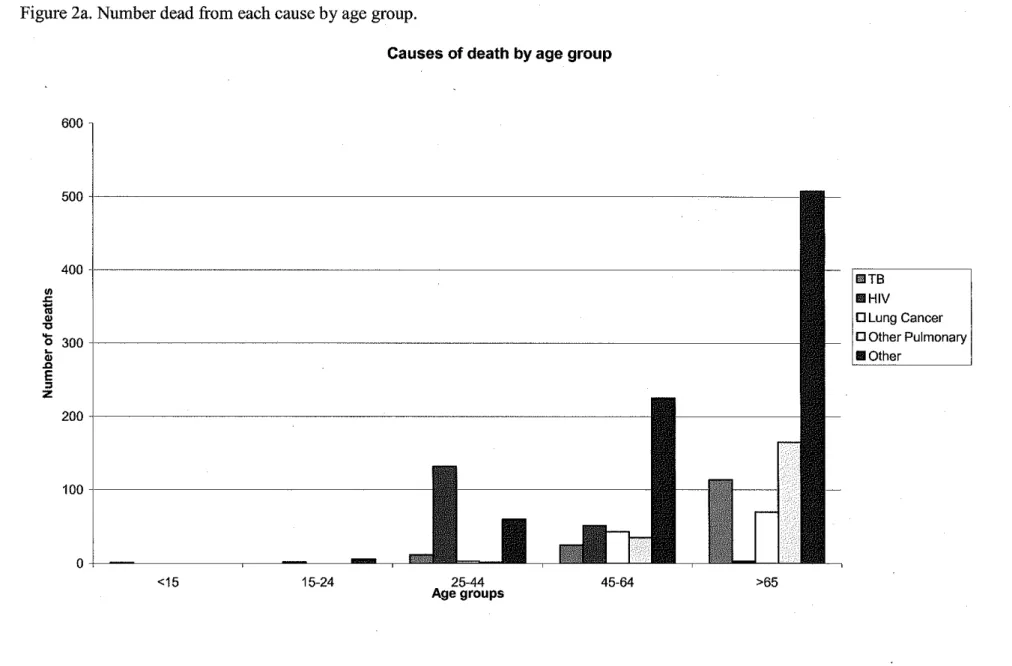
other pulmonary diseases (Figure I). The remaining 799 deaths were due to causes not obviously relevant to the diagnosis of TB. Figure 2 shows the number of deaths by each cause of interest, stratified by age group. Table 3 shows the demographic breakdown of each of the causes of death of interest while Table 4 displays the causes of death by relative time period and is described below. In general, deaths in those below the age of 25 were minimal, however, a substantial portion of those between 25 and 44 died, with HIV being the most common cause. In the older age groups, deaths were more likely due to tuberculosis or other pulmonary diseases.
The demographics of this population based on relative time of death have been described elsewhere [13]. Ofthe 181 deaths prior to diagnosis, 37 were not found in the
134 deaths that we did have cause of death information about, 20 (14.9%) had
tuberculosis recorded as an underlying cause of death, 16 (11.9%) had HN recorded, 10
(7.5%) had lung cancer, and 31 (23.1 %) died of other pulmonary disease. The remaining 42.5% died of other causes. The overall mean age of patients who died before diagnosis was 66.6 (range 24-1 04), however this varied substantially based on cause of death. Those who died ofHN were substantially younger (mean age 38) compared to a those who died of any other cause (mean age of69.3, p<O.OOl). Patients who died ofTB were also substantially older (mean age of71.6).
A total of540 deaths occurred during treatment, resulting in a case-fatality rate of 10.5% and representing 33.4% of all deaths observed. Of these, 121 (28.3%) were due
to tuberculosis, 46 (10.8%) were due to HN, 23 (5.4%) to lung cancer, 54 (12.6%) to non-TB/non-neoplastic pulmonary disease; the remaining 184 deaths were due to other causes. The 121 TB deaths represent almost all (91. 7%) of the total deaths due to TB. The mean age of those who died during treatment was 68.4.
The remaining 895 (55.4%) of deaths occurred after treatment. The overall raw mortality rate for those who died after treatment was 0.0316 per person-year (or 31.6 per
1000 person-years). Only 11 (1.23%) of these deaths were attributed to tuberculosis, 126 (14.1 %) were due to HN, 83 (9.3%) were to lung cancer, and 117 (13.1 %) to other
pulmonary disease. Incidence rates per 100,000 person-years were 38.9, 445.1, 293.2, and 413.4 respectively. The median follow-up for all subjects who survived treatment
TB Specific deaths
A total of 152 patients in our cohort had tuberculosis recorded as their underlying
cause of death, representing 3.0% of our total cohort and 10.4% of the total deaths. An additional 165 patients had tuberculosis reported elsewhere on the "multiple cause of death" lines of the death certificate, but was not deemed to be the underlying cause of death. Results from the logistic regression model of risk factors for TB as an underlying cause of death are shown in Table 5. Age was by far the greatest risk factor for death by TB, with those over the age of 65 having an adjusted-odds ratio of 30.7 compared to
those under 25. Excessive alcohol use was associated with an increased risk of death by TB (OR 1.70, 95% CI 1.01-2.85) while male sex had a protective effect (OR 0.69 95% CI
0.49-0.98). Blacks had a trend towards having an increased risk of death (OR 1.4, p=0.07), but otherwise race was not predictive of death by TB. Similarly, HN status, ethnicity, country of origin, and site of disease were not associated with death by TB.
Bivariate analysis comparing those who died ofTB to those who died of other causes is shown in Table 5. Results of the multivariate analysis are shown in Table 6. In the adjusted model, only black race was predictive of a higher likelihood of death by TB compared to other causes (OR 1.57 95% CI 1.07-2.30). Again, males were less likely than females to die ofTB compared to other causes (OR 0.64 95% CI 0.44-0.91).
Increasing age was not associated with either an increased or decreased risk of death by TB. The odds ratio for positive HN status was 0.15 (95% CI 00.5-0.42); however this
DISCUSSION
This paper explored the causes of death in patients reported to the North Carolina Tuberculosis control program from 1993 through 2003. Over the follow-up period, almost a third (30.4%) of our cohort died. While one would expect a fairly high mortality rate in the over 65 population in a study with up to 12 years follow-up, the close to 60% fatality rate is still striking. The 25% mortality rate in the 45-64 age group and 14% in the 25-44 age groups, groups which are not expected to have significant competing
causes of death in a normal population, indicate that despite the availability of treatment the immediate and long-term effects of tuberculosis are still substantial. During
treatment, the case fatality rate in our study was I 0.5%, very similar to the rate observed
in other recent studies in Russia and the United Kingdom (9.6%-11 %) [14, 15]. Tuberculosis was recorded as the underlying cause of death in 28.3% of these cases which was very close to that seen in these previous papers. The great majority of TB
deaths occurred prior to or during treatment, with only 11 total occurring after treatment. The gender distributions in this study were also interesting. While the higher likelihood of all-cause mortality in males might be expected, the increased mortality in females due to TB is unexpected. Men have a higher mortality rate in this population due to many competing potential causes of death; however, the increased propensity for TB death in women is not easily explained. Worldwide, the rate of TB disease in men is
have other nutritional, medical or social characteristics not captured in standard TB surveillance data. [19].
One of the major goals of this study was to characterize the causes of death in patients with tuberculosis to determine whether TB patients had a higher propensity for other disease, puhnonary disease in particular. Previous studies had shown a somewhat
increased risk of death due to lung cancer [7, 9], though no long term study exploring this has been done. In our study, we found that almost a quarter of deaths observed were attributed to non-tuberculosis pulmonary disease and one third of those were due to lung cancer.
The lack of information regarding the smoking status of our cohort makes
interpretation of any increased incidence of pulmonary disease difficult. Tobacco use is a well-known risk factor for most pulmonary diseases and therefore represents a significant
covariate that we were unable to adjust for. Smoking could account for a significant portion of the puhnonary disease present; however, the exact smoking rate of our cohort
is unknown. A recent meta-analysis demonstrated that smoking clearly increases the risk ofTB infection (RR 1.7) as well as the development ofTB disease (RR 2.3-2.7) [20]. The relationship between smoking, TB and mortality needs to be further explored.
Unfortunately, because smoking status is not routinely collected on reported TB cases we were unable to take this into consideration. Future versions of the RVCT may want to include such information to help out future analyses.
Since the earliest stages of the epidemic, HIV has been known to be a potent risk
factor for reactivation ofTB. HIV -infected individuals have a 10% per year risk of
developing active tuberculosis, compared to the 10% lifetime risk of those not infected
with HIV. A number of reports have also demonstrated that the progression ofTB and
subsequent mortality can be very rapid [ 1, 21]. In developing countries, tuberculosis
incident rates are strongly associated with a country's HIV burden, with approximately
30% ofTB cases in Africa being in HIV-infected individuals [1]. In the nations hardest
hit by the HIV epidemic, up to 50% of the morbidity and mortality associated with TB is
in HIV positive individuals. Even if treated successfully for TB, HIV positive patients
have a 3.7-fold increased risk of developing recurrent TB[22]. In our study, HIV positive
patients were at a much higher risk of dying than those who were HIV negative (OR 7.3)
and the majority (81 %) dying of their HIV. Because HIV tends to be a disease ofthe
younger age groups, it was the primary reason for the increased overall mortality rate in
the 25 to 44 group in our cohort.
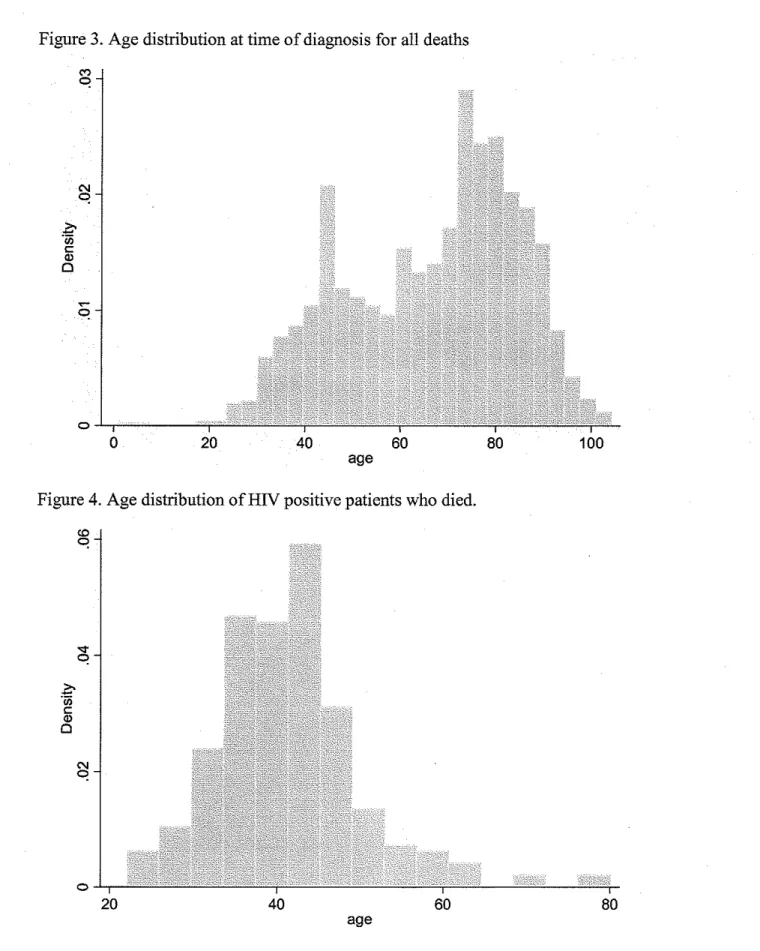
People who died in our cohort tended to belong to one of two demographic
groups- either the elderly or the HIV positive. Figures 3 through 5 show the distribution
of age at diagnosis for all people who subsequently died, those who died who were HIV
positive, and those who died who were HIV negative, respectively. The overall age
distribution has a clear bimodal distribution which is almost completely described by
HIV status. This represents two separate "epidemics" which need to be addressed in
different ways.
This study has several limitations. First, the use of death certificate data, while widely used, ~is not a perfect source of cause-of-death data. Some studies have found that up to 60% of death certificates are filled in incorrectly [23] and studies relating death
certificates to autopsy rates have shown relatively poor correlations [24]. A study from New York City in the 1990's looking specifically at tuberculosis using death certificates, medical records and the state TB registry found that while almost all patients who died of TB had been included in the state registry, death certificates often did not mention TB in patients known to have the disease [25]. Nevertheless, death certificate data remains the primary source for reporting national and state mortality statistic and allows for efficient comparisons of populations level data.
A second limitation of this study is the unknown HN status of much of our
population, particularly in the earlier cohort diagnosed with TB prior to 1999 when as much as 40% of our TB patients had unknown HIV status. With HN being a strong predictor of tuberculosis mortality and upwards near 40% of our population of unknown status, this lack of information could have a significant impact on our findings. Those
with unknown HN status in our population tended to be older, possibly reflecting a lower perceived risk by either the patient or treating physician and therefore more likely to refuse or not be offered testing. While this is a legitimate concern, it is reassuring that only one subject of"unknown" HN status during TB treatment had HN listed as a cause of death on the death certificate. Based on this finding, I feel comfortable in asserting
that undiagnosed HN infection likely did not have a major effect on our results.
the mortality due to HIV. Because of this, I would expect very different outcomes in those HIV positive persons who developed TB earlier in our cohort compared to those
who developed it later.
Implications
This paper demonstrates that the mortality associated with TB is still substantial, even in a developed country with a strong public health system. While much of the death that occurred in this study was in elderly persons who may have been in poor health to begin with, the high case-fatality rate argues that more needs to be done to decrease TB
mortality, even in the United States.
More research also needs to be done evaluating the long-term consequences ofTB
infection. This study has added to the literature demonstrating a potential increase in deaths due to pulmonary disease in patients who were successfully treated for TB. While it is unclear whether the increased risk of pulmonary-related deaths was due to the infection in the past or if previous pulmonary disease put them at risk for developing
active TB, the interplay between more chronic pulmonary disease and TB is of great importance. With 8.3 million new TB cases occurring yearly [1), the global implications of the associated long-term damage are vast and would greatly expand the burden of
CONCLUSIONS
This study examined mortality in a cohort of tuberculosis patients reported to the North Carolina Tuberculosis Control Program from 1993 through 2003. We demonstrated that two different sub-groups of tuberculosis patients were at very high risk for death- the
elderly and the HIV positive. Those older than 65 years of age were much more likely to have tuberculosis recorded as the primary cause of death, and most of these deaths occurred soon after beginning treatment. Additionally, while men had an increased risk of mortality in this cohort, women appear to be at an increased risk of death due to tuberculosis. Even in a developed country with a very strong public health system, tuberculosis continues to have a very high case-fatality rate, with almost half of these
deaths resulting from TB, HIV or puhnonary diseases.
TABLES
Table 1. Characteristics of patients reported to state TB program (1993-2003)
N=5 311 '
Age at diagnosis
<25 551 (10.4%)
25-44 1614 (30.4%)
45-64 1522 (28.7%)
>65 1624 (30.6%)
Sex
Male 3477 (65.5%)
Female 1834 (34.5%)
Race
Black 3084 (58.1%)
White 1872 (35.3%)
Asian/Pacific Islander 308 (5.8%) American Indian/Alaskan Native 44 (0.8%) Ethnicity
Hispanic 559 (10.5%)
Other 4752 (89.5%)
Citizenship
US Citizen 4348 (81.9%)
Foreign born 959 (18.1%)
HIV
Negative 2650 (49.9%)
Positive 549 (10.3%)
Unknown 2112 (39.8 %)
Excess Alcohol Use
No 3411 (64.2%)
Yes 1147 (21.6%)
Unknown 753 (14.2%)
Previous TB 296 (5.6%)
Table 2 Multivariate analysis for all cause mortality
Unadjusted OR Adjusted* OR (95% CI) (95% CI)
Age at diagnosis
<25 1 I
25-44 7.6 (4.2- 13.7) 3.6 (2.0-6.7) 45-64 16.7 (9.2- 30.0) 9.7 (5.4-17.7) >65 64.6 (36.2-115.5) 41.0 (22.7-74.0)
Female 1 1
Male 1.11 (.98- 1.3) 1.19 (1.02-1.39) Race
White 1 1
Black 1.14 (1.00- 1.29) 0.91 (0.78 -1.06) Asian 0.15 (0.95- 0.25) 0.99 (0.47- 2.12) American Indian 1. 76 (0.96- 3.23) 1.41 (0.71- 2.79) Etbnicity
Otber 1 1
Hispanic 0.01 (0.07- 0.14) 0.76 (0.41-1.40) Citizenship
Foreign born 1 1
US Citizen 12.7 (9.2 -17.5) 4. 7 (2.6 -8.5) HIV
Negative 1 1
Positive 3.9 (3.2-4.7) 7.3 (5.8- 9.4) Unknown 3.5 (3.1-4.0) 1.53 (1.30 -1.81) Alcohol Use
No 1 1
Yes 0.95 {0.82-1.1 0) 1.20 (0.99 - 1.46) Unknown 2.16 (1.84-2.54) 1.84 (1.52- 2.24) Previous TB
No 1 1
Yes 1.45 (1.13-1.84) 1.27 (0.96- 1.69) Site of infection
Pulmonary TB 1 1
Table 3. Patient characteristics of different underlying causes of death.
TB (n=l52) HN (n=188) Lung Other All Other Cancer Puhnonary (n=799) (n=116) (n=202)
Age at diagnosis
Mean age 71.5 41.2 66.9 74.5 69.2
<25 I (0.2%) 2 (0.4%) 0 0 6 (1.1 %)
25-44 12 (0.8%) 132 (8.3%) 3 (0.2%) 2 (0.1%) 60 (3.8%) 45-64 25 (1.7%) 51 (3.4%) 43 (2.9%) 35 (2.4%) 225 (15.1%) >65 114 (7.5%) 3 (0.2%) 70 (4.6%) 165 (10.8%) 608 (33.3%) Sex
Female 69 (3.9%) 39 (2.2%) 15 (0.8%) 59 (3.3%) 291 (16.4%) Male 83 (2.5%) 149 (4.4%) 101 (3.0%) 143(4.2%) 508 (15.1%) Race
Black 102 (3.4%) 166 (5.6%) 64 (2.2%) 78 (2.6%) 500 (16.8%) White 47 (2.6%) 21 (1.2%) 52 (2.9%) 119 (6.5%) 277 (15.2%)
Asian 2 (0.7%) 0 0 I (0.3%) 13(4.3%)
American Indian I (2.5%) I (2.5%) 0 4 (2.0%) 9 (22.5%) Ethnicity
Other !50 (3.3%) 185 (4.0%) 116 (2.5%) 202 (4.4%) 791 (17.2%)
Hispanic 2 (0.4%) 3 (0.6%) 0 0 8 (1.5%)
Citizenship
US Citizen 149 (3.5%) 183 (4.4%) 116 (2.8%) 201 (4.8%) 783 (18.6%) Foreign-born 3 (0.3%) 5 (0.5%) 0 I (0.1 %) 15 (1.6%) HN
Negative 48 (1.8%) I (0.04%) 41 (1.6%) 59 (2.3%) 276 (10.6%) Positive 5 (1.0%) 185 (35.0%) 0 2 (0.4%) 37 (7.0%) Unknown 99 (4.9%) 2 (0.1%) 75 (3.7%) 141 (7.0%) 486 (24.1 %) Alcohol
No 102 (3.1%) 73 (2.2%) 64 (1.9%) 145 (4.4%) 486 (14.6%) Yes 27 (2.4%) 76 (6.8%) 25 (2.2%) 20 (1.8%) 140 (12.5%) Unknown 23 (3.3%) 39 (5.5%) 27 (3.8%) 37 (5.2%) 173 (24.5%) Previous TB
No 139 (2.9%) 178 (3.7%) 106 (2.2%) 188 (3.9%) 740 (15.2%) Yes 13 (4.6%) 9 (3.2%) 10 (3.5%) 13 (4.6%) 58(20.3%) Site of infection
Table 4. Causes of death by relative time of death
All TB HIV Lung Other All Other
cause Cancer Pulmonary
Before 134 20 (14.9%) 16 (11.9%) 10 (7.5%) 31 (23.1 %) 57 (42.5%) Treatment
During 428 121 (28.3%) 46 (10.8%) 23 (5.4%) 54 (12.6%) 184 (43.0%) Treatment
After treatment 895 11 (1.2%) 126 (14.1 %) 83 (9.3%) 117 (13.1 %) 558 (62.4%)
Table 5 Multivariate analysis ofTB deaths
Unadjusted OR Adjusted* OR Age at diagnosis
<25 1 1
25-44 4.12 (0.53-31.8) 3.96 (0.50-31.61) 45-64 9.38 (1.24- 67.9) 6.96 (0.91- 52.94) >65 41.76 (5.78- 298.0) 30.7 ( 4.20 - 224.9) Sex
Female 1 1
Male 0.63 (0.45-0.87) 0.69 (0.49- 0.98) Race
White 1 1
Black 1.32 (0.94- 1.89) 1.40 (0.97- 2.02) Asian 0.25 (0.06-1.05) 2.62 (0.23 - 30.00) American Indian 0.90 (0.13 - 6. 70) 0.74 (0.10- 5.60) Ethnicity
Other 1 1
Hispanic 0.11 (0.03 - 0.45) 1.63 (0.29- 9.25) Citizenship
Foreign born 1 1
US Citizen 11.31 (3.60- 35.54) 6.38 (0.76- 53.76)
HIV
Negative 1 1
Positive 0.50 (0.20- 1.26) 0.75 (0.29- 1.99) Unknown 2.67 (1.88- 3.78) 1.27 (0.85- 1.90) Alcohol Use
No 1 1
Yes 0. 78 (0.51-1.20) 1.70 (1.01- 2.85) Unknown 1.02 (0.65-1.62) 0.92 (0.57- 1.47) Previous TB
No 1 1
Yes 1.61 (0.90-2.88) 1.46 (0.80- 2.65) Site of infection
Extrapulmonary 1 1
Table 6 Bivariate analysis ofTB deaths versus all other deaths§ TB death (n=l52) Other death
(n=l305) Age at diagnosis
<25 1 (11.1%) 8 (88.9%)
25-44 12 (5.7%) 197 (94.3%)
45-64 25 (6.6%) 354 (93.4%)
>65 114 (13.3%)* 746 (86.7%)
Sex
Male 83 (8.4%) 901 (91.6%)
Female 69 (14.6%)* 404 (85.4%)
Race
Black 102 (11.2%) 808 (88.8%)
White 47 (9.1%) 463 (90.9%)
Asian 2 (12.5%) 14 (87.5%)
American Indian 1 (6.7%) 14 (93.3%) Ethnicity
Hispanic 2 (15.4%) 11 (84.6%)
Other 150 (10.4%) 1294 (89.6%)
Citizenship 149 (10.4%) 1283 (89.6%) US Citizen 3 (12.5%) 21 (87.5%) Foreign born
HN
Negative 48 (11.3%) 377 (88.7%)
Positive 5 (2.2%)* 224 (97.8%)
Unknown 99 (12.3%) 704 (87.7%)
Alcohol Use
No 102 (11.7%) 768 (88.3%)
Yes 27 (9.4%) 261 (90.6%)
Unknown 23 (7.7%) 276 (92.3%)
Previous TB
Yes 13 (12.6%) 90 (87.4%)
No 139 (10.3%) 1212 (89.7%)
Site of Infection 133 (10.4%) 1143 (89.6%) Pulmonary TB 19 (10.5%) 162 (89.5%) Extrapuhnonary
Table 7. Multivariate analysis ofTB death compared to death from other causes.
Unadjusted OR Adjusted* OR Age at diagnosis
<25 1 1
25-44 0.49 (0.06-4.22) 0.88 (0.09- 8.70) 45-64 0.56 (0.07-4.70) 0.46 (0.05 - 4.23) >65 1.22 (0.15-9.87) 0.93 (0.11 - 8.30) Sex
Female 1 1
Male 0.54 (0.38-0.76) 0.64 (0.44- 0.91) Race
White 1 1
Black 1.26 (0.88-1.81) 1.57 (1.07- 2.30) Asian 1.43 (0.31-6.46) 0. 72 (0.42- 12.2) American Indian 0.71 (0.09-5.54) 0.88 (0.11 - 7 .03) Ethnicity
Other 1 1
Hispanic 1.57 (0.34-7.14) 1.76 (0.24- 12.69) Citizenship
Foreign born 1 1
us
0.81 (0.24-2.76) 0.42 (0.33 - 5.19)HN
Negative 1 1
Positive 0.18 (0.07-0.45) 0.15 (0.05- 0.42) Unknown 1.10 (0.77-1.59) 1.04 (0.68- 1.58) Alcohol Use
No 1 1
Yes 0.78 (0.50-1.22) 1.48 (0.85 - 2.57) Unknown 0.63 (0.39-1.00) 0.74 (0.46 -1.21) Previous TB
No 1 1
Yes 1.26 (0.69-2.31) 1.29 (0.69- 2.40) Site of infection
Extrapulmonary 1 1
FIGURES
Figure 1. Specific causes of death in TB cohort. N=l457.
Causes of death
55%
IIITB
IIHIV
D Lung Cancer
i 0 Other Pu!mo
Figure 2. Number dead from each cause of death, stratified by age group
Deaths by age group
1000
900
800
700
Cl)
000
I
_
.c
~
II Other1ii
"
0 Other Pulmonary.,
~500 0 Lung Cancer
0
~
Cl>
Ill HIV
J:l
E IITB
"
400z
300
200
100
0
<15 15-24 25-44 45-64 >65
Figure 2a. Number dead from each cause by age group.
Causes of death by age group
600
5 0 0 i l
-400
"'
.<::
1;1
Cl>
,
'0 300 ~
Cl> .c
E
"
z
200
100 il---1
o+---~---~--~_Bm5
<15 15-24 25-44
Age groups 45-64
I
II!ITB Ill HIVD Lung Cancer
D Other Pulmonary II Other
Figure 3. Age distribution at time of diagnosis for all deaths
0 20 40 60
age
Figure 4. Age distribution ofHIV positive patients who died.
~
!I)
c
Q)
0
20 40 60
age
80 100
Figure 5. Age distribution ofHIV negative patients who died.
0 20 40 60 80 100
APPENDIX A.
Historical Perspective on TB mortality
Tuberculosis is an ancient disease that has been a major source of mortality and morbidity to humans since it first appeared in the historical record around 1 000 BCE [26]. The leading theory on the origins of Mycobacterium tuberculosis states that it initially evolved from Mycobacterium bovis, a disease in cows that infected
milk-drinking Indo-European nomads. As is the case with many emerging infectious diseases, war and volatile social environments provide an ideal situation for a disease to take root,
and conflicts between these tribes and other societies provided such an environment. By the end ofthe first millennium BCE, TB had spread throughout the world. While theories of the infectious nature ofTB had existed for centuries, it was not until1882 that Koch
discovered the tuberculosis bacilli that definitive evidence was available. By then, TB had been well-established as a devastating cause of death and disability worldwide.
While the actually historical case-fatality rates due to TB is difficult to estimate,
studies from the 1960's showed that untreated smear-positive tuberculosis has a 25% mortality rate after 1.5 years and approximately 50% mortality after 5 years[27]. Additionally, these studies demonstrate that close to a third of patients with active TB will spontaneously clear their infections without intervention. Some evidence from the
sanatorium movement, which became the preferred method of treatment from the mid-1800's to the mid-1900's, showed that it may have been somewhat effective in
century, tuberculosis killed as many people in the U.S. as pneumonia and influenza
combined, with a mortality rate of approximately 200 per 100,000 [29], Following the discovery of the first effective anti-tuberculosis drug,
streptomycin, in the 1940's, case-fatality rates for those receiving treatment dropped substantially as did the overall incidence ofTB in the developed world[29]. Over the next several decades, multiple other drugs and treatment protocols were developed which were effective in lowering the case-fatality rate even lower. Personalized treatment regimens based on susceptibility testing can now decrease mortality to an an estimated 5-15% for HIV negative patients [27, 30]. Worldwide, the current case fatality rate for TB varies greatly depending on region, from 14% in Europe to 34% in Africa; HN
prevalence also plays a role in CFR, particularly in Africa where 32% of patients with TB are also HN positive.[30].
In the early 1990's, the World Health Organization began advocating the use of
DOTS (Directly Observed Therapy- Short Course), a comprehensive strategy that focuses on case detection of smear positive patients and directly observed treatment using
standardized multi-drug treatment. The United Nations has addressed tuberculosis in the organization's Millenium Development Goals (MDG 6, target 8) pledging to have "halted by 2015 and begun to reverse the incidence ofTB. The Stop TB Partnership of the WHO has further defined these goals and set out to halve the prevalence and death rate of TB by 2015 and ensure that 70% of those infected with TB are in DOTS programs, with an ultimate goal of eliminating TB as a public health problem worldwide by 2050.
In 2006, there were 13,767 reported cases ofTB in the United States (4.6 per 100,000), representing a 3.2% decrease from 2005 and the lowest rate since the recording ofTB data began in 1953 [2]. However, the rate of decline has decreased over the past seven years, from an average of 7.3% per year in the 1990's, and is currently behind the CDC's goals for elimination ofTB as a public health problem by 2010. While TB is no longer a generalized epidemic in the US, it instead exists in pockets ofthe population that are at a substantially increased risk.
Foreign-born persons have made up a majority ofTB cases for the sixth
consecutive year, having an incident rate 9.5 times higher than that of US persons. While increased immigration rates explain in part why the number of cases in foreign-born persons has been remained effectively unchanged since the early 1990's, minimal
progress has been made in closing the gap. Racial and ethnic minorities are also at a significantly increased risk of developing TB relative to whites, particular blacks (OR 8.4), Asians (OR 21.2) and Hispanics (OR 7.6),. The CDC recognizes that this is a major
impediment to TB control, stating that "the slowing of the decline in the overall national TB rate and the inability to effectively address persistent disparities in TB rates between U.S.-born and foreign-born persons and between whites and racial/ethnic minority
other established risk factors normally associated with TB, including HN, alcohol or
drug use, or homelessness[31].
In the United States, the risk of developing TB increases with age with 20% of cases occurring in those over the age of 65 and 50% occurring in those over the age of 45[6]. TB is also predominately a disease of men, whose infectionntes are
approximately double that of females. The 2006 data for the United States showed that 12.4% ofTB cases were in persons who were also infected with HN, representing a
4.4% decline from 2005. However, just under one third (31.8%) of reported TB cases have an unknown HN status, therefore the decline may be due to under-reporting or lack of testing.
Causes of death in TB patients. Systematic Review.
In order to determine if other studies had examined the long term causes of death
in patients diagnosed with TB, I performed a systematic review to identify primary research articles that examined this very issue. Using the MESH search terms
"Tuberculosis" and "Mortality" or "Cause of death" generated 4,293 matches. Despite
my efforts, I was unable to narrow this search while maintaining the sensitivity necessary to find articles of interest. Reading titles I was able to identify 446 articles that appeared to focus on mortality during or following TB treatment and potentially would describe
causes of death and obtained their abstracts. I also read references of relevant papers in order to identify other potential articles. From these abstracts I identified only seven
Mathew et a! [ 15] performed a retrospective analysis of Russian data looking at causes of death during tuberculosis treatment. Similar to our study, the authors used death certificate data to determine the underlying cause of death, referring to medical records when the death certificate data was unclear. Overall they found a 9.6% mortality rate during treatment with 25% of these deaths not being attributed to TB. Those who died directly due to TB were significantly more likely to die early in treatment, with 21%
dying in the first week. Standardized mortality ratios were calculated for deaths other than TB in 4 categories (cancer, vascular disease, external causes, and other) using national death rates for the year 2000, stratified by 5-year age and sex categories. While the power for this analysis was low (only 23 deaths were not due to TB) an increased
incidence of vascular disease (SMR 1.75, 95% CI 1.45-2.09) and "all other causes"-anything but vascular disease, cancer, or external causes - (SMR 11. 79, 95% CI 10.85-12.79) was found.
A retrospective study of 439 TB cases Liverpool from 1989-1996 found a total of
104 deaths leading to a standardized mortality rate (SMR) 11-fold higher than the general population despite adequate treatment [7]. Review of these patient's death certificates found that significant differences based on the age of the patients. While a majority of
the patients over the age of 7 5 died of TB or bronchopneumonia; for those under the age of 75 lung cancer was a significant cause of death in this population with a crude death rate up to 30 times higher than that of the general Liverpool population. The authors did not report the smoking rates of their cohort, but do imply that a majority were smokers.
11% with 57% of the deaths were "TB-related", though no further information about the actual cause of death was collected. Another case-control study of 1083 reported TB cases looked at risk factors for dying from tuberculosis during the treatment period [16]. Of the 127 who died prior to treatment completion, TB was determined to be the primary cause of death in 53 and a contributing factor in another 34 deaths. Risk factors for death
by TB included increasing age as well as co-existing malnutrition, renal disease, and liver disease. Of the unrelated deaths 16 were attributed to cardio-pulmonary diseases, 20 to disease of other organs, 8 due to malignancy and I to AIDS.
Sterling et a! reported the causes of death in patients who took part in a large tuberculosis therapy trial [9]. This clinical trial randomized patients to receive one of two different medication regimens for the last 4 months of treatment and followed them for 24 months. No difference between these groups was observed in this analysis. Of the
1075 patients enrolled in the study, 71 died over the follow-up period. This mortality rate of those enrolled was significantly higher than that of the general population, despite the
fact that these patients tended to be of free of other comorbidities and received very controlled treatments. Malignancy was the most common cause of death, being responsible for a total of 14 deaths in the cohort. Alcohol-related deaths were also
significant. While the detail provided in this study was good, as a clinical trial, it is less relevant to typical TB infection and treatment.
greater than 3 causes listed, though a more in depth review of causes was not provided. Finally, another older study [ 18] examined the cause of death all patients who died with active TB in San Antonio Chest Hospital from 1979-1983 finding half of deaths being directly due to TB and half"unrelated", though the findings of this study have less
external validity as the population- those who were admitted to a specialized hospital for
TB- would not be very representative ofthe typical TB patient.
Overall, tuberculosis seems to be directly responsible for somewhere between 25%-75% of deaths that occur during treatment in these studies. What is most surprising about these findings is the high proportion of deaths from unrelated causes that occur in these patients. This appears indicative of the generally poor health status of developed world TB patients. Their tuberculosis results from re-activation oflatent disease due to
their failing immune systems in the setting of their increased age and co-morbidities. While the evidence is far from compelling, TB patients may appear to be at some
increased risk for malignancy, however, not many studies evaluated this and co-variates, such as smoking, were not addressed.
This review also demonstrates the major lack of studies providing long-term follow up of patients diagnosed with tuberculosis. Only two of these studies provided
APPENDIX BLink criteria applied to the results of the NDI query to distinguish correctly linked NDVRVCT records from false or inaccurate links.
If the patient's SSN is available:
1) SSN, first name, last name, middle initial, DOB, gender, race and state of residency
2) first name, last name, middle initial, DOB, gender, race and SSN with either one incorrect digit or 2 consecutive incorrect digits
3) SSN, DOB, gender and race
4) SSN, first name, last name, day and/or month of birth and year of birth+/- 3 years 5) SSN, last name, day of birth, month of birth and year of birth +/-1 0 years.
If the SSN was not available and the subject's last name was not among the two hundred fifty most frequent U.S. last names/ then the following criteria were used: 1) first name, last name, middle initial, DOB, state of residence and gender
2) first name, last name, middle initial, DOB, gender and race
3) first name, last name, DOB, gender, and race
4) first initial, middle initial, last name, DOB and state of residence
5) first name, New York State Identification and Intelligence System (NYSIIS)-coded last name, DOB, state of residence, gender and race
REFERENCES
[1] Corbett EL, Watt CJ, Walker N, Maher D, Williams BG, Raviglione MC, eta!. The growing burden of tuberculosis: global trends and interactions with the HIV epidemic. Arch Intern Med. 2003 May 12;163(9):1009-21.
[2] CDC. Trends in tuberculosis incidence--United States, 2006. Mmwr. 2007 Mar 23;56(11):245-50.
[3] Fielder JF, Chaulk CP, Dalvi M, Gachuhi R, Comstock GW, Sterling TR: A high tuberculosis case-fatality rate in a setting of effective tuberculosis control: implications for acceptable treatment success rates. Int J Tuberc Lung Dis. 2002 Dec;6(12):1114-7. [4] BorgdorffMW, Veen J, Kalisvaart NA, Nagelkerke N. Mortality among tuberculosis patients in The Netherlands in the period 1993-1995. Eur Respir J. 1998 Apr;l1(4):816-20.
[5] Oursler KK, Moore RD, Bishai WR, Harrington SM, Pope DS, Chaisson RE. Survival of patients with pulmonary tuberculosis: clinical and molecular epidemiologic factors. Clin Infect Dis. 2002 Mar 15;34(6):752-9.
[6] CDC. Reported Tuberculosis in the United States, 2005. Atlanta, GA: U.S. Department of Health and Human Services, CDC; 2006 September 2006.
[7] Tocque K, Convrey RP, Bellis MA, Beeching NJ, Davies PD. Elevated mortality following diagnosis with a treatable disease: tuberculosis. Int J Tuberc Lung Dis. 2005 Jul;9(7):797-802.
[8] Kolappan C, Subramani R, Karunakaran K, Narayanan PR. Mortality of
tuberculosis patients in Chennai, India. Bull World Health Organ. 2006 Jul;84(7):555-60. [9] Sterling TR, Zhao Z, Khan A, Chaisson RE, Schluger N, Mangura B, et a!.
Mortality in a large tuberculosis treatment trial: modifiable and non-modifiable risk factors. Int J Tuberc Lung Dis. 2006 May;l0(5):542-9.
[10] Long R, Maycher B, Dhar A, Manfreda J, Hershfield E, Anthonisen N. Pulmonary tuberculosis treated with directly observed therapy: serial changes in lung structure and function. Chest. 1998 Apr;113(4):933-43.
[11] Bustamante-Montes LP, Escobar-Mesa A, Bmja-Aburto VH, Gomez-Munoz A, Becerra-Posada F. Predictors of death from pulmonary tuberculosis: the case of Veracruz, Mexico. Int J Tuberc Lung Dis. 2000 Mar;4(3):208-15.
[12] Garcia-Garcia Mde L, Ponce-De-Leon A, Garcia-Sancho MC, Ferreyra-Reyes L, Palacios-Martinez M, Fuentes J, eta!. Tuberculosis-related deaths within a
well-functioning DOTS control program. Em erg Infect Dis. 2002 Nov;8(11 ): 1327-33. [13] Gadkowski LB, Nguyen LT, Stout JE, Hamilton CD. Tuberculosis-Associated Mortality in North Carolina: A Retrospective Cohort Study, 1993-2003. American Thoracic Society International Conference. San Francisco, CA 2007.
[14] Anyama N, Bracebridge S, Black C, Niggebrugge A, Griffin SJ. What happens to people diagnosed with tuberculosis? A population-based cohort. Epidemiol Infect. 2007 Feb 9:1-8.
[16] Walpola HC, Siskind V, Patel AM, Konstantinos A, Derhy P. Tuberculosis-related deaths in Queensland, Australia, 1989-1998: characteristics and risk factors. Int J Tuberc Lung Dis. 2003 Aug;7(8):742-50.
[17] White MC, Portillo CJ. Tuberculosis mortality associated with AIDS and drug or alcohol abuse: analysis of multiple cause-of-death data. Public Health. 1996
May; 110(3):185-9.
[18] Davis CE, Jr., Carpenter JL, McAllister CK, Matthews J, Bush BA, Ognibene AJ. Tuberculosis. Cause of death in antibiotic era. Chest. 1985 Nov;88(5):726-9.
[19] Holmes CB, Hausler H, Nunn P. A review of sex differences in the epidemiology of tuberculosis. Int J Tuberc Lung Dis. 1998 Feb;2(2):96-104.
[20] Bates MN, Khalakdina A, Pai M, Chang L, Lessa F, Smith KR. Risk of tuberculosis from exposure to tobacco smoke: a systematic review and meta-analysis. Arch Intern Med. 2007 Feb 26; 167( 4):335-42.
[21] Bucher HC, Griffith LE, Guyatt GH, Sudre P, NaefM, Sendi P, eta!. Isoniazid prophylaxis for tuberculosis in HIV infection: a meta-analysis of randomized controlled trials. AIDS (London, England). 1999 Mar 11;13(4):501-7.
[22] Mallory KF, Churchyard GJ, Kleinschmidt I, De Cock KM, Corbett EL. The impact ofHIV infection on recurrence of tuberculosis in South African gold miners. Int J Tuberc Lung Dis. 2000 May;4(5):455-62.
[23] Lu TH, Shan WY, Shih TP, Lee MC, Chou MC, LinCK. Factors associated with errors in death certificate completion. A national study in Taiwan. J Clin Epidemiol. 2001 Mar;54(3):232-8.
[24] Maudsley G, Williams EM. "Inaccuracy' in death certification--where are we now? J Public Health Med. 1996 Mar;l8(1):59-66.
[25] Washko RM, Frieden TR. Tuberculosis surveillance using death certificate data, New York City, 1992. Public Health Rep. 1996 May-Jun;111(3):251-5.
[26] Haas F, Hasas SS. The origins of Mycobacterium tuberculosis and the notion of its contagiousness. In: Rom WN, Garay SM, eds. Tuberculosis. 1st ed. Boston: Little, Brown, and Company 1996:3-19.
[27] Grzybowski S, Enarson D. The fate of cases of pulmonary tuberculosis under various treatment programmes. Bulletin of the International Union against Tuberculosis. 1978 Jun;53(2):70-5.
[28] Davis AL. History of the Sanatorium Movement. In: Rom WN, Garay SM, eds.
Tuberculosis. 1st ed. Boston: Little, Brown and Company 1996:35-54.
[29] Armstrong GL, Conn LA, Pinner RW. Trends in infectious disease mortality in the United States during the 20th century. Jama. 1999 Jan 6;281(1):61-6.