Sharif University of Technology
Scientia IranicaSpecial Issue on: Socio-Cognitive Engineering http://scientiairanica.sharif.edu
Lean design management using a gamied system
M. Khanzadi
a;, M.M. Shahbazi
a, M. Arashpour
b, and S. Ghosh
ca. School of Civil Engineering, Iran University of Science and Technology, Narmak, Tehran, 16846, Iran.
b. School of Property, Construction and Project Management, RMIT University, Melbourne, VIC 3000, Australia.
c. The Haskell & Irene Lemon Construction Science Division, College of Architecture, University of Oklahoma, 830 Van Vleet Oval, Room 294GH, Norman, OK 73019-6141, USA.
Received 18 March 2017; received in revised form 5 February 2018; accepted 16 April 2018
KEYWORDS Gamication; Last Planner®
System;
Design value stream; Design management; Pay for performance; Variability
management.
Abstract. Design process, due to its information- and innovation-intensive nature, is highly susceptible to change and thus, waste. This attracted the attention of lean design/construction professionals in the past few years. However, limited, if any, researches have addressed this issue from the human behavior perspective. This research proposes a method that exploits the potential of the Last Planner® System (LPS) in design
management. The main contribution of this paper is improving the applicability of the LPS to design processes by incorporating a gamied pay-for-performance system into the normal practice of the LPS. It encourages motivating design engineers by granting them single-point, autonomous responsibility to perform their tasks. To this end, the proposed method shifts the focus of design managers away from predicting the workow and chronologies of design tasks to motivate design engineers to eliminate non-value-adding works/time. To bolster the concept and examine the method, it was put into practice by construction design teams. Findings corroborate the eciency of the method in eliminating the non-value-adding works from design processes. The ndings are of practical value to consulting rms, especially design team managers who seek to maximize innovation, competency, and quality outcome.
© 2019 Sharif University of Technology. All rights reserved.
1. Introduction
Design work inherently suers from the lack of tangible deliverables and diculty to evaluate/control against progress milestones [1]. Consequently, it is not uncom-mon that planning and controlling design processes are chaotic and involve improvising, miscommunication, lack of adequate documentation, unbalanced resource allocation, and erratic decision making [2]. The internal and external interdependencies of a design *. Corresponding author. Fax: +98 21 77240398
E-mail addresses: [email protected] (M. Khanzadi); shahbazi [email protected] (M.M. Shahbazi); [email protected] (M. Arashpour); [email protected] (S. Ghosh).
doi: 10.24200/sci.2018.20325
process tend to raise the level of uncertainties and variations [3]. In lean principles, the main goal is to minimize the rate of non-value-adding (i.e., waste) work/time in the process value stream [4]. Hopp and Spearman [5] identied two major sources of waste, namely workow and process time, based on which the attempts to address the subject could be categorized into two strategies.
1.1. Strategies to manage waste
The rst strategy focuses on managing the waste of process time/schedule. This strategy attempts to propose methods to predict a more precise schedule. For example, matrix based scheduling models such as Dependency/Design Structure Matrix (DSM) [6] attempt to facilitate the formulation and implemen-tation of complex design scheduling. The DSM
sug-gests organizing complex schedules as matrix rows and columns, then oers signals to easily identify the deciencies of schedule. For instance, if there is a mark over the diagonal of the matrix, it indicates that a task gives input to an earlier task. This may be due to poor ordering of tasks, or it reects an iteration (circuit) in the logic of the process. Some researchers suggested using time buers to increase the exibility of schedule [7]. A time buer is the dierence between estimated/planned duration and the minimum duration the task should take based on optimum or baseline productivity. Goldratt [8] developed critical chain method based on buering concept. He suggested removing all buers within activities and placing them at the end and allowing activity delays to be absorbed by the pooled buer.
The second strategy aims at minimizing the waste of workow. In this context, the Last Planner®
System (LPS) [9] has signicantly contributed to the lean construction literature [10]. The LPS improves workow by creating pull ow of resources and eases bottlenecks by ltering out work packages that are not ready for execution [9]. In the short-term plan, commitments are made in weekly meetings, from which weekly work plans emerge.
1.2. Current challenges in lean design management
Despite the reportedly successful application of the LPS in construction [11,12], there is a great deal of debate on the applicability of this method to design processes. There is a fairly common agreement in the literature that certain characteristics of the design process make it fundamentally dierent from the con-struction process, thus the same management approach may not work for both [13,14]. This attracted the attention of design management academics and practi-tioners to modify the LPS, making it more adaptable to design processes [11,15,16]. Fundli and Drevland [17] incorporated collaborative design management into
LPS, applied it to a design case study, and reported positive ndings. Rosas [18] integrated the DSM and LPS into building design in order to reduce the rate of uncertainties.
Despite the increasing commentary on its merits and shortcomings, little work has surveyed the LPS from human behavior perspective. A barrier to an acceptable eectiveness of implementing lean methods lies in the fact that behaviorism is deeply ingrained in such practices [19]. In fact, to achieve success, the participative approaches in construction (e.g., LPS, Collaborative Design Management, and Integrated De-sign Management) are inevitable to consider the eects of human behavior [20,21].
1.3. Common behavioral issues
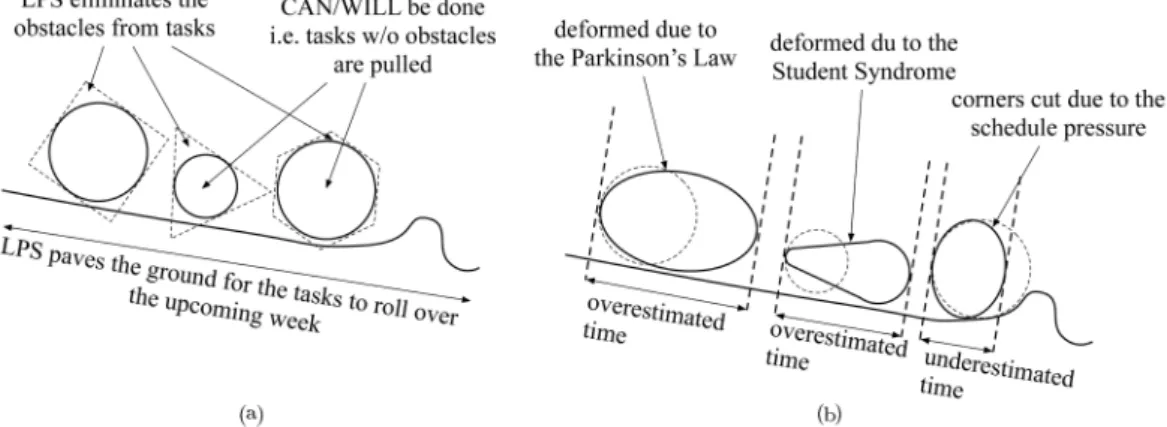
Among the roots of behavioral issues causing waste addressed in the literature, this research focuses on two major ones: over-estimation and under-estimation (Figure 1).
1.3.1. Overestimation: Waste of time
When a more-than-needed time is assigned to a task, the extra time will not show up as \free time" on the individual's activity reports, but the designer will consume all the allotted time, resulting in loss of productivity. This is due to the fact that individuals are inclined to save their vital energy rather than putting their best eort on work, unless they are exposed to a certain amount of stress from the loss of prot for a performed activity [22]. Parkinson's Law [23] and Student Syndrome [24] explain this as: \work expands to ll the time available for completion" and \individuals tend to waste time and wait until activities get really urgent before they work on them." A simple approach to allotting less time may not work as there are often small reasons relating to clarications/coordination that provide the \reason" to a design engineer for taking more time for completing a task [25].
Figure 1. Obstacles to the ow of tasks: (a) Propositions of the Last Planner®System to eliminate the obstacles and (b)
1.3.2. Underestimation: Cutting corners, erroneous outcome, and rework
On the other hand, at the task level, the studies by Buehler et al. [26] and Roy et al. [27] support the fact that when individuals underestimate the time needed to do a job, soon they run out of time, the project runs late, and management makes their team work faster [28]. In this situation, what we SHOULD do is much greater than what we CAN do, and managers tend to cut corners, which is by not checking one's work to the degree of details necessary to nd most of the error. This approach increases the probability of errors occurring, decreases the chance of detecting errors, increases the number of work defects through the selective use of information, and does not easily discover the associated quality problems until late in a project, resulting in reworks, quality deviations, and productivity losses [29,30].
2. Proposed method: Gamied Last Planner Pay-for-Performance (GL3P)
Elaborating on the behavioral barriers and drivers, this research argues that in uncertain environments (e.g., design processes), activities would be vulnerable to over-/under-estimation, leading to behavioral issues such as Parkinson's law, student syndrome, erroneous outcome under schedule pressure, and role ambiguities, especially in the case of complex, time-bound deliver-ables. To address these issues, this paper proposes a gamied pay-for-performance system with three main propositions:
1. Incorporated LPS to manage workow variabilities;
2. Applied game mechanics in order to encourage design engineers to keep away from Parkinson's Law and Student Syndrome; and
3. Integrated pay-for-performance concept with game mechanics to bring more reality into the game. A piece of software was developed based on these propositions to automate and better manage the im-plementation process.
This research is a part of a larger study conducted by the same research team on behavioral issues in participative construction processes. The aim is to develop a comprehensive framework to manage the human behavior embodying lean principles.
2.1. Last Planner® basics
The major contribution of the LPS to the lean con-struction is to minimize the waste in workow by trans-forming what SHOULD be done into what CAN be done, forming an inventory of ready works [9]. It acts on the following four project planning levels: master plan, phase schedule, look-ahead planning, and weekly
work plans. The master plan produces the initial project budget and schedule, and provides a coordi-nating map that \pushes" completions and deliveries onto the project. The phase schedule produces more detailed and manageable plans with higher complexity level. The look-ahead planning focuses on controlling the ow of work through the production system by detailing and adjusting budgets and schedules to \pull" resources into play. Weekly work plan determines the activities and scheduled work that will be done on-site according to the status of resources and prerequisites.
Despite the reportedly success of the LPS in reducing the waste in construction workow [31], lit-tle research, if any, has addressed the subject from the socio-cognitive perspective, i.e., the connection between the operational elements (planning/managing tasks/resources and utilizing control functions) and the behavioral/social elements. The socio-cognitive issue comes to the fore in design workow due to the higher complexity and unique characteristics of design process that make it fundamentally dierent from the building process [15]. Hamzeh et al. [16] highlight the following factors that make design more complex and distinct from building:
Greater uncertainty, thus lower predictability of future tasks;
The impact of increasing execution speed of design tasks on removing constraints and making tasks ready for execution;
Interdependencies between design tasks, which in-crease the level of complexity;
In design, more work is done by individual special-ists than in construction. Therefore, the ability to assess capacity when responding to requests requires individual work plans at the commitment level. They conclude that (1) the level of interdependence in design is much higher than that in construc-tion; (2) design tasks are subject to higher level of complexity than building tasks are, due to the higher interdependencies; and (3) the consequences of human behavior are more signicant in design than in construction.
This paper takes advantages of game mechanics applied to the LPS in order to facilitate design man-agement from the behavioral perspective.
2.2. Gamication and game mechanics
Gamication is commonly dened as the use of game elements in non-game contexts [32]. Game, in classic context, is \a rule-based formal system with a variable and quantiable outcome, where dierent outcomes are assigned dierent values, the player exerts eort in or-der to inuence the outcome, the player feels attached to the outcome, and the consequences of the activity
are optional and negotiable" [33]. The conceptual aim of gamication is to make activities enjoyable by adding inherently enjoyable game elements. For this, game mechanics can be layered on top of serious works and drive engagement, proactivity, and loyalty [34].
Gamication has been increasingly used as a pro-cess of enhancing services with motivational aordance in order to invoke gameful experiences and further outcomes [35]. Industry professionals have taken notice of this trend and have attempted to apply motivational potential of games to various non-gaming contexts to foster user engagement by rewarding and directing employee attention to particular focal conducts [36,37]. The proposed method takes advantage of game elements (i.e., points, levels, scoreboard), encour-aging designers to avoid engencour-aging in non-value-adding works/times. The point allotted to a task represents the value the task contributes to the project/organization. At the end of each month, the total points gained by a player are taken as the basis for payments. This is in congruence with pay-for-performance (P4P) concept, which involves provid-ing rewards through carefully designed compensation systems that base payment on the measured perfor-mance [38].
2.3. Pay-for-performance
Pay-for-performance is payments to individuals accord-ingto their performance. In this payment system, an individual risks not receiving (either the whole or a part of) the payment unless the same or a higher level of performance is achieved by reaching the targets assigned [39]. To develop a fair payment system, an elaborate performance metric is needed.
2.3.1. Performance metric
The main driver in ruling performance is the rate the task exceeds its due date. To put emphasis on this, the delayed tasks are penalized as shown in Eq. (1):
P Fi= min
1; max
0; P P Fj
DOi DUi
DUi DAi
; i = 1; 2; ; n; j = 1; 2; ; m; (1) where P Fiis the penalty factor for task i; P P Fj is the
penalty factor for project j; DOi, DUi, and DAi are
the dates when the task i has been assigned, has been done, and should have been done, respectively; n is the number of tasks; and m is the number of projects. The point assigned to task i, Pi, is then modied using
Eq. (2): P
i = Pi(1 P Fi): (2)
At the end of each month, the total point gained by employee k, T Pk, is calculated using Eq. (3), based
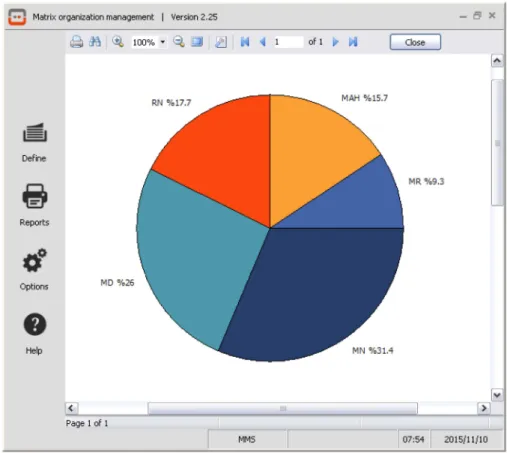
on which a scoreboard is created (Figure 2). Team members are able to monitor their position in the board. This motivates them to adjust their position by working harder and taking corrective actions for the next week. This is in accordance with the reinforce-ment immediacy concept, that is, the shorter the delay between the action and the reinforcement, the more ef-fective the reinforcement will be, because the contiguity or connection between the two is strengthened:
T Pk = n
X
i=1
P
i: (3)
The scoreboard will be taken as the basis for calculating variable pay, V Pk, using Eq. (4):
V Pk = V P BT Pk
Xl k=1
T Pk
1
; k = 1; 2; :::; l; (4) where V P B is the Variable Pay Budget (e.g., for a division) and l is the number of employees.
3. Design and implementation
A client-server desktop application was implemented to examine the applicability of the proposed method in design management.
3.1. Task life-cycle
Each task can end with one of the three states: DONE, APPROVED, or CANCELED; otherwise, it would be IN-PROGRESS. These states can be updated by the assignee or by the manager in weekly meetings. As-signees do not receive points unless they shift the status to DONE and then APPROVED. The unaccomplished tasks (i.e., IN-PROGRESS) are questioned for reasons and the possible obstacles are discussed in the meetings like a brain-storming session. To address the obstacles, new tasks may emerge from the brain-storming; the tasks are then rened, prioritized, and fed into the life-cycle. If a task is determined as not doable, it will be CANCELED. Figure 3 shows the task life-cycle during a meeting.
3.2. Notication system
Notifying parties in a timely, sustainable manner was a focus in designing and implementing the program. In this sense, an elaborate notication service was deemed crucial. PostgreSQL [40], for its asynchronous LISTEN/NOTIFY feature, was favored for this pur-pose. The messaging mechanism is used along with triggers to issue notications to other clients. In this mechanism (Figure 4), all clients listen for updates from the projects they are a member of. Once a task is updated, a message is broadcasted to the other parties of the same project, displaying a popup window (Figure 5).
Figure 2. Monthly scoreboard of the team members' performance.
Figure 3. Flowchart of creating/updating tasks in weekly meetings.
Furthermore, PostgreSQL facilitates development of triggers and functions in high-level programming languages (e.g., Python [41]). This feature allowed highly complex logic blocks to be easily developed and maintained. For example, when an urgent task is
Figure 4. Notication broadcast mechanism.
created, using python triggers, the database sends an email and/or text message to the oine assignees. To do so, a client (Delphi application) creates a task in the database (PostgreSQL) and the database checks the assignee's situation (online/oine); if the assignee is not connected to the server, PostgreSQL triggers the functions \send email" and \send sms" written in plpython (i.e., Python in PostgreSQL) (Figure 6). 3.3. Roles and permissions
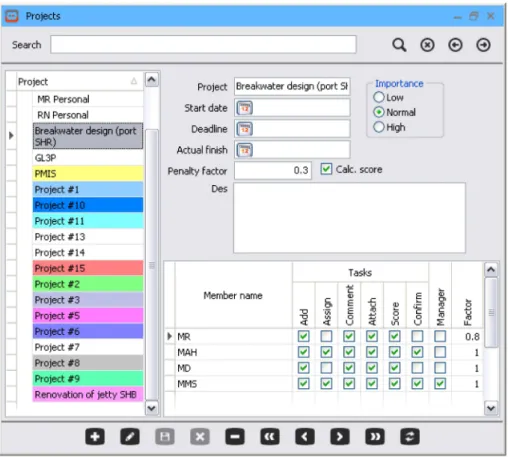
To support the matrix organization structure [42], the relationship between project and members is taken as many-to-many, that is, individuals may play dierent
Figure 5. Notication popup window.
Figure 6. The application of triggers in routing notication messages.
roles in dierent projects (Figure 7). The common roles and permissions that are supported by the soft-ware are listed in (but not limited to) Table 1 and Figure 7.
- Doer: Doers are those who perform the tasks. They can create tasks for themselves, but are not allowed to assign tasks to the other parties. They can also comment and attach les to the assignments;
- Coordinator: Coordinators have doers' authorities, plus they can assign tasks to the other members;
- Supervisor: They inherit all the authorities from the coordinators, plus they can approve the tasks accomplished by the assignees;
- Leader: Project leaders have all the authorities they need to manage the project. They can add/remove members to/from the project, and grant them the necessary permissions. They can also edit/remove the others' tasks.
It should be noted that these roles are not rigid and unchangeable. For instance, the project leader can delegate some roles to the supervisor. On the other
Figure 7. The role of each member in each project. Table 1. Original role authorities in GL3P.
Leader Supervisor Coordinator Doer
Add
Assign
Attach
Comment
Approve
Rate
Lead
hand, the project members are not limited to only one organization. It is possible to have participants from the other organizations and individuals (e.g., contractors, owner, shareholders, stakeholders, etc.). 4. Case study
The proposed method was examined and validated by design teams in 17 civil engineering projects, espe-cially marine structures and oshore engineering, for a period of approximately four months. Among the participants, 33% were older than 35 years old, 50% were between 30 and 35, and the rest were younger than 30. In terms of academic qualications, 33% of the participants had Master's degree or above and 67%
had Bachelor's degree. 17% of the participants had more than 10, 67% between 5 and 10, and the rest less than 5 years of experience. The process entailed the following two stages:
Stage 1: Before gamication
At the rst stage, the authors studied and gathered data from the current task accomplishment process. To do so, the team members were given task sheets to document what they did on a daily basis. The manager was then asked to assign points to the tasks he recognized as accomplished properly. The points were judged based on the reasonable time needed for doing the task.
Stage 2: After gamication
The objective of this stage was to examine the impact of the proposed method on increasing the rate of VA. At this stage, meetings were conducted on a weekly basis. In the meetings, the tasks were evaluated, passing the evaluation process, and weekly work plans emerged for the upcoming week.
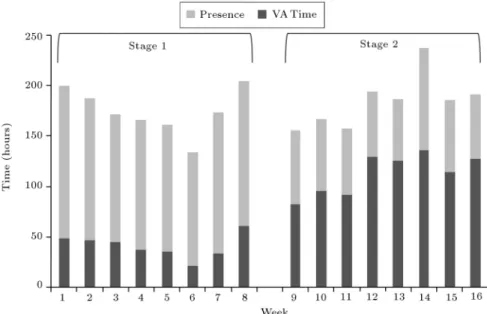
4.1. Results and discussion
The value-added time (i.e., the sum of points as-signed to the approved activities) was measured and compared with the total presence time as shown in Figure 8.
Figure 8. Comparing the Value-Adding (VA) times and total presence times between Stage 1 and Stage 2.
Figure 9. Comparing the rates of VA time between Stage 1 and Stage 2.
It should be emphasized that contrary to task durations, a point, once assigned to a task, cannot be mutated by elongating/shortening the time spent. This minimizes the negative impacts of under-/over-estimations. The GL3P encourages the assignees to accomplish the tasks at the minimum duration, then proceed to the next in the list. This provides team members with the opportunity to shift up their position on the board, achieving more satisfying pay-ments.
Using Figure 8, the rate of VA time can be drawn as shown in Figure 9.
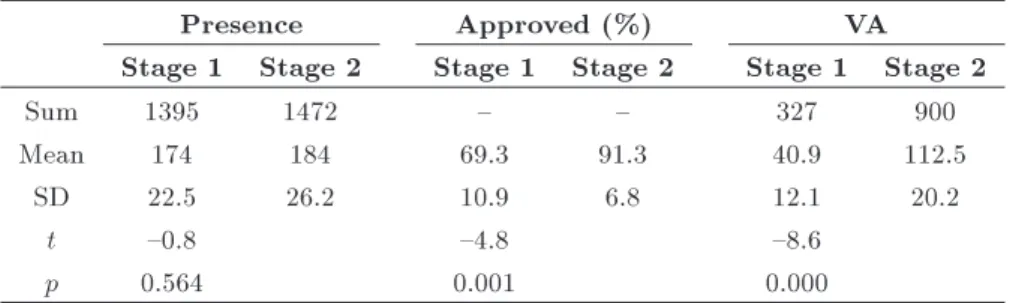
To ensure a statistically rigorous comparison be-tween Stage 1 and Stage 2, paired two-sample t-tests were conducted at the condence level of 95% ( = 0:05). Doing so, the following null hypothesis was tested:
Hypothesis: Utilizing GL3P in design management makes no signicant dierence between the rate of VA in Stage 1 and that in Stage 2.
The results of statistical analysis (p- and t-value) are given in Table 2, from which a signicant decrease (46%) in the rate of non-value-adding time can be concluded. The p < 0:05 is the evidence for rejecting the null hypothesis.
5. Conclusions
Focusing on behavioral barriers bring about waste in design processes. This research aimed at contributing a step forward in eliminating waste from the design processes using a gamied system, GL3P, oering the following propositions:
Table 2. Results of two-sample t-test.
Presence Approved (%) VA
Stage 1 Stage 2 Stage 1 Stage 2 Stage 1 Stage 2
Sum 1395 1472 { { 327 900
Mean 174 184 69.3 91.3 40.9 112.5
SD 22.5 26.2 10.9 6.8 12.1 20.2
t {0.8 {4.8 {8.6
p 0.564 0.001 0.000
1. Taking advantage of the LPS concept, especially the weekly meetings;
2. Incorporating game mechanics into the tasks emerg-ing from the weekly meetemerg-ings, i.e., weekly work plans;
3. Associating the payments with gamied system us-ing the pay-for-performance concept.
To facilitate the implementation and measurement, a desktop application was developed.
The proposed method is novel to the lean de-sign management literature for integrating the LPS, gamication, and pay for performance concepts, based on which a computer program, GL3P, is developed and put into practice. GL3P encourages man-agers/organizations to shift the basis of payment and focus of design management from \presence time" to \value-adding time". The method was examined by design teams and the results corroborated its meaning-ful impact on enhancing the performance of the design teams.
The contribution of this research should be con-sidered in light of several limitations, each of which can signal possible directions for future research: rst, it is not easy to implement changes in companies. In fact, many people feel controlled when the evaluation stage is carried out. Setting goals, assigning tasks, and determining the value after the fact, while accounting for situational factors, require managers to understand the full context of employees' performance and create awareness about the principles of lean. Second, touch-ing the engineers' payments would raise opponents, of which the managers are often afraid. Lessons learned from empirical applications suggest relying on non-controlling and informational language, displaying patience to accept the opponents' expressions, and giving them time to adjust themselves to the new system. Nevertheless, these human-nature barriers tend to vanish when improvements start to appear.
This research contributes to the body of knowl-edge in construction design management by providing design managers with the means to automate design tasks management and designer's performance moni-toring using a gamied system.
Acknowledgement
The authors would like to thank Professor Ron Wake-eld at RMIT University for his kind support.
References
1. Ballard, G. and Koskela, L. \On the agenda of design management research", Proceedings IGLC, pp. 52-69 (1998).
2. Mazlum, S.K. and Pekericli, M.K. \Lean design management-an evaluation of waste items for architec-tural design process", METU Journal of the Faculty of Architecture, 33, pp. 1-20 (2016).
3. Koskela, L., Ballard, G., and Tanhuanpaa, V.P. \To-wards lean design management", Proceedings of the 5th Annual Conference of the International Group for Lean Construction, Gold Coast, pp. 1-13 (1997).
4. Yu, H., Tweed, T., Al-Hussein, M., and Nasseri, R., \Development of lean model for house construction using value stream mapping", Journal of Construc-tion Engineering and Management, 135, pp. 782-790 (2009).
5. Hopp, W.J. and Spearman, M.L., Factory Physics, 3rd Edition, McGraw-Hill (2008).
6. Steward, D.V., Systems Analysis and Management: Structure, Strategy, and Design, Petrocelli Books (1981).
7. Arashpour, M., Wakeeld, R., Abbasi, B., Lee, E.W.M., and Minas, J. \O-site construction opti-mization: Sequencing multiple job classes with time constraints", Automation in Construction, 71, pp. 262-270 (2016).
8. Goldratt, E.M., Critical Chain, North River Press (1997).
9. Ballard, H., The Last Planner System of Production Control, University of Birmingham (2000).
10. Russell, M.M., Liu, M., Howell, G., and Hsiang, S.M. \Case studies of the allocation and reduction of time buer through use of the last planner system", Journal of Construction Engineering and Management, 141, p. 04014068 (2015).
11. Fosse, R. and Ballard, G. \Lean design management in practice with the last planner system", 24th Annual Conference of the International Group for Lean Con-struction, Boston (2016).
12. Khan, S. and Tzortzopoulos, P. \Improving design workow with the last planner system: Two action research studies", 23rd Annual Conference of the In-ternational Group for Lean Construction, pp. 568-577 (2015).
13. Hansen, G.K. and Olsson, N.O.E. \Layered project{ layered process: lean thinking and exible solutions", Architectural Engineering and Design Management, 7, pp. 70-84 (2011).
14. El. Rei, M.H. and Emmitt, S. \Perceptions of lean design management", Architectural Engineering and Design Management, 9, pp. 195-208 (2013).
15. Bolviken, T., Gullbrekken, B., and Nyseth, K. \Collab-orative design management", 18th Annual Conference of the International Group for Lean Construction, Haifa, Israel, pp. 103-112 (2010).
16. Hamzeh, F.R., Ballard, G., and Tommelein, I.D. \Is the last planner system applicable to design? A case study", 17th Annual Conference of the International Group for Lean Construction, Taipei, Taiwan, pp. 165-176 (2009).
17. Fundli, I.S. and Drevland, F. \Collaborative design management - A case study", 22nd Annual Conference of the International Group for Lean Construction: Un-derstanding and Improving Project Based Production, IGLC, pp. 627-638 (2014).
18. Rosas, E. \Integrating the design structure matrix and the last planner system into Building Design", 21th Annual Conference of the International Group for Lean Construction, Fortaleza, Brazil, pp. 389-398 (2013).
19. Vaagen, H. and Aas, B., A Multidisciplinary Frame-work for Robust Planning and Decision-Making in Dynamically Changing Engineering Construction Projects, pp. 515-522 (2014).
20. Cameron, I., Hare, B., Du, R., and Maloney, B. \An investigation of approaches to worker engagement", HSE RR516 (2006).
21. Xue, X., Shen, Q., and Ren, Z. \Critical review of collaborative working in construction projects: Busi-ness environment and human behaviors", Journal of Management in Engineering, 26, pp. 196-208 (2010).
22. Bartoska, J. and Subrt, T. \The eect of human agent in project management", Central European Journal of Operations Research, 20 pp. 369-382 (2012).
23. Parkinson, C.N., Parkinson's Law (1984).
24. Leach, L.P. \Critical chain project management im-proves project performance", Project Management Journal (1999).
25. Kamma, D., Geetha, G., and Neela, J.P. \Countering Parkinson's law for improving productivity", Proceed-ings of the 6th India Software Engineering Conference on - ISEC, New York, USA, 13, pp. 91-96 (2013).
26. Buehler, R., Grin, D., and Ross, M. \Exploring the planning fallacy: Why people underestimate their task completion times", Journal of Personality and Social Psychology, 67, p. 366 (1994).
27. Roy, M.M., Christenfeld, N.J.S., and Mckenzie, C.R.M. \Underestimating the duration of future events: memory incorrectly used or memory bias?", Psychological Bulletin, 131, p. 738 (2005).
28. Williams, T., Modelling complex Projects, John Wiley & Sons (2001).
29. Park, M. and Pe~na-Mora, F. \Dynamic change man-agement for construction: introducing the change cycle into model-based project management", System Dynamics Review, 19, pp. 213-242 (2003).
30. Nepal, M.P., Park, M., and Son, B. \Eects of schedule pressure on construction performance", Journal of Construction Engineering and Management, 132, pp. 182-188 (2006).
31. Hamzeh, F.R., Improving Construction Workow-The Role of Production Planning and Control (2009)
32. Deterding, S., Dixon, D., Khaled, R., and Nacke, L. \From game design elements to gamefulness", Pro-ceedings of the 15th International Academic MindTrek Conference on Envisioning Future Media Environ-ments - MindTrek'11, New York, USA, p. 9 (2011).
33. Juul, J., A Casual Revolution: Reinventing Video Games and Their Players, MIT press (2010).
34. Paharia, R., Loyalty 3.0: How to Revolutionize Cus-tomer and Employee Engagement with Big Data and Gamication, McGraw Hill Professional (2013).
35. Hamari, J. \Transforming homo economicus into homo ludens: A eld experiment on gamication in a utilitar-ian peer-to-peer trading service", Electronic Commerce Research and Applications, 12, pp. 236-245 (2013).
36. Reiners, T., and Wood L., Gamication in Educa-tion and Business, Springer InternaEduca-tional Publishing (2015).
37. Ruhi, U. \Level up your strategy: Towards a de-scriptive framework for meaningful enterprise gami-cation", Technology Innovation Management Review, 5, p. 5 (2015).
38. Locke, E.A. and Latham, G.P., New Developments in Goal Setting and Task Performance, Routledge (2013).
39. Armstrong, M. and Murlis, H., Reward Management: A Handbook of Remuneration Strategy and Practice, Kogan Page Publishers (2007).
40. Obe, R. and Hsu, L., PostgreSQL: Up and Running, O'Reilly Media, Inc. (2012).
41. Rossum, G.V., Python Reference Manual, Centrum voor Wiskunde en Informatica (1995).
42. Project Management Institute, A Guide to the Project Management Body of Knowledge, Project Management Institute, Inc., p. 616 (2013).
Biographies
Mostafa Khanzadi is Associate Professor of Con-struction Engineering and Management in the De-partment of Civil Engineering at Iran University of Science and Technology. His research interests include performance management, decision support systems, and strategic project management.
Mohammad Mahdi Shahbazi is PhD candidate in Construction Engineering and Management at Iran University of Science and Technology. For his thesis, he has been working on incorporating gamication concepts into lean construction principles aiming at improving the performance of construction/design en-gineers through mitigating the eects of behavioral issues and motivating them to perform better. In this sense, he has been contributing to the development and implementation of the following gamied lean systems:
Tetron, a gamied design management system based on task repositories; Harmonix, a gamied task man-agement system for construction sites; and DocMe, a gamied lean document/knowledge management sys-tem in which the construction engineers are motivated to share their knowledge.
Mehrdad Arashpour is Lecturer and Researcher in the School of Property, Construction and Project Management. His research focuses on process opti-mization and automation, productivity improvement, civil engineering design, uncertainty management, and operations research.
Somik Ghosh is Assistant Professor in the Haskell & Irene Lemon Construction Science Division. His re-search interests are lean construction, multidisciplinary collaboration, occupational safety, and resilience engi-neering.