Vol. 2, No. 1, pp 28-40 Spring 2008
Modeling of a Probabilistic Re-Entrant Line Bounded by Limited
Operation Utilization Time
Suresh Kumar
Department of Electrical and Electronics Engineering Technology, Yanbu Industrial College, Kingdom of Saudi Arabia.
[email protected] ABSTRACT
This paper presents an analytical model based on mean value analysis (MVA) technique for a probabilistic re-entrant line. The objective is to develop a solution method to determine the total cycle time of a Reflow Screening (RS) operation in a semiconductor assembly plant. The uniqueness of this operation is that it has to be borrowed from another department in order to perform the production screening task. Since the operation is being shared, there is a time limit to utilize it in a day. Screening of lots that cannot be completed within the given time has to be continued in the following days. The contributions of this paper is the development of a lot clustering method and factoring the limited time sharing condition and thus develop an analytical model. Comparison results were made using available real historical data. The proposed model provided operation managers with the total cycle time computation method and determining the appropriate cluster size to be loaded into the operation.
Keywords: Probabilistic re-entrant line, Mean value analysis, Lot clustering, Total cycle time 1. INTRODUCTION
In the recent years cost has been a major concern in manufacturing. There is a pressing need to cut down manufacturing cost in order to stay competitive. This applies in fact to all manufactured products. The bulk of the expenditure in most manufacturing lines usually is on equipment purchase. Hence, in many manufacturing facilities this budget is allocated to the main production as that area is considered as a money generating department. However, many a time supporting departments such as quality and reliability need to utilize production equipments in order to perform processes which are in smaller volume or a single time process. In the eyes of the management, investing in additional equipment that exists in the plant would not be approved. Thus, the alternative way is to share the equipment and a schedule is formed to accommodate this activity. On the other hand, equipments can be owned by supporting departments and the main production lots are streamed to these equipments to perform a particular process. In this case, usually the volume is not high as the production and there could be some deviation or screening process required for the lots. In either case, sharing of equipment is required in order to achieve the shipment goals and cost saving.
The Reflow Screening (RS) is a process in the semiconductor back end manufacturing industry. The RS operation is not part of the main production line, but performed separately in a reliability laboratory environment. The purpose of the reflow operation is to mount chips on printed circuit board, in the electronic assembly plants. However, in the semiconductor industry, the reflow
operation becomes a screening process to remove defective units residing in the lots. This is known as reflow screening. Thus the main production has to borrow the operation from the reliability department to perform the task. The details of the operation is given is section 3.
The RS operation is a multistage operation with feedback. However, the operation is conditioned such that it has probabilistic re-entrant lines and the duration to utilize the operation by the production is limited to certain number of hours in a day. Probabilistic re-entrant is defined as lots entering the system with different repeated cycle requirements for each lot. For this operation, the re-entrant happens at the second stage where lots that need further screening are re-routed from the fifth stage. For illustration purpose, if N number of lots enter the system, some of them will require one cycle and the others will require 2 or more cycles.
The motivation of this research is to develop an analytical model based on a queueing network system to compute the total cycle time for a given number of lots which is clustered. The model captures two factors which are the probabilistic nature of the re-entrant and limited utilization time. This research focuses on the extension of a queueing model based on the mean value analysis (MVA) technique which generates the total cycle time. The total cycle time (makespan) is defined as the time taken to complete the entire process sequence for a given number of lots.
The remainder of this paper is organized as follows. Section 2 presents the literature review. Section 3 presents the research environment. Section 4 deals with the model formulation. Section 5 presents the computational experience and results and section 6 concludes the work.
2. PREVIOUS WORK
Gross and Harris (1998) and Park et al. (2002) in their work defined mean value analysis (MVA) based on two fundamental principles:
a) The queue length observed by an arriving customer or job is the same as the overall distribution in a closed network system seen by an outsider with one less one or job in the system.
b) Little’s Law (1961) is applied to relate the mean queue length with the arrival rate and the mean waiting time.
Gross and Harris (1998) presented a single server M/M/1 fundamental equation for analysing closed queueing networks by means of the mean value analysis (MVA) technique. The MVA is an iterative method for analyzing queueing systems under steady state conditions. Thus, the method is used as the fundamental methodology for this research. Gross and Harris (1998) have compared the results obtained from the MVA method and normalizing constant method and found that both produce the same results. Normalizing constant method requires steady state probabilities to compute the queueing length but the MVA algorithm can directly calculate the queue length and waiting time without deriving the steady state probabilities. This simplifies the computational process and is useful to develop extension models to represent other types of queueing networks.
Narahari and Khan (1995,1998) proposed the first application of MVA method to a re-entrant line with single class and single job machine. Re-entrant lines are a class of non-traditional queueing networks in which lots visit the same machine several times at different stages of processing before exiting the system. The main contribution of their paper is a proposal of an efficient approximate technique based on MVA to compute the performance (mean steady state cycle time and throughput
rate) of the re-entrant lines employing on pre-emptive fixed buffer priorities and fixed WIP input release policy. Extension of the MVA was also done to take into account the following features of the re-entrant line such as deterministic routes in re-entrant lines, multiple jobs visit to the same work center and priority scheduling based on buffer priorities. The advantage of this method (MVA) is much faster as compared to simulation and the computation complexity is much reduced. However, in their method, materials flowing through have purely deterministic routes. In addition to this, the number of lots tested in their system is below 40. Increasing to a larger number of lots would create larger errors and require a correction factor to the computation. Narahari and Khan (1996) have also considered re-entrant manufacturing systems with inspection stations placed at various stages. Their creative idea was to find alternative locations to place inspection stations at various stages of processing. They formulated an approximate analytical technique method based on MVA to compute mean steady state cycle times and throughput rates. Inspection stations were intended to ensure and track quality and process performance and at the end of the inspection there were three possible outcomes: accept, reject and rework. Thus the system carries re-entrant line that is probabilistic in nature. The method clearly models scheduling policies used in re-entrant lines for rapid performance analysis. Thus, the method is able to determine the minimum number of inspection stations and the maximum location to maximize throughput. The shortcoming of their method is that the reject rates have to be small. Their method might not be able to handle large reject rates coming from the inspection station, as it would create instability in the system.
Muduli and Yegulalp (1996) developed an analytical method to model a truck shovel network for an open-pit mining system as a multiple closed queueing network. They utilized the MVA approximation method with emphasis on computing the maximum throughput of the mine and the maximum configuration of the truck fleet. The results were compared with simulation results and they were fairly accurate. The idea of optimal throughput is attained when the utilization is maximized.
In a case study conducted by Halachimi et al. (2000), a robotic milking barn was designed by using closed queueing networks. Their technique uses an approximate mean-value algorithm (AMVA) to evaluate important performance criteria such as the number of cows waiting to be milked, their waiting time and the utilization of the facilities. The model was used for a practical problem related to the design of the barn. Their algorithm was able to solve a farmer’s problem of considering buying additional milk quota by analyzing the adequacy of the current capacity of holding a bigger cow herd and computing for extra capability if needed.
In extension to Narahari and Khan’s work (1995), Park et al. (2002) proposed an approximate approach for analyzing the performance of a re-entrant line with single or batch machines and multi-class jobs using the MVA technique. The main difference was that multi class jobs were considered as compared to the earlier works of Narahari and Khan (1996). In addition, the re-entrant lines also consist of both single job machine and batch machine. Multi class job were assumed to be flowing through predetermined routes and the routes may be different for different class of jobs. In most of the re-entrant lines studies done previously, the cycle time computed are linearly proportional to number of jobs in the system and does not require adjustment to the model. However in Park et al.’s (2002) paper, some heuristic corrections were made to their mean cycle time for workstations that contained batch machines. They have also taken additional step by evaluating the model with a large number of jobs going beyond one hundred. A cutoff point was determined to indicate at what number of lots the correction should be implemented. Their work was conducted under ideal condition and nothing was mentioned about the variation of the arrival of jobs into the system.
Park et al. (2005) have extended their previous work (Park et al., 2002) by considering random production losses due to machine failures and yields. Losses were considered in their MVA model, as they believed that it represents the real system. In their previous work, the performance measures of interest were the steady state average of the cycle time of each job class, queue length of each buffer and the throughput of the system. The methodology used is the iterative procedure based upon MVA with some heuristic adjustments.
Kumar and Omar (2005a,) have developed an analytical method for a 5 stage probabilistic re-entrant line using the MVA technique for an environmental stress testing (EST) operation. The model was based on MVA and traffic equation proposed by Gross and Harris (1998). Their objective was to compute the mean waiting time and mean throughput rate. In their work, they found that as the number of lots in the system increased beyond a certain number, analytical and simulation results comparison produces large errors. A correction factor was introduced into the model to adjust the mean waiting time beyond a certain number of lots in the system. However the correction factor formulation obtained was case dependant.
In this paper, further improvement is done on the formulation by Kumar (2007) and the limited hour of operation usage is considered. Thus, a modified analytical method based on MVA and lot clustering technique is proposed to be used for the probabilistic re-entrant line. It is a method developed to allow the operation manager to measure the cycle time in terms of lot clusters.
3. RESEARCH ENVIRONMENT
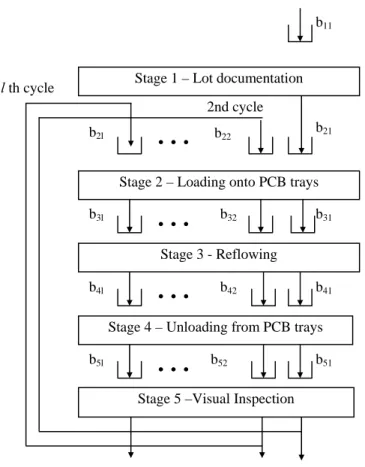
In the Reflow Screening (RS) operation where the semiconductor products or commonly know as surface mount integrated circuits (ICs) are subjected to severe solder paste melting condition. In the printed circuit board (PCB) assembly plants, surface mount devices are physically soldered on to the printed circuit boards by means of solder paste and melting them at an elevated temperature. The process of melting and hardening the solder to create adhesion is known as reflowing. This process is the actual physical process employed in PCB assembly plant. During reflowing, if the units are unable to withstand the heat profile then, the IC packages will have cracks lines. This is undesirable and cause moisture penetration into the package which leads to corrosion and malfunction of the units. Thus it falls on the shoulder of the semiconductor manufacturers to produce robust packages that are able to withstand the severe heat condition applied by their customers (PCB assembly plants). Thus, in semiconductor manufacturing, simulation of the reflow process and screening of the products are done in order to weed out potential defective units. The RS operation being fully automated is divided into 5 stages. Since the units are of surface mount packages, they are handled mostly by a pick and place machine and the inspection is done by an auto vision system which detects visible cracks. Figure 1 illustrates the workflow block diagram which depicts the five stages of RS operation. Lots that are suspected to have defects and require the screening process are diverted to this operation from the main production. Since this is a screening process, all the units in the lot will undergo this process. However each lot that enters this operation will have its own number of screening cycles needed. For instance, lot 1 may require 2 cycles, lot 2 may require 3 cycles, lot 3 may require 1 cycle and so on until N lots. This is predetermined externally. In stage 1, the lots arrive in trays and are provided with lot documentation. Lots will enter the system and reside in a buffer called buffer b11 before lot documents are generated of each lot. Lots will then move to the second stage into buffer b21 and wait for their turn to be processed. In this stage the individual units are picked by an automatic pick and place handler and place them on the PCB tray. They are sequentially arranged so as to provide uniform heat distribution. Once this process is done, the lots will be carried to buffer b31 at stage 3
by a conveyor and subsequently conveyed into the reflow chamber by a conveyor belt. The duration of the heat stress is set on the chamber. Upon completion of the heat stress, the lots are conveyed out from the chamber and put in buffer b41 to be cooled and unloaded from the PCB tray and placed
onto the original tray. This is done by another pick and place handler situated at the other end of the reflow chamber. The lots will move to stage 5 into buffer b51 and wait for the visual inspection by
an automatic vision system. It will look for cracks on the units under magnification. Any unit from a lot that is found to be defective is rejected and is removed from the lot for failure analysis. The quantity of the lot will be reduced and if the reduction is significant, the processing time of the lot will also change. However in order to simplify, it is assumed that the rejects from the lot is insignificant and does not change the processing time of the subsequent cycles. The entire lot will either be re-entered to stage 2 into buffer b22 for the next reflow cycle. If a lot has completed its required cycle then it will be returned to the production for further process continuation. Thus, not all of the lots will go through the same number of reflow cycles and this creates a probabilistic nature of the re-entrant line.
The next issue is the length of time the reflow operation could be used for screening. As mentioned earlier this operation is borrowed from the reliability operation and cannot be used continuously. Thus, there are several hours in a day that is operation can be borrowed by the production. Generally, the lending duration varies between 3 to 5 hours in a day. This is known as borrowing
time. Due to this condition, the total cycle time of cluster of lot will be affected and work has to continue the following day if the time exceeds the borrowing time.
Figure 1 Block diagram of the reflow screening operation 2nd cycle
l th cycle
b31
b41
b51 b21 b11
b5l b4l b3l b2l
…
…
…
…
b52 b42 b32 b22
Stage 1 – Lot documentation
Stage 2 – Loading onto PCB trays
Stage 4 – Unloading from PCB trays
Stage 5 –Visual Inspection Stage 3 - Reflowing
4. MODEL FORMULATION
The considered operation has five stages serially connected with l th cycle buffers at every stage. When lots arrive at any stage from the previous one, the lots will queue in their respective buffer before they are processed. Buffers are temporary waiting place before the lots are processed. In this case the lots are processed on a first come first serve basis. Every stage acts as a single server system. After the last stage, lots are fed back into the second stage and will undergo repeated cycles of reflow screening as required by the lots.
4.1. System Assumption
In order to facilitate the development of the analytical model, the RS operation is described as a queueing system. However, to avoid mathematical complexity, several assumptions are considered as follows:
1) In order to utilize the MVA equations, the RS operation is considered as a closed network system where there is no continuous external arrival. The number of lots in the system (WIP) is kept constant. Consequently, the operation can be described as a closed and product form queueing system. Once the adaptation is done, the performance measure of the total cycle time is computed.
2) All stages have their own constant mean process time. Any small changes in the lot size does not affect the process time. If the changes are large enough, then the entire lot is removed from the operation and immediately replaced by a similar lot. The lots have standard size too. 3) This system is assumed to have sufficient amount of lots for the stages to continuously
operate during the borrowing time. A new cluster is only started on a new day and not continued after completing the previous cluster. It is also assumed that the operation is free from disturbances, interruptions or additional setup time which can add to the total cycle time. 4.2. Notation
i index of stage, i = 1,…, M
j index of the previous stage where the lots are arriving from
l number of stress cycles l = 1, …, P
k number of lots in the system, k =1,…, N
m index of stage where operators are assigned to
µil mean processing rate of a lot at buffer bil λ(k) throughput rate when the system has k lots
rl routing probability of l th cycle
rT combinational routing probability
bil buffers at stage i for l th cycle
s smoothing moving average span size
yd waiting time needed for lots to be continued the next day
d number of days required to complete a cluster of lot
Lil(k) mean number of lots waiting at bil with k number lots in the system Wil (k) mean waiting time of a lot in bil when the system has k number of lots W(k) total waiting time for stage 2, 3, 4 and 5 with k number of lots
WT (k) total cycle time of k number of lots going through all buffers
WT*(k) modified total cycle time of k number of lots with combinational routing probability
RWT(k) corrected total cycle time of k number of lots (corrected)
RWT*(k) modified total cycle time due to limited borrowing time of k number of lots
4.3. MVA Equations
MVA equations are based on the arrival theorem and Little’s Law (1961). Arrival theorem defined by Reiser and Lavenberg (1980) states that the queue length observed by an arriving lot to a workstation is the same as the overall queue length seen by an outside lot when system’s lot population is less by one. Little’s Law gives a relationship between mean queue length with the arrival rate and mean waiting time. Thus the mean waiting time of lots in buffer bil is
il il il il
µ µ
) (k L (k)
W = −1 + 1 (1)
The total cycle time for k number of lots in the system having P number of re-entrant lines is derived as
∑ = ∑ =
= P
l Wil(k) M
i (k) T W
1 1
(2)
Equation (2) indicates that all k lots will go through all the buffers in its route. Applying Little’s Law for the population of lots in the system, the through put rate is obtained as
(k) T W
k (k)
λ = (3)
The mean queue length at every buffer is
Lil(k) = λ(k) Wil (k) (4)
The initial conditions for the iterations are
Lil(0) = 0 , Wil (0) = 0 , λ(0) = 0 (5)
The total cycle time has to be adjusted accordingly based on the probabilities of re-entrant lines. The total cycle time is computed by an iterative method with the given initial conditions. The
analytical model shown above indicates that all k number lots will pass through every buffer before exiting from the system. However, in this study the nature of the re-entrant is not purely deterministic but depends on the number of cycles the lots are required to go through.
4.4. Lot Clustering Approach
In deterministic routes, k number of lots is consistent over the entire route. On the other hand, in this operation each lot that enters the operation has different stress test cycle requirements. The k lots do not go through all the defined routes. It would be tedious to compute the cycle time of an individual lot entering the operation due to the different requirements of each lot. In order to solve this problem, a lot clustering approach is taken whereby lots are virtually gathered in groups. There is no physical grouping of the lots. In this approach, lots will enter buffer b11 as usual in a serial manner. A cluster of maximum number of lots, N lots, is identified as they enter and the percentage number of lots for each cycle is noted. For example, for a cluster of 10 lots, 60% require 2 cycles of screening and 40% require only one cycle of screening. This brings about the probabilistic routing,
rl on the re-entrant lines. Thus, modification is made to the total cycle time of N number of lots that enters the operation. The advantage of this method is that no additional waiting time and cost is required to physically group the lots. In addition, this method reduces the computation complexity compared to using the traffic equation method. The total cycle time can be computed in terms of the number of lots which is clustered.
4.5. Combinational Routing Probabilities
Since the first stage has only one buffer, b11 and all N number of lots requires going through this stage, adjustment is not required at this stage. The re-routing affects the other stages since the lots require re-entering from stage 2 onwards. The maximum number of screening cycles, P is the highest number of cycles in an identified cluster of lots. The waiting time from stage 2 to 5 is
W(N) = WT(N) - W11(N) (6)
Every lot that enters the operation has to under go at least one cycle of screening. The other subsequent cycles until P will have its own probability. Modification the total cycle time of N lots is done by a combinational routing probability factor, rT whichisderived as
1
P l l T
l r r
P =
=
∑
(7)The total re-entrant probabilities will always be one, since the combinational routing probability is being averaged and thus the total cycle time is approximated and is derived as
WT*(N) = rT .W(N) + W11(N) (8)
4.6. Correction of the Total Cycle Time
The MVA method employed to analyze a non product form network. Iteration and modification by the combinational routing probabilities tend to create computation errors. This is due to the recursion of the iteration. The total cycle time values fluctuate around the actual values during the iteration. Since the combinational routing probability is an average value and by introducing it into the computation, the total cycle time tend be overestimated by adding another layer of
approximation. In order to solve this problem, the smoothing of the total cycle time performed. The
WT* (N) is corrected by using the moving average smoothing with moving span size, s. RWT(N) is know as the corrected total cycle time and is given by equation (9).
∑
+ − ==
N s N k*(k)
T
W
s
(N)
T
RW
11
(9)From the experimental results, the span size of 5 seems work properly to produce fairly accurate results.
4.7. Modification of the Total Cycle Time Due to Limited Borrowing Time
During processing of a defined cluster of lots, there is an allotted time period for the RS operation to be used. I call this the borrowing time. When the borrowing time is up then the job has to be stopped and the operation has to be returned. At times, the screening job is not completely done for the entire cluster and has to be continued the following day. When this happens, the total cycle time is affected and has to be modified further to consider the additional waiting time. If the lots are completed during the borrowing time in a single day then modification is not necessary. The modified total cycle time due to limited borrowing time is given by equation (10)
⎪⎩ ⎪ ⎨ ⎧ > > + = ≤ =
∑
= 0 ) ( ) ( 0 ) ( ) ( ) ( * 1 d or X N RW if y N RW d or X N RW if N RW N RW T d d d T T TT (10)
where RWT*(N) is the modified total cycle time due to limited borrowing time, X is the fixed borrowing time per day, yd is the waiting time needed to continue the next day and d is referred as day 1,2,3 and so on. The number of days (d) required to complete a cluster of lot is
⎥ ⎥ ⎦ ⎤ ⎢ ⎢ ⎣ ⎡ = X (N) T RW
d (11)
where d is an integer value.
5. COMPUTATIONAL EXPERIENCE AND RESULTS
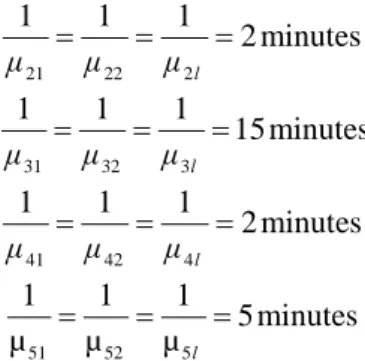
For experimenting with the re-entrant model, the input parameters are the service time of each stage obtained from a real reflow screening operation. The time taken by each stage to process the lots is measured over period of time and averaged. In addition, the borrowing time is set to 5 hours and the waiting time to continue processing on the following is fixed to 19 hours. They are subsequently applied into the analytical model to compute the total cycle time. The computation work is done using EXCEL spreadsheet which provides a fast and simple means of determining the total cycle time. Thus the mean processing times for jobs at each buffer by the respective stage are:
11 1
10 minutes µ =
21 22 2
1 1 1
2 minutes
l
µ =µ =µ =
31 32 3
1 1 1
15 minutes
l
µ =µ =µ = 41 42 4
1 1 1
2 minutes
l
µ = µ =µ =
51 52 5
1 1 1
5 minutes µ =µ =µl =
In order to validate the formulation, several tests were performed. In our validation test, the cycle time obtained by the proposed analytical model is compared with some existing real data obtained from the industry. Running extensive validation with large number of lots and different input scenarios is not possible as it involves in interfering with the workflow of the RS operation. In order to facilitate the study, available historical data having smaller amount of lots were collected for the validation work. This is sufficient to provide a good indication that the analytical model represents the actual RS operation to measure its cycle time. The differences are computed using equation 12.
% Value
al
Value al Value el Analytical Error
Absolute
lative 100
Re
Re mod
Re = − × (12)
Consider a cluster of incoming N number of lots requiring a maximum of P cycles of screening. If r1=0.3, r2=0.5 and r3=0.2, it means that 30% of the N number of lots require only 1 cycle of screening, 50% require 2 cycles of screening and 20% require 3 cycles of screening. Several combinations of routing probabilities are tested and compared with the available real data. Since in practice, most of the time the lots would require 3 cycles and below, thus for the validation purpose, P value is taken as 3 cycles and reported in this paper. Table 1 shows the various combinational routing probabilities tested in the analytical model.
Table 1. Combinational routing probabilities P r1 R2 r3 rT
3 1 0.00 0 0.33 0.77 0.23 0.01 0.41 0.60 0.30 0.10 0.50 0.24 0.71 0.05 0.60 0.01 0.88 0.11 0.70 0.40 0.07 0.53 0.71 0.24 0.21 0.54 0.77 0 0.50 0.50 0.83 0 0.40 0.60 0.87 0 0.38 0.62 0.87 0.10 0 0.90 0.93 0 0 1 1
The results confirm that the proposed analytical model could be utilized to closely model the RS operation with respect to mentioned performance measure as the error is less than 5% and gives a
good estimation. Since there is limited real data, the comparison was done up to 60 lots in a cluster. Table 2 illustrates the difference between the analytical and actual data values.
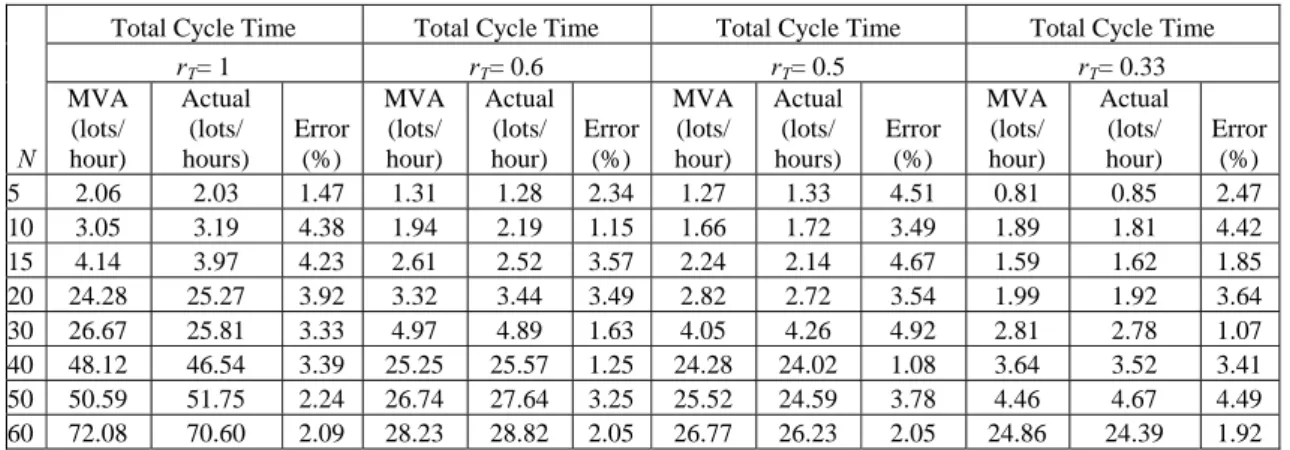
Table 2. Analytical results and real data for the total cycle time.
N
Total Cycle Time Total Cycle Time Total Cycle Time Total Cycle Time
rT= 1 rT= 0.6 rT= 0.5 rT= 0.33
MVA (lots/ hour)
Actual (lots/ hours)
Error (%)
MVA (lots/ hour)
Actual (lots/ hour)
Error (%)
MVA (lots/ hour)
Actual (lots/ hours)
Error (%)
MVA (lots/ hour)
Actual (lots/ hour)
Error (%)
5 2.06 2.03 1.47 1.31 1.28 2.34 1.27 1.33 4.51 0.81 0.85 2.47
10 3.05 3.19 4.38 1.94 2.19 1.15 1.66 1.72 3.49 1.89 1.81 4.42
15 4.14 3.97 4.23 2.61 2.52 3.57 2.24 2.14 4.67 1.59 1.62 1.85
20 24.28 25.27 3.92 3.32 3.44 3.49 2.82 2.72 3.54 1.99 1.92 3.64
30 26.67 25.81 3.33 4.97 4.89 1.63 4.05 4.26 4.92 2.81 2.78 1.07
40 48.12 46.54 3.39 25.25 25.57 1.25 24.28 24.02 1.08 3.64 3.52 3.41 50 50.59 51.75 2.24 26.74 27.64 3.25 25.52 24.59 3.78 4.46 4.67 4.49 60 72.08 70.60 2.09 28.23 28.82 2.05 26.77 26.23 2.05 24.86 24.39 1.92 Due to the limitation of the paper length, some of the details results are only presented and interested readers may obtain details from the author. From the observation as the cluster size gets larger the differences tend to become larger. Clusters having more than 60 lots will tend to have errors more than 5%. This is due to the averaging of the total cycle time and the iteration in the computation. Nevertheless, the analytical model provides an acceptable representation of the RS operation for operation managers to compute their cycle times as long as the number of lots is kept small (less than 60).
Two important characteristics are observed. Firstly, as the combinational routing probability becomes smaller the difference between the actual and analytical value are also small. This is because for lesser rT value it means that lesser number of lots are re-routed. Thus accumulation of the waiting time is reduced (lesser lots have long waiting time). Secondly, the sizes of the cluster tend to be bigger for smaller rT values. For example, if rT =0.33 then a cluster of 56 lots is required to complete within a day of 5 hours. On the contrary, if rT=1 then a cluster of 18 lots is required to complete within a day.
Table 3: Number of days required to complete the lots for various rT values. rT d=0 d=1 d=2
0.33 56 117 177 0.41 45 94 143 0.50 37 77 117 0.60 31 65 98 0.70 27 56 84 0.71 26 55 83 0.77 24 51 77 0.83 22 47 71 0.87 21 45 68 0.93 20 42 64 1 18 39 59
Table 3 shows the number of days required to complete the lots for various rT values. It is a useful table for operations manager to decide the size of the cluster so as to know how long (in days) it takes to complete the lots.
6. CONCLUSION
In this paper, an analytical model based on mean value analysis technique to compute the total cycle time of a 5 stage operation with re-entrant lines is developed. The research is conducted in a reflow screening operation in a semiconductor back end manufacturing industry. The results obtained by the analytical method reveals a close agreement with the real data with errors of less than 5% and this confirms that the analytical model could be used to approximate RS operation for the purpose of computing the total cycle time of a lot cluster with smaller amount of lots.
The contribution of this work is in three fold. The first is the extension of the MVA technique to include combinational routing probabilities and lot clustering method to represent the probabilistic nature of the re-entrant line. Secondly, since modification generates inevitable error due to the iteration, correction of the total cycle time is performed by employing a smoothing moving average technique. Thirdly, the model is further modified by considering the waiting times of the lots that have to be processed the following days due to the limited borrowing time.
This analytical model has some practical applications as many a times operation manager are faced with lots that could not be finished during the given (borrowing) time and has to be continued on the following days. Thus, the benefit of this model is that it provides a computational method to determine the total cycle time in the event of borrowing another operation.
REFERENCES
[1] Gross D., Harris C.M. (1998), Networks, Series and Cyclic Queue. Fundamentals of Queueing Theory; John Wiley, Sons, New York, 189-192.
[2] Halachimi I, Adan I.J.B.F., Wal J.V.D., Heesterbeek J.A.P., Beek P.V.(2000), The design of robotic diary barns using closed queueing networks; European Journal of Operational Research 124; 437-446. [3] Kumar S. (2007), Performance analysis of a probabilistic re-entrant line in an environmental stress
testing operation; Doctoral Thesis; Multimedia University.
[4] Kumar S., Omar M.K. (2005a), Stochastic re-entrant line modeling for an environmental stress testing in a semiconductor assembly industry; Applied Mathematics and Computation 173(1); 603-615. [5] Kumar S., Omar M.K. (2005b), Performance measure in a probabilistic reflow screening line using
mean value analysis; The AIUB Journal of Science and Engineering 4(1); 53-58.
[6] Little J.D.C. (1961), A proof for the queueing formula: L=λW; Operations Research 9; 383-387. [7] Muduli P.K., Yegulalp T.M. (1996), Modeling truck-shovel systems as multiple-chain closed queueing
networks; International Transactions in Operations Research 3(1); 89-98.
[8] Narahari Y., Khan L.M. (1995), Performance analysis of scheduling policies re-entrant manufacturing systems; Computers & Operations Research 23; 37-51.
[9] Narahari Y., Khan L.M. (1996), Modeling re-entrant manufacturing systems with inspections; Journal of Manufacturing Systems 15; 367-378.
[10] Narahari Y., Khan L.M. (1998), Asymptotic loss priority scheduling policies in closed re-entrant lines: A computational study; European Journal of Operational Research 110; 585-596.
[11] Park Y., Kim S., Jun C.H. (2002), Mean value analysis of re-entrant line with batch machines and multiclass jobs; Computers & Operations Research 29; 1009-1024.
[12] Park Y., Kim S., Jun C.H. (2006), Performance evaluation of re-entrant manufacturing system with production loss using mean value analysis; Computers & Operations Research 33; 1308-1325.
[13] Reiser M., Lavenberg S.S (1980), Mean-value analysis of closed multichain queueing networks; Journal of the Association for Computing Machinery 27(2); 313-322.