Exploring Myths about Manufactured Housing:
The Truth(s) behind One of America’s Least Understood
Financial Markets
Adam Rust
Imagine that you are in a conversation about the state of affordable housing.
Such a conversation might discuss the dilemmas faced by important elements of the workforce, the pressures of run-ups in pricing brought about by creative financing products, and the local constraints in metropolitan areas. Such a conversation might discuss the important actors in the field, from state housing finance agencies to nonprofit developers to policy advocates.
Nonetheless, such a conversation might not broach the appropriate role played by manufactured housing. In doing so, the discussion would ignore the largest source of unsubsidized housing in the country. In the South, the omission would be even more glaring. Regionally, manufactured housing accounted for forty percent of all housing sold in low-income home purchases in the 1990s.
Now realize that this imaginary viewpoint is largely the one that governs the approach that many non-profits take to affordable housing. As one developer in Kentucky is famously said to have observed, “Manufactured housing and community development--an oxymoron!”1
It does not stop with non-profits. Many state housing finance agencies, whose mission is to provide for the funds that fuel the creation of more affordable housing, systemically disqualify manufactured housing from their lending portfolios. Freddie Mac and Fannie Mae, whose charters mandate them to support access to financing, limit their participation in manufactured housing to that small portion of all manufactured homes that attain a legal designation as “real property.”
Nationwide, non-profits and housing cooperatives own about 25,000 manufactured homes.2 This is just a
fraction of the homes in the portfolios of community development groups. Another 30,000 mobile homes benefit from some kind of government-aided rental subsidy (Section 8).3 The vast majority of tenants in
parks are forced to finance their housing entirely through private suppliers.
The pre-existing perceptions that surround manufactured housing explain a lot about the actions of its important stakeholders in the development process.4
Scared off by the wave of foreclosures five years ago, many lenders approach the sector with fear. Frequent pejorative references to “trailer parks” in the lexicon of community development leaders,5 realtors, and
even planners6 create a chorus of NIMBYism about the
sector.
The industry continues to struggle. Only 130,748 manufactured homes were shipped in 2004, a steep fall from the 377,000 that were sold in 1998.7 There are a
number of reasons behind this decline. Those problems reflect less about the product itself and more about changes in factors surrounding manufactured housing. For one, less financing is available. Even FHA financing has declined. Furthermore, circumstantial evidence points to persistent erosion in the supply of mobile home parks in urban areas. At the same time, innovation in
With the subprime mortgage crisis and the associated fall in housing values, it is more important than ever
for affordable housing advocates to understand and educate the public about available low-cost housing
options. Adam Rust argues that manufactured housing may be an avenue to wealth building even in this
climate, but only if the truths are separated from the more familiar half-truths surrounding this housing
choice. Data from the Home Mortgage Disclosure Act provides a snapshot of manufactured housing’s
potential and pitfalls in different regions of the country under various financing scenarios.
mortgage products (adjustable rate mortgages, interest-only mortgages, etc.) has lowered some of the obstacles to owning stick-built homes. Over the last four years, shipments have averaged 126,000 units (excluding sales to FEMA), just a third of the 1998 figure.
The traditional trailer park is also affected. Though borrowers want the affordability offered by the sector, many are finding it beneficial to choose land-home over land-lease.8 Park owners, holding land that fewer and
fewer residents want to lease, entertain the idea of closing parks and selling the land.
Some community advocates say it is all bad – all abandoned trailer parks, all depreciating assets. These advocates choose to stick to building affordable site-built housing. In some places, though, community advocates preach a message of higher-quality buildings, better financing, and more wealth building options. Their message is well received by the industry. Some states are proposing effective solutions, notably those which are already taking effect in New Hampshire and Vermont. There are beacons elsewhere, too, in places as diverse as Kentucky and California.
Imagine what would happen if the supply of manufactured housing did not exist among our nation’s stock of homes. At the end of the 1990s, manufactured housing accounted for 2 in every 10 new housing starts.9
An estimated 8.7 million households,10 or more than
18.3 million residents,11 lived in mobile homes in 2006.
Without these homes, the crisis in affordable housing would be the most profound in the Southwest and Southeastern portion of the country. In 17 states, located mainly in these two regions, more than 10 percent of residents live in mobile homes.12 Rural areas, where a
lack of market-driven development means that the stock of single-family residential stick-built homes is aging, would be particularly impacted.
Even its ardent supporters admit that manufactured housing suffers from systemic problems. Financing costs, upon which much of this paper will focus, are generally higher. Those financing problems are only the beginning. Building new projects requires advocates to surmount hurdles that are not present, or at least not as significant, as those facing developers of single-family site-built home projects. Those problems include titling as personal property, zoning restrictions, and gaining access to land with viable infrastructure.
Market-created manufactured housing has done much to account for the increase in homeownership rates. Mobile homes have been the fastest growing housing sector since World War II, increasing in number from just 315,000 in 1950 to almost nine million by 2000.13
Yet without systemic reform of the sector, the financing for this housing may grow increasingly prohibitive. Advocates cannot ignore this need.
Why do so many people choose manufactured housing? Perhaps it is because the prices are low. From
1997 to 1999, manufactured housing accounted for 72 percent of all new unsubsidized homes in a price range that was affordable to low-income buyers. Manufactured housing costs almost half as much, on a per square foot basis, as do site-built homes.14 From 1997 to 2001,
the years in the Census Bureau’s most recent Resident Financial Survey, the median price of a manufactured home (both new and used) sold in the United States was $15,692. That eye-opening price is low for a number of reasons, specifically the inclusion of used homes in its calculation, the large share of homes that are sold in foreclosure or in distress sales, and the greater proportion of singlewides in existing stock.
With such crucial affordability in mind, this paper will attempt to ascertain the truth in some of the perceptions that exist about manufactured housing, with a particular emphasis on the financing barriers. To the extent that those perceptions hold back advocates from adopting this sector as a point of their efforts, they represent a discrete public policy obstacle. These perceptions are worth addressing for that reason. The most critical of these are that
• Borrowers are poor, white, and rural. • It’s a Southern thing.
• Manufactured housing is relegated to the least desirable neighborhoods.
• “Lenders will finance anyone” or, alternatively, “No one can get a loan for manufactured housing.”
• Borrowers must go to captive financing companies because they are unable to access full service banks.
• Manufactured housing loans are difficult to securitize.
• All manufactured home loans bear expensive interest rates.
• These properties do not retain equity.
This paper will use one source of primary data, the Home Mortgage Disclosure Act (HMDA) database, to test those perceptions.15 The data comes from mortgages made from
2004 to 2006. Some observations will be buttressed with data supplied by the US Census Bureau.
The most significant HMDA finding may be that the market varies widely throughout the country. It turns out that getting a loan on your manufactured home has a lot to do with where the home is located. A reader may react to that statement with little surprise because it is a well-known verity that location matters when considering the value of a home. As such, realtors often ascribe to a mantra about location, location, location. In the case of manufactured housing, we know that putting a home on land impacts its wealth-building trajectory.
country. In the West, in the Mountain States, and in Puerto Rico, access to financing is better than in the South and the Southwest. Those differences include the amount of financing available, the liquidity within the market, and the price associated with borrowing money. In these two regions, borrowers can access loans for higher amounts, relative to their income. Loans originated in these areas are more likely to be securitized, and they are less likely to bear a high-cost interest rate.
The differences surely reflect varieties in housing markets and in local regulations. Through the lens of HMDA, we can see the results that these contexts exert upon financing. To say that the market works smoothly is wrong, but to say that it is entirely broken may be an overstatement.
The First Myth: Borrowers are poor, white, and rural.
Our numbers show that manufactured housing borrowers come from all levels of income. While they do tend to be white in greater proportions than the rest of the mortgage market, there is some variety in racial and ethnic background. In contrast to the expectations of the First Myth, most live in metropolitan areas, although that finding may reflect how demographers label areas. Incomes are generally lower than median.
A discussion of the demographics of manufactured housing matters. Consider that many non-profits define their mission based on service to people from certain areas (the Piedmont, inner-city Baltimore, or rural Appalachia, for example), from certain ethnic, racial, or religious backgrounds, or in certain income strata. To the extent that the perceived population of residents in manufactured housing is narrowly defined, that perception may serve to gently push some non-profit groups away from manufactured housing because they do not realize that this housing type could be a viable path to homeownership for their constituents.
Loans to owner-occupied applicants show that the average borrower has a lower-than-average income. Still, borrowers are not destitute. The median income for owner-occupied manufactured housing loan originations was 79 percent of area median income.
From the perspective of the kinds of non-profits and government housing agencies that attempt to increase the supply of housing available to low- and moderate– income (LMI) populations, this finding about income is a virtue. It establishes the fact that manufactured housing purchases are indeed made by people well within the range of low- and moderate-income borrowers. Then again, this finding confirms existing expectations (as expressed by the First Myth), so merely knowing the relationship between LMI borrowers and manufactured housing is not enough to justify its acceptance as an appropriate target for public investment.
Borrowers are choosing higher-priced homes within
the universe of mobile homes, as well. The mean sales price of a manufactured home was just a bit over $23,900 in 2001.16 That figure includes both singlewides and
doublewides and both new and used homes. Compare those figures with data about sales of new homes. Figure 1 shows mean sales prices for new manufactured homes for the last ten years.
Figure 1. Sales of New Manufactured Homes, 1997-2006
Year Mean Price Singlewides Doublewides
1997 $39,800 $27,900 $48,100 1998 $41,600 $28,800 $49,800 1999 $43,300 $29,300 $51,100 2000 $46,400 $30,200 $53,600 2001 $48,900 $30,400 $55,200 2002 $51,300 $30,900 $56,100 2003 $54,900 $31,900 $59,700 2004 $58,200 $32,900 $63,400 2005 $62,600 $34,100 $68,700 2006 $64,200 $35,900 $71,400
Source: Census Bureau
Singlewides run in a general range from 900 to 1400 square feet. Doublewides, as their name implies, are twice as large. For the price, this square footage should demonstrate the claims of affordability within the sector.
This table shows the price of doublewides have grown by a bit more than five percent per year, while the price of singlewides have increased by about three percent per year. Over ten years, the discrepancy in average price has almost doubled. In spite of that pricing differential, doublewides have increased their share of the overall market. Whereas in 1997, they accounted for 59 percent of new financed manufactured home sales, by 2006, they made up almost 80 percent.
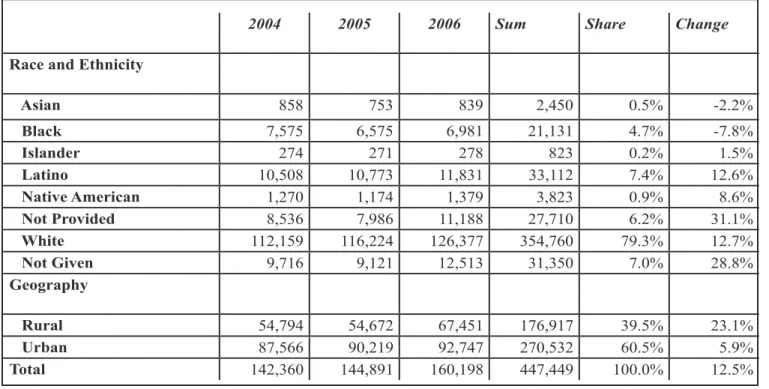
As Figure 2 reflects, individuals seeking loans for manufactured housing are concentrated within white Caucasian families. At the same time, as many as twenty percent of borrowers are either non-white or have not identified their racial status. This table provides descriptive statistics to characterize the assertion that borrowers are mainly white and rural. It appears that fewer African-American and Asian borrowers are seeking loans on manufactured housing. However, the number of white and Latino borrowers is increasing.
The Second Myth: It’s a Southern Thing.
Taken to an extreme, manufactured housing has attained an iconic place in a narrative about the South.
The same power of perception that held to our analysis of the first myth matters here as well. Housing preferences vary dramatically, not just in terms of neighborhood type, but also among regions of the country. Many parts of the South are unincorporated. That fact alone makes a difference because it predetermines the choices in infrastructure. There are also issues related to cultural preference. Developers desire to provide culturally desirable housing, if only because it makes good business sense. No one wants to build lofts along the border of Texas and Mexico, just as the concrete and corrugated metal colonias would not fit within the woods of Vermont. If a sense exists that manufactured housing is only sought after by dwellers in one part of the country, then this will likely thwart its adaptation elsewhere.
Certainly the numbers show that people all over the country, allowing for some variation in passion, feel compelled to take advantage of the possibilities in manufactured housing. Any manufacturer of mobile homes would quickly balk at the notion that their products only work in one region of the country. At Palm Harbor Homes, for example, the three leading states receiving shipments of homes are California, Arizona, and Florida.18 While manufactured housing is very
popular throughout the South, it also serves many in the West, in the Midwest, and in parts of the Southwest. It is less prevalent in the upper Midwest, in the Northeast, and in the Mid-Atlantic regions.
Beyond the distribution, regional markets vary
in their financing and loan sizes. In eight states, the frequency of high cost lending for loans on manufactured homes were lower than they were for loan applications on owner-occupied single-family housing in 2006. Those states are all in the Northeast or the West.
This is a surprising variation. More research should consider what makes the outcomes of financing in these states so different. One possibility is that the findings reflect the response of underwriters to differences in the collateral value of land. In HMDA, manufactured housing loan records can reflect either personal property loans or land-home packages with full real property status. With increasing frequency, manufactured housing is sold in the land-home package. Homes, of course, are made up of both land and a building. The land goes up in value while the building generally depreciates. The same is true for manufactured housing, in a very general sense. The value of land could even change the cost of lending for personal property mortgages in instances where renters have a long-term lease in an area with few alternatives for better housing values.
Unfortunately, more manufactured housing is being purchased in the high-cost loan areas than in the low-cost regions. The next table tracks the interest price and volume of manufactured housing originations.
When considering all property types as a whole, the Southeast is the region with the lowest average interest rate.19 The Rust Belt is the highest. This contradicts the
geographic variations in the price of interest rates among the larger body of manufactured housing loans.
This infers a more complicated truth than was originally suggested by the myth. Lenders will make
2004 2005 2006 Sum Share Change
Race and Ethnicity
Asian 858 753 839 2,450 0.5% -2.2%
Black 7,575 6,575 6,981 21,131 4.7% -7.8%
Islander 274 271 278 823 0.2% 1.5%
Latino 10,508 10,773 11,831 33,112 7.4% 12.6%
Native American 1,270 1,174 1,379 3,823 0.9% 8.6%
Not Provided 8,536 7,986 11,188 27,710 6.2% 31.1%
White 112,159 116,224 126,377 354,760 79.3% 12.7%
Not Given 9,716 9,121 12,513 31,350 7.0% 28.8%
Geography
Rural 54,794 54,672 67,451 176,917 39.5% 23.1%
Urban 87,566 90,219 92,747 270,532 60.5% 5.9%
Total 142,360 144,891 160,198 447,449 100.0% 12.5%
loans on manufactured housing. Nonetheless, they generally charge high rates of interest. These findings may show that lenders are relatively comfortable lending to borrowers that collateralize their borrowings with instruments whose values stem in greater part from land.
The loan amounts are dramatically different, as well. In the South, home purchase loans averaged $60,777 over the last three years. In the West, by contrast, home purchase loan amounts averaged $117,124.
While the frequency of high-cost loans is roughly the same for home rehabilitation, refinance, or home purchase loans, the variation in the incidence of high-cost loans is greatest among the purchases. In Nevada (16.7 percent), Washington (17.7 percent), Idaho (18.2 percent), and Puerto Rico (3.4 percent), fewer than one in five home purchase loans is high-cost.
The Third Myth: Manufactured housing
is relegated to the worst locations. You can find manufactured homes
only in the least desirable neighborhoods.
T h i s q u e s t i o n i s important for a number of reasons. First, because it interacts with the powerful voices of “not-in-my-back-yard” (NIMBY), notions about housing type among planners often conspire to influence zoning decisions. There is some empirical evidence to back up these voices: research in North Carolina found that property
Manufactured Homes Single Family Stick Built
Volume High Cost Volume High Cost Percent Difference
Utah 857 157 41,593 8,036 -1.0%
Indiana 3,090 906 58,325 17,750 -1.1%
Arizona 6,835 1,941 111,104 34,306 -2.5%
Florida 15,281 5,600 280,847 111,080 -2.9%
Idaho 1,228 223 18,566 3,980 -3.3%
Washington 5,949 1,070 72,541 17,080 -5.6%
Rhode Island 79 21 6,702 2,444 -9.9%
Nevada 2,115 367 54,208 16,512 -13.1%
Washington, DC 9 - 4,530 1,313 -29.0%
Only includes first lien purchase loans, 2006
Figure 3. Quantity and Cost of Mortgages in Eight appreciation increased more when homes were located farther from manufactured h o u s i n g .2 0 A t t h e
same time, planners who cede to these voices will potentially consign manufactured housing to second-best locations. Those are often ones with inferior access to infrastructure, transportation, services, and employment. Neighborhood quality is one of the defining characteristics of housing. It would be an unfortunate tradeoff, in the minds of most housing advocates, if efforts to increase homeownership compelled residents to move to lower-quality neighborhoods. Yet this is clearly a distinct possibility. Potentially, that could mean that low and middle income (LMI) housing purchase programs funnel the poor into neighborhoods with fewer amenities (parks, good schools, services, jobs), greater expenses for commuting, and more exposure to disamenities (crime, pollution, traffic, et al). Research that has addressed this question finds that LMI minorities experienced the greatest gains in neighborhood quality made by first time homeowners.21
There is not any data on the quality of neighborhoods in HMDA records. Still, HMDA data does tell us the median income in a census tract where a loan is originated. It includes statistics on the relative difference in the income of that neighborhood compared to the income of the surrounding metropolitan statistical area (MSA).
If we can impute that a higher than median income census tract is an approximation for a good neighborhood,
High Cost Not High Cost Total Percent High Cost
Mid Atlantic 940 1,668 2,608 36.0%
Midwest 36,203 45,010 81,213 44.6%
Northeast 11,557 18,169 29,726 38.9%
South 84,559 92,922 177,481 47.6%
Southwest 28,737 34,638 63,375 45.3%
West 22,818 49,935 72,753 31.4%
Total 192,449 248,977 441,426 43.6%
First lien home purchases, 2004 to 2006
than we can make some descriptive statements about neighborhood quality. I would argue that this is a fair assumption. The market is, if nothing else, an excellent diviner of value. All things being equal, more desirable residential locations should have higher priced homes and relatively higher income families inside their environs. What does the analysis suggest about the relationship between location of manufactured housing and neighborhood quality? The answer is that manufactured housing appears to be located in neighborhoods across the income spectrum. In the 649,401 originations from 2004 to 2006 that come with neighborhood income data, only about 16.8 percent were originated in census tracts with median household incomes at less than 80 percent of the MSA median. Approximately two in seven were originated in moderate income (from 80 percent to 100 percent) census tracts, however. Surprisingly, a fair amount of loans were for manufactured homes sited in the best neighborhoods. More than 11 percent, or about 72,292, were originated for homes in upper income census tracts.
Regional differences also weigh heavily in neighborhood locations for manufactured housing. The biggest regional differences are once again between the South and the West. The differences can be seen at both the upper and the lower ends of our indicators for neighborhood income. Loans in the South are much more likely to go to a home in a low-or moderate-income census tract compared to loans for a manufactured home in the West. They are also much less likely to go to a home in an upper-income census tract.
This finding should undermine the notion that manufactured housing is always in the worst location. It should also assuage fears that relying upon manufactured housing as the housing type of choice in some form of public investment scheme would relegate aid recipients to substandard housing locations.
The Fourth Myth: Lenders will finance anyone. Or, alternatively, No one can get a loan for manufactured housing.
These two myths appear to contradict each other. Nonetheless, some people subscribe to each viewpoint. Taken together, it means there is a lot of confusion about the availability of financing for manufactured housing. This may be a direct product of the murky system that surrounds lending in this sector. For years, people financed a mobile home with the same person who sold them their home. There was no fixed price on mobile homes, and financing was coupled with the sale. These memories support the first assumption.
On the other hand, a close look at the sector reveals that widespread changes have occurred since 2000. Significantly, some of the largest lenders and servicers of mobile home financing (entities like Greentree and Conseco) went bankrupt. No one stepped into the market
to take their place. Additionally, manufactured housing producer Fleetwood closed down its lending operation. But originations have actually increased in both 2005 and 2006 over previous years. Declination rates dropped eight percentage points in 2006 to just over 42 percent. Another point to consider is that lenders are most likely to finance borrowers whose risk is mitigated by government participation in the loan. Borrowers are almost twice as likely to be approved for an FHA loan (1.91 times) on manufactured housing than they are to be approved for a conventional loan, and more than four times as likely when the loan is through either the VA or the FSA. An upper income borrower is still much more likely (3.36 times more likely) to be turned down for a conventional loan to purchase a home than is a low-income borrower who uses the VA program.
The type of loan and the purpose of the loan should be a strong factor in the availability of financing.
Conventional home purchase loans were denied at a rate 1.91 times greater than loans in government programs (FHA, VA, FSA, RHS).
The difficulty in getting access to credit may have less to do with the type of housing utilized for collateral than with the type of borrower applying for a loan. At their own volition, financial institutions can attribute an explanation for a denial of credit in HMDA data. In the 946,380 instances when they did turn down a loan from 2004 to 2006, borrower credit was cited 27.6 percent of the time as the reason for the denial. Collateral, by comparison, was given as the explaining factor only 6.1
Figure 5. Manufactured Housing Shipments, 1959-2006
Reflects seasonally unadjusted data.
percent of the time, meaning that borrower credit is the basis for credit denial 4.3 times as often as insufficient collateral. In the case of home purchase applications for conventional loans, the difference was one of 11.1 times in magnitude. Credit was the leading cause of declination. Collateral was third, with borrower’s debt-to-income ratio cited only slightly more frequently.
In the West, borrowers are able to get home purchase loans on much higher amounts relative to their income. More than one in four home purchase originations in each of these areas goes for an amount that is more than three times the annual income of the individual applying for the loan. By contrast, only about nine percent of home purchase loans originated in the South and Southwestern states allow borrowers to finance that much relative to their incomes. Most borrow far less. In fact, more than 57 and 58 percent, respectively, borrow less than 150 percent of their annual income when they buy a home in those regions.
Some would say that the terms of credit and access to financing are expressions of the alternative system of credit that surrounds manufactured housing. This is a worthy assumption since manufactured housing financing developed within the framework of selling homes off a lot. The dealer holds a great deal of control within the market over both manufacturers and buyers.
The Fifth Myth: Because full service banks avoid the market, borrowers must go to captive financing companies, the kind linked to a manufacturer or a dealer.
This is not true. Banks and credit unions make loans on manufactured housing. In fact, Wells Fargo is the leading manufactured housing lender, by volume over the last three years, of all financial institutions. They are not a captive financing arm of a leading manufacturer. The top ten lenders, who together comprised 28 percent of all loans between 2004 and 2006, include just two financial subsidiaries: Vanderbilt (of Clayton, a manufactured home producer) and 21st Century Mortgage.
In the last few years, the mortgage operations of several manufacturers have closed. Fleetwood shuttered its lending unit in 2006. Champion provides short-term financing to dealers that carry its homes on their lots, but it does not make loans to consumers. Palm Harbor and Clayton, on the other hand, continue to provide loans.
Nevertheless, manufacturers approach financing with hesitation. The crisis that hit manufactured housing lending from the late 1990s through 2001 was a product of “loose credit standards for home-only loans,” according to one manufacturer.22 The subsequent reaction has
directly impacted sales volumes. Judging by the rate of declinations, credit is tight for loan applicants who want to buy manufactured homes.
One group of borrowers—the one defined by those seeking a chattel loan—is disproportionately more likely
to get a loan from the dealer. Chattel loans are ones made on personal property. Generally, that means homes not fixed to the ground by a permanent foundation. In practice, this is a pejorative description for loans with bad terms such as high interest rates, balloon payments, and predatory features. Getting a loan for a home classified as personal property from a bank is relatively difficult because of the lack of GSE demand (government-sponsored enterprises like Fannie Mae, Freddie Mac, and the twelve Federal HOME loan banks) for those loans on the secondary market. A greater percentage of personal property loans are made through consumer finance and dealers financing companies.23
The Sixth Myth: Manufactured housing loans are difficult to securitize.
The underlying assumption of this statement is that lenders resist making these loans, in part because the lack of a secondary market poses a threat to lender’s liquidity. Yet the statement is not entirely true. There is a flourishing secondary market for mortgages in the FHA, VA, and FSA programs. In the last three years, more than 80 percent of mortgages in each of those programs were sold on the secondary market.
The secondary market treats conventional loans differently, however. Many were made into asset and mortgage-backed securities. Of the ones that were securitized (about 26 percent), slightly more than half had a high cost interest rate. The conventional market is big, though. It accounts for slightly more than 85 percent of all originations.
Within the conventional market, about fourteen percent of loans by volume are extended to LMI borrowers. A greater percentage (about 39 percent) of loans go to borrowers in LMI tracts.
This secondary market for conventional manufactured housing loans has become relatively oligopsonistic. Five out of six manufactured housing loans are purchased by just ten lenders. Such an arrangement suggests that the buyers have a lot of market power over the lenders who originate loans on manufactured housing.
In many ways, it is a case of layers of government intervention supporting some loans, but very little government intervention supporting others. More than 73 percent of all FHA, VA, FSA, and RHS manufactured housing loans that are purchased on the secondary market are bought by Ginnie Mae.
Freddie Mac and Fannie Mae, by purchasing mortgages from originators, provide liquidity for lenders. But they buy manufactured housing loans in limited circumstances.
Mac, respectively, bear low cost interest rates.
Even so, Fannie and Freddie’s involvement is limited and only provides securitization to slightly less than one in every eight manufactured housing loans originated in the United States (11.96 percent). Because the rest of the buyers tend to avoid conventional loans, Fannie Mae and Freddie Mac account for almost half (45.3 percent) of the securitizations for conventional loans.
These government sponsored loans are also more likely to be priced at a prime price. It is hard to say if the liquidity creates the pricing, or if the pricing leads to the liquidity. Nevertheless, there is a dramatic difference between the interest rates on GSE loans and those in the rest of market. From 2004 to 2006, less than 6 percent of these loans bore a high cost interest rate.
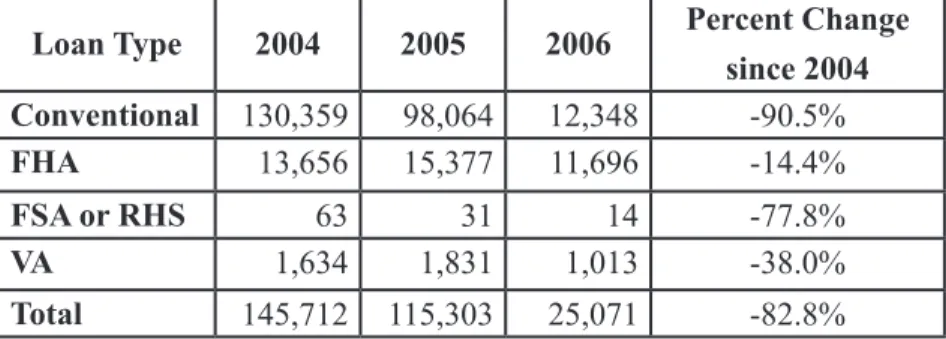
Demand for loans on the secondary market dropped off in 2006. Figure 7 shows securitizations reported in HMDA data for each of the three years 2004 to 2006. All loan types are included.
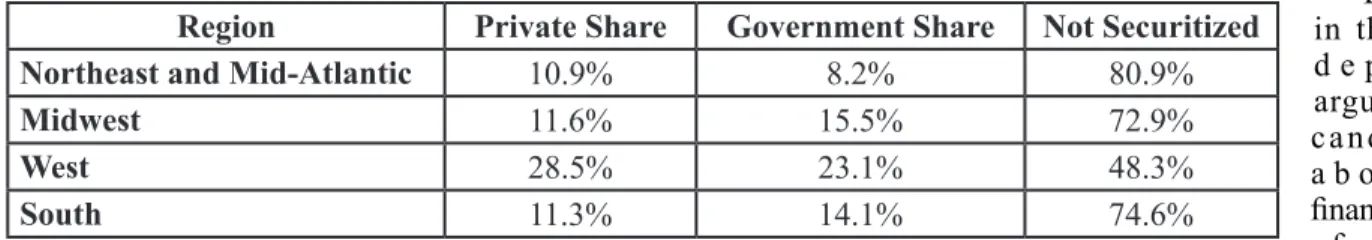
The markets most affected are the ones for conventional loans in the Midwest, the South, and the Southwest. Purchases for those loans fell off by 93 percent from 2004 to 2006. Of the ten states where Fannie and Freddie had the smallest market share in 2006, all but Georgia and Louisiana are in the Northeast. By contrast, the states where Fannie and Freddie had the highest market share in 2006 were all west of Wyoming, with the exception of the District of Columbia. Figure 8 shows the variation in eventual securitization of loans originated on manufactured housing in 2006. Notice how the private market’s interest in buying loans corresponds to the interest exhibited by the GSEs. The GSEs focus their purchases on non-high-cost loans. In 2006, for example, only 7.4 percent of loans purchased by one of the four GSEs were high cost. The GSEs bought more than 55 percent of all
high-cost loans that were securitized in 2006.
W h o b u y s high-cost debt? The answer is that as there is little liquidity for those loans, more than 87 percent of all high-cost loans are not purchased at all. Insurance companies, who use the cash flows from these loans to provide revenue, are more willing to take on the risk inherent in high-cost loans.
In 2006, they bought 4,960 high-cost loans – about 36 percent of all high-cost loans that were successfully securitized.25
The Seventh Myth: All loans are high cost.
One of the chief obstacles to integrating manufactured housing within the range of suitable products for community development is the perception of its cost of financing. Nonprofit advocates contend that any development with manufactured housing would fail to build wealth for its clients because they would inevitably take out bad loans. This is closely linked to another perception—that manufactured housing depreciates in value. We cannot ascertain the truth of the latter statement with HMDA data. Nonetheless, HMDA does provide an excellent vantage point for assessing the primary claim that all manufactured housing lending is high cost.
The findings suggest that the answer is not that simple. About half of all conventional (50.2 percent) manufactured housing loans bear high interest rates.
• Conventional owner-occupant loans are more likely to bear a high-cost interest rate (frequency equals 52.1 percent) compared to conventional non-owner-occupied originations (frequency equals 35.1 percent).
• Only 6.7 percent of FHA loans bear a high-cost rate. The benefits of FHA mortgages are enjoyed by owner-occupants. Over 99.4 percent of all FHA originations are owner-occupied. These mortgages come with a down-payment requirement.
There are a lot of very bad loans made on manufactured housing. Defining a bad loan is difficult, but there is one agreed upon benchmark – the HOEPA label. The Home Ownership and Equity Protection Act (HOEPA) of 1994
Freddie Mac Fannie Mae
Term 15, 20 and 30 10, 15, 20, and 30 year
ARMs Yes: 7/1, 10/1 Yes
Fixed-rate Yes Yes
Personal Property No No
Pre-HUD Code No No
Cash-out Refinance Yes Yes, up to 20-year-term at 65% LTV
Max LTV 95% 95%
Loan Type Conventional Conventional, FHA (both fixed and ARM)
Appraisal Required Required
Lien First lien First lien
Fee for Buying MH debt 50 basis points 50 basis points
established a system for safeguards on loans that would otherwise hold the greatest potential for stripping wealth from borrowers. The act constrains lenders from freely originating these loans by requiring extra disclosures and additional strictures. HOEPA loans are generally very high cost, with prices that are more than 800 basis points above comparably termed Treasury securities.
There were 8,252 HOEPA loans made on manufactured housing from 2004 to 2006. That is approximately one percent of all originations. The average interest rate for loans in this group exceeded comparably termed Treasuries by 982 basis points.
Although earlier mentioned differences in interest rate cost among regions would lead us to suspect to find this in the South and Southwest, HOEPA loans are more often situated elsewhere. The problem is largely confined to states in the Midwest, where just slightly less than one in forty originations (2.18 percent) is identified as a HOEPA loan. An origination in the Midwest is 2.76 times more likely to be rated as a HOEPA loan than are loans in the rest of the country. It is a rate that outpaces the West by four times and is even double the rate within the Southern United States. Almost one in eight of all manufactured housing HOEPA loans originated in the United States was made to a borrower from Michigan.
None of these HOEPA loans went for home purchase loans. All were confined to either refinance or home rehabilitation loans. More than 4 percent (4.2) of loans made for home rehab on a manufactured home were identified as HOEPA loans. More than 11 percent of rehab loans in Alabama and 20.4 percent in Michigan were HOEPA.
The Eighth Myth: Manufactured homes do not retain equity.
This myth may be the most problematic of all, as it is leveled as a critique that keeps nonprofits and public investment out of this sector. If it is true, their reluctance is warranted, and advocating for this sector would be a second-best path to homeownership. Furthermore, many policy decisions hang on a subscription to this belief, so it deserves close scrutiny through the following questions: Does manufactured housing retain its equity? If so, under
what conditions? What are the implications for home refinance, repair, and wealth building strategies?
This myth impacts the ability of borrowers to get loans on used homes. Homes will not retain equity unless demand exists to buy them, and one of the biggest problems with the market for making loans on manufactured housing is the trouble with reselling a manufactured home. But that demand is also a product of the availability of loans to buy used homes. The same forces dictate the likelihood that lenders will be willing to lend for repairs on used homes.25
This question addresses not just our immediate concerns about availability of capital for these finance products; it goes further. It lets us gauge the relative truth of one of the lasting critiques about manufactured housing. It is said that manufactured housing “does not retain equity,” and this is a widely held perception. It has also become a critique that many see as necessary to resolve before public investment can be directed into this sector.
The equity problem stems from the large role that dealers play in providing financing on the sale of manufactured homes. While borrowers can get credit to buy a new home on a lot, can they also get credit to refinance their home once it has been sited on a lot? HMDA data is not detailed enough to give us a full picture, but it does show clearly that refinancing mobile homes is a possibility.
In a curious development, refinance loans have become an entry point for some cautious lenders. For a lender, participating in refinance mortgages represents an opportunity that avoids much of the assumed downward trajectory in price. One credit union in North Carolina will not provide home purchase loans but will make refinance loans on real property homes that are at least one year old. This means that homes can be underwritten at loan-to-value ratios that capture the “off-the-lot” depreciation problem.
With that on-the-ground context, the loan sizes on refinance loans tell us a very optimistic story. While the mean loan size for a home purchase was approximately $70,349 from 2004 to 2006, the mean loan size on a refinance was higher. Refinances averaged $77,639. Prices had a lower than average bias, but median refinances were still $69,000 compared to a median of just $59,000 for home purchases.
People do not just need capital to buy homes. They also need to be able to access credit to improve their homes. Moreover, the ability of borrowers to continue to draw financing on their used homes tells us something about their performance in the market place. Borrowers made 62,783 home rehabilitation loans on manufactured homes in the three year period from 2004 to 2006. Each
Loan Type 2004 2005 2006 Percent Change since 2004 Conventional 130,359 98,064 12,348 -90.5%
FHA 13,656 15,377 11,696 -14.4%
FSA or RHS 63 31 14 -77.8%
VA 1,634 1,831 1,013 -38.0%
Total 145,712 115,303 25,071 -82.8%
subsequent year witnessed a slight uptick in the number of loans. Almost all rehab loans were conventional mortgages. The median loan size was $23,000.
North Carolina is one of many states with a housing finance agency that will not provide loans for residents in manufactured housing to rehabilitate their properties. In general, it appears that financing is available for borrowers to fix up their manufactured homes from private lenders, but the loans for that opportunity come with the most onerous interest rates. Home rehab loans are the most likely to be labeled by the Federal Trade Commission as HOEPA loans and thus require the additional levels of regulation associated with those loans.
Geography plays a part too. Getting a loan to fix up your home is more difficult in the South and the Southwest. The same regional disparity that exists in the cost of lending also emerges here in terms of access to financing for home rehabilitation. Of the 27 states where home rehab loans made up a greater share of all owner-occupied loans than the mean (8.4 percent), only five were from the South or Southwest. None of the Southern or Southwestern states ranked in the top ten states in terms of market share made up by home rehab loans.
Home rehab loans defy one of the expectations for the larger real estate market in that owner-occupants normally pay a higher interest rate for these loans than do non-owner occupants. Almost two of every three home rehab loans in a first lien position had a high-cost interest rate from 2004 to 2006 (63.4 percent), whereas just 46.1 percent of similar loans taken out by non-owner occupants had a high-cost interest rate. When they do get a high-cost loan, irrespective of lien position, owner-occupants paid an interest rate that was, on average, about 61 basis points higher than non-owner occupants paid on their high cost loans.
Some types of loans are especially hard to securitize. Loans to rehabilitate manufactured housing find little demand on the secondary market. Less than one in ten (9.51 percent) are securitized. Freddie Mac and Fannie and Ginnie Mae together only purchased 1,169 rehab loans in those three years.
The larger lesson about loans for refinance or repair muddies the absolute nature of the commonly held belief that manufactured homes do not retain value. It appears that they can continue to be viable as collateral after their
original sale. Left unsaid in the equity-d e p l e t i n g argument is a candid truth a b o u t t h e financial returns of site-built housing. While it is true that owning a home presents a family with a great opportunity to build wealth, a more exact statement would be that owning land confers the chance to reap financial gains. Land goes up in value, but in most cases, the structure of the house increases little. The structure also imposes maintenance costs. It is unfair to compare a landless mobile home with a stick-built home and land.
Policy makers and advocates alike should seek to introduce manufactured housing into ownership systems that give low-income residents the benefits of land. The “land-home package,” through fee simple ownership, is the simplest and most common example. Other less well-known opportunities also exist. Housing cooperatives and non-profit ownership are two examples which have only begun to be explored.
Certainly, community development lenders that gingerly limit their lending to refinances on used homes may ultimately protect their interests. Manufactured housing, at worse, compares to other investments that lose value slowly.
Conclusion
Policy makers working in areas that affect manufactured housing must recognize the continued persistence of problems in the market. Included here are non-profit developers, but also bank underwriters, land-use planners, and state housing finance agencies. All of these groups, which can promote or hinder the momentum of this sector, should see that their actions can affirm the potential of manufactured housing as a point of access for wealth building for low-income people.
Clearly there is great variety among states and regions in the United States in terms of the type of financing issued for borrowers. Borrowers in the West and in the Northeast are really not under the same onerous forces that exist and undermine borrowers in the South and Southwest. The market itself is functioning well.
Those outcomes are likely a product not just of factors within “the market,” such as demand for alternative types of housing, the price of land, and the health of the economy, but also of the variety of legal frameworks that surround manufactured housing. Some states will confer real property status upon manufactured housing more willingly than others. For example, in California, manufactured home owners in land-lease parks can get real property loans on homes with
long-Region Private Share Government Share Not Securitized Northeast and Mid-Atlantic 10.9% 8.2% 80.9%
Midwest 11.6% 15.5% 72.9%
West 28.5% 23.1% 48.3%
South 11.3% 14.1% 74.6%
term leases. AARP and the National Consumer Law Center have put together a survey of laws governing residents in manufactured housing parks. Laws such as right-of-first refusal, when coupled with frameworks that give residents access to financing to buy parks, can make a big difference in security for people who live in manufactured housing communities.
This paper proposes a new direction for non-profits. The time is right to consider a policy of “engagement” with manufactured housing and with segments of the industry itself. The underlying features of low-cost housing built on dense lots, both in infill settings and in traditional parks, have retained if not increased their popularity. The underlying fundamental quality of the housing structure itself has improved. Good relationships can be developed with manufacturers.
Many problems exist, as outlined in here. Yet all too often, those problems are circumstantial to the manufactured housing product itself. Financing, zoning, and statutes defining real property emerge as turning points where opportunities will be created.
The institutional answers to shepherd a new direction are just now being created. They include not just cooperative and non-profit ownership, but also fee simple housing arrangements. The existing framework of actors that make affordable housing production possible in the United States (state housing finance agencies, the GSEs, non-profit developers, and tax credit-incentivized financial institutions) can extend their missions to include the housing needs of manufactured housing residents.
Although the industry will not welcome the medicine of engagement, it may benefit greatly from the cure. Manufactured housing witnessed a renaissance in sales volume 30 years ago following the development of HUD-code standards. In a new era, with advocate engagement, demand for affordable housing can be met with manufactured homes.
Endnotes
1 Retsinas, Nicolas and Eric Belsky. 2002.
“Examining the Unexamined Goal.” In Low-Income Homeownership: Examining The Unexamined Goal. Ed. by Nicolas Retsinas and Eric Belsky. Brookings Institution Press and Joint Center for Housing Studies at Harvard University. 1-14
2 Genz, Richard. 2001. “Why Advocates Need to
Rethink Manufactured Housing.” Housing Policy Debate. Vol. 12(2):393-414
3 US Department of Housing and Urban Development
and the US Census Bureau. 2001. Residential Finance Survey. Table 9-1: Mortgage Status, Mobile Home Properties
4 US Department of Housing and Urban Development
and the US Census Bureau. 2001. Residential Finance Survey. Table 9-1: Mortgage Status, Mobile Home
Properties
5 Beamish, Julia O., Rosemary Goss, Jorge Atiles,
and Youngjoo Kim. 2001. “Not a Trailer Anymore: Perceptions of Manufactured Housing.” Housing Policy Debate. Vol. 12(2):373-392. Fannie Mae Foundation
6 Collins, Michael. 2001. “Manufacturing
Affordability.” Bright Ideas. Summer. 64-5
7 Wubneh, M., Shen. G. 2004. “The Impact of
Manufactured Housing on Adjacent Residential Property Values: A GIS Approach Based on Three North Carolina Counties.” Review of Urban & Regional Development Studies. 16(1):56-73
8 Champion Enterprises. Form 10-K Fiscal Year End
December 30,2006. Auburn Hills, Michigan.
9 Owens, Joseph. 1996. “Who’s Buying Manufactured
Homes?” Urban Land 55(1):21-3
10 Beamish, Julia O., Rosemary Goss, Jorge Atiles,
and Youngjoo Kim. 2001. “Not a Trailer Anymore: Perceptions of Manufactured Housing.” Housing Policy Debate. Vol. 12(2):373-392. Fannie Mae Foundation
11 US Census Bureau, 2006 American Community
Survey. B25024. Units in Structure – Universe: Housing Units
12 US Census Bureau, 2006 American Community
Survey. B25033. Total Population in Occupied Housing Units by Tenure of Units in Structure – Universe: Total Population in Occupied Housing Units
13 US Census Bureau, 2004 American Community
Survey. R2501. Percent of Housing Units that Are Mobile Homes: 2004 Universe: Total Housing Units.
14 Bennefield, Robert and Robert Bonnette. 2003.
Structural and Occupancy Characteristics of Housing: 2000. Census 2000 Brief c2kbr-32. US Census Bureau
15 It is important to note that only a portion of
manufactured homes are acquired with financing of any kind. From 1997 to 2001, about 1.2 million mobile homes changed hands. During that time, only 293,000 of those properties were purchased with debt. A small percentage of the homes were converted from nonresidential use, but many others were transferred for cash. US Department of Housing and Urban Development and the US Census Bureau. 2001. Residential Finance Survey. Table 9-1: Mortgage Status, Mobile Home Properties
16 US Department of Housing and Urban Development
and the US Census Bureau. 2001. Residential Finance Survey. Table 9-1: Mortgage Status, Mobile Home Properties
17 Carter, C., O. Williamson, E. DeArmond, and J.
Sheldon. 2004. “Manufactured Housing Community Tenants: Shifting the Balance of Power. A Model State Statute.” Revised Edition. AARP Public Policy Institute. Washington, DC.
Commission Form EX.99-1. “Palm Harbor Homes, Inc. reports Third Quarter Fiscal 2008 Results.” Jan. 22, 2008. http://sec.gov/Archives/edgar/data/923473/0 00119312508009774/dex991.htm
19 This paper adopts the definition of high cost loans
utilized within the HMDA LAR format. The FFIEC provides a discrete basis point description of the price premium on all loans priced at or above 300 basis points over comparable term treasury notes for first lien position loans and 500 basis points over comparably termed Treasury notes for second lien position loans. When a loan is above those thresholds, HMDA reports the interest rate premium to the single basis point. It is not exactly accurate to use high cost and subprime interchangeably. High cost loans often cost more than subprime loans.
20 Avery, Robert, K. Brevoort, and G. Canner. “Higher
Priced Home Lending and the 2005 HMDA Data. Federal Reserve Bulletin. Sept. 18, 2006
21 Wubneh, M., Shen. G. 2004. “The Impact of
Manufactured Housing on Adjacent Residential Property Values: A GIS Approach Based on Three
North Carolina Counties.” Review of Urban & Regional Development Studies. 16(1):56-73
22 Reid, Carolina. 2004. “Achieving the
American Dream? A Longitudinal Analysis of the Homeownership Experiences of Low-Income Households.” Dissertation Discussion Paper. University of Wisconsin
23 Champion Corporation. Securities and Exchange
Commission Form 10-k. 2006
24 Strauss, Leslie R. 1998. “Credit and Capital Needs
for Affordable Rural Housing,” in
Housing in Rural America: Building Affordable and Inclusive Communities, Joseph N.
Belden and Robert J. Wiener, eds. Thousand Oaks, CA: Sage Publications, 125–136
25 There are some data constraints in our ability
to determine the cost of obtaining loans on used
manufactured homes. We do not see the age of homes in HMDA data. We do know that both refinance and home rehabilitation loans are made exclusively for used homes.