Development and implementation of a Monte Carlo
frame work for evaluation of patient specific
out- of - field organ equivalent dose
INTRODUCTION
In radiotherapy, the dose absorbed outside a radiation treatment ield, i.e. the peripheral dose (PD), is believed to increase the risk of stochastic effects and the severity of deterministic effects
(1). The sources of PD are scattered radiation
inside the irradiated volume in patient's body and scattered and leakage radiation originated
from accelerator head (2). For each beam energy,
PD at each point outside the ield depends on the
ield size and the distance from the ield edge (2, 3). Several studies investigated out-of- ield organ equivalent dose (OED). Moreover, the risk of secondary cancer incidence may also differ for
different treatment methods, such as
conventional, 3D conformal (3D-CRT) and
intensity-modulated radiation therapy (IMRT) (2,
4-8). Some studies have reported higher PD
values for IMRT plans, due to higher number of ields and longer treatment times which result in
higher leakage radiation levels (2, 9), while others
M. Atarod
1*,P. Shokrani
2, A. Amouheidari
31
Department of Medical Physics and Radiology, Shahrekord University of Medical Sciences, Shahrekord, Iran 2
Department of Medical Physics, Isfahan University of Medical Sciences, Isfahan, Iran 3
Radiotherapy Department, Milad Hospital, Isfahan, Iran
ABSTRACT
Background: The aim of this study was to develop and implement a Monte Carlo framework for evalua on of pa ent specific out-of-field organ equivalent dose (OED). Materials and Methods: Dose calcula ons were performed using a Monte Carlo-based model of Oncor linac and tomographic phantoms. Monte Carlo simula ons were performed using EGSnrc user codes. Dose measurements were performed using radiochromic films. Furthermore, the applicability of this framework was examined for a 3D conformal radiotherapy of breast. Results: Commissioning of the beam model was done by comparing the measured and calculated out-of-field dose values of several points in the physical and tomographic phantoms, respec vely. The maximum percentage difference was 17%, which was smaller than 30% acceptance criteria for Monte Carlo modeling. The maximum sta s cal uncertainty in out -of-field dose calcula on was 23%. Organ equivalent doses for out of field organs in 3D conformal radiotherapy of le1 breast varied from 2.4 cGy for right kidney to 134.6 cGy for the le1 humeral head. Conclusion: The framework developed in this research is a valuable tool for calcula ng peripheral dose and out-of field pa ent specific OEDs, the quan es needed for calcula ng risk of secondary cancer induc on as a result of radiotherapy. This code can be used as a pa ent specific treatment plan op miza on tool in order to select a treatment plan with the lowest risk of secondary cancer induc on.
Keywords: Out-of-field organ doses, secondary cancer risk, tomographic models, Monte Carlo simulations.
*Corresponding authors:
Dr. Maryam Atarod,
Fax: +98 381 3346721
E-mail:
[email protected] Revised: April 2016
Accepted: July 2016
Int. J. Radiat. Res., July 2017; 15(3): 289-294
► Original article
DOI: 10.18869/acadpub.ijrr.15.3.289
have shown comparable PD values for IMRT and 3D-CRT plans using multi leaf collimators (MLC) (6, 7). Monte Carlo (MC) studies have also indicat-ed that linac makes and models beam energy and collimator rotation, moreover, the utilized patient models may affect the results of
calculat-ing out of ield OED (2). Therefore, an ideal
frame-work for selecting an optimized treatment plan with minimum risk of secondary cancer induc-tion must include out-of- ield head scatter and leakage radiation for planned energy, ield size and collimator/MLC speci ications as well as out -of- ield organ speci ications of patients. The ac-curacy of treatment planning system (TPS) cal-culations, beyond the treatment border, is inade-quate and out-of- ield dose must be evaluated by either direct measurements or MC calculations
(10). The aim of this study was to describe the
required technical details for developing a MC framework to estimate PD. The developed framework was implemented to calculate OED for out-of- ield organs in a 3D-CRT of breast.
MATERIALS AND METHODS
To develop a Monte Carlo-based frameworkfor calculating out-of- ield organ dose the followings were employed: Monte Carlo model
of a linac head developed using BEAMnrc user
code of EGSnrc (11), patient's tomographic
phan-toms developed using patient’s CT images and
CTCREATE(12) user code of EGSnrc, and patient's
treatment plan data exported from TPS.
MC modeling of treatment radiation ields
The contribution of scattered and leakage radiation to PD was calculated using a previous-ly developed and validated MC model of a
Sie-mens Oncor linac (3). This model includes a 6 MV
photon beam-line, x-ray jaws and multileaf collimator (MLC) and the shielding components
of the linac head. The phase space data is scored at the level of Y jaws, before beam enters the collimator system, using BEAMnrc’s source
module no. 19 (11). This data was then used
repeatedly as the source term to simulate planned treatment radiation ields, BEAMnrc’s source module no. 21, using patient’s treatment
ield data exported from TPS. While using phase space ile as a source, the speci ic number of each component module in linac model or the LATCH value was passed on and the number of LATCH bits was identical for both simulations
(11). Simulation of treatment ield was done using
the JAWS and MLC component modules. The
position of each leaf in the MLC bank (XMLC)was
calculated using the following mini ication
factor: , where X isocenter is
the leaf position projected at the isocenter, SCD is source collimator distance and SAD is source axis distance.
Construction of computed tomographic phantom
For each patient, a tomographic phantom was constructed using CTCREATE user code of EGSnrc by converting patient's CT images from
DICOM format into voxelized geometry. The input parameters of CTCREATE were 2mm
phantom voxel size, 4 material for the CT ramp and CT ramp parameters (for converting CT number into material densities (ρ)).
CT number-ρ calibration curve was
constructed for our CT scanner (Siemens,
SOMA-TOM Sensation) using an anthropomorphic torso phantom (QDV phantom, LinaTech) made
of bone (ρ=1.4g/cm3), lung (ρ=0.29g/cm3), and
soft tissue equivalent material (ρ=1.04g/cm3).
Integrating linac models and computational phantoms
MC dose calculations in patient tomographic model were done using DOSXYZnrc user code of EGSnrc by incorporating the simulated patient treatment plan model. In order to integrate the two models, the coordinate system used in CT DICOM data was converted to the system used in
DOSXYZnrc code using equations 1 to 3 (13).
Beam arrangements in DOSXYZnrc are described
by θ, φ, and φcol, relative to X, Y, and Z axes
according to the gantry, couch and collimator
angles (12). The θG, θT, and θC are the angles of
gantry, table and collimator, respectively.
(1)
(2) (3)
290
Commissioning the computational framework
Commissioning of the beam model was done by comparing the measured and calculated dose distributions along beam central axis and in
out-of- ield regions (14). The developed
framework was also commissioned for clinical applications in a tomographic phantom designed using CT images of the phantom. The phantom
head was irradiated by a 6MV 10×10 cm2 photon
ield and dose calculations were performed in out-of- ield lung and bone regions. To verify the accuracy of calculated doses, ilm dosimetry was
performed using radiochromic ilms
(GafChromic, EBT2, International Specialty Products, Inc., Wayne, New Jersey), calibrated according to Devic ilm calibration procedure
(15). A Microteck scanner with scan resolution of
127 dpi (0.2 mm / pixel), and an in-house MATLAB routine was used for image processing. The percentage difference values
Were calculated to compare with the acceptance
criteria of 30% for model validation (18).
Calibration of the linac model
In order to calculate the total dose for a multiple ield treatment plan, contribution of
each ield is considered by MC absolute
dosimetry or virtual linac calibration which determines the relationship between number of
incident particle luence and MU (16). A
calibra-tion run was performed to calculate the incident
particle luence per MU for a 10×10cm2 ield size,
i.e. using the
physi-cal linac output physi-calibration conditions: SAD
setup, 10cm depth and 10×10 cm2ield size.
is the absolute dose calibration
factor and is dose per
particle luence deposited in each voxel located at x,y and z in the calibration condition. The "cal"
and "abs" labels, refer to values acquired in calibration conditions and absolute dose values
respectively. Normalized dose values were
reported in DOSXYZnrc output file (.3ddose).
For other ield sizes, (x × y), relative output
factor (ROF) was calculated in BEAMnrc user code: the monitor chamber was labeled as a dose scoring region and the dose delivered to the chamber was calculated in two separate simulations, irst due to the beam entering from
above and then due to the particles
backscattered from the collimators
The values with "ch" subscript, were scored in monitor chamber of model. For each ield size, ROF was calculated using the equation (4):
(4) Finally, for each ield size, the absolute dose in cGy in each voxel located at x, y and z was cal-culated using the equation (5):
(5)
Implementation of Monte Carlo framework
Patient treatment plan speci ications for the
medial and lateral tangential breast ields
including gantry angles (124 and 299 degrees), Y jaws and MLCs positions, monitor unit (MU) (116 and 90), and normalization depth (7.8 cm) were exported from TPS to the developed MC code. Then the same plan was simulated using the tomographic model of patient. Figure 1 shows the simulated MLC con iguration for the medial and lateral tangential breast ields using the exported plan data from TPS.
The calculated dose matrix was used to calculate the OEDs using the equation (6):
(6)
291
Figure 1. The simulated MLC configura on for the medial and lateral tangen al breast fields using the exported plan data
from TPS.
Di is the calculated absorbed dose in each
volume element Vi of the organ taken from
organ’s dose volume data (DVH), and the sum is taken over N dose calculation points. DVH data for each organ was calculated by importing the MC calculated dose matrix to a research TPS (computational environment for radiotherapy
research (CERR)) (17).
RESULTS
The irst step in constructing a tomographic phantom was to de ine a conversion ramp. Table 1 shows the conversion ramp used to convert patient’s CT images from DICOM into voxelized format.
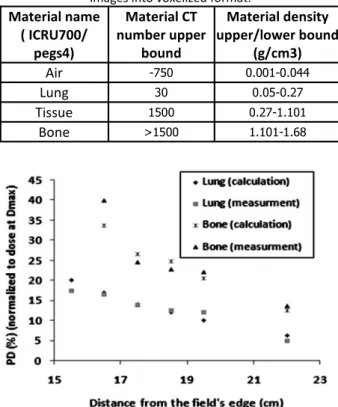
The result of model validation, shown in igure 2, compares calculated and measured relative PD values as a function of distance from the edge of the ield. For both sets of data, PD values were obtained using the same treatment plan speci ications and were normalized to the
dose at the depth of maximum dose (dmax) along
central axis of the beam. The comparisons were made between calculated and measured
out-of-ield dose values in several points in
tomographic and physical phantoms,
respectively. The maximum percentage
difference calculated for out-of- ield was17%.
TPS derived coordinates for medial and lateral breast ield were as follows: collimator
angle (θC)= 0, table angle (θT) =0 for both ields
and gantry angles (θG) were 124 and 299
degrees, respectively. This data which were in DICOM format was converted to DOSXYXnrc coordinates using equations 1-3 and the
following results were derived for θ, φcoland φ:
90, 270 and 34 degrees for the medial and 90, 270 and 209 degrees for the lateral ields.
In order to calculate the incident particle
luence per MU for a 10×10 cm2 ield size, i.e.
, a calibration run was performed. Scored dose values in the
moni-tor chamber of the model ( +
were obtained from BEAMnrc output ile
292
Material name( ICRU700/ pegs4)
Material CT number upper
bound
Material density upper/lower bound
(g/cm3)
Air -750 0.001-0.044
Lung 30 0.05-0.27
Tissue 1500 0.27-1.101
Bone >1500 1.101-1.68 Table 1. The conversion ramp used to convert pa ent's CT
images into voxelized format.
Figure 2. The measured and calculated percent peripheral dose (PD) values in lung and bone regions as a func on of
distance from the edge of the field.
(.egslst) and dose per particle luence matrix was acquired from DOSXYZnrc output file (.3ddose). Results of the calibration run for a
10×10 cm2 ield were: =8.55 ×10⁻¹⁶
, =
2.672×10⁻¹⁸
,and =1.4145×10⁻¹⁶
and =0.789
. A calibration run was also performed for the
breast treatment ields using beam
con iguration data exported from TPS and the
following results were derived:
=1.4145×10⁻¹⁶ The maximum
293
statistical uncertainty in dose calculations reported by DOSXYZnrc was 23%.
Finally, for each breast planned ield (medial/
lateral), the absolute dose matrix (Dxyz (cGy)) for
the patient tomographic phantom, was
calculated by substituting the above values in
equations 4 and 5.Dxyz(20×11) matrix was obtained
from DOSXYZnrc output ile and was acquired
MU(20×11) from TPS planned data.
The results of calculated OED for different
out of ield organs in 3D-CRT of breast are illustrated in igure 3, using DVH data calculated
by importing the MC calculated dose matrix to CERR.
DISCUSSION
The goal of this study was to describe the required technical details in developing a MC frame work for estimating the out of ield dose
in radiotherapy. MC dosimetry method is considered as the most accurate method for
quantifying the absorbed dose of out of ield
organs (2). In order for a MC framework to
accurately model all variables that in luence out of ield organ speci ic doses, treatment unit and
patient speci ic parameters need to be
addressed (2). In this regard, most developed
models have limited accuracy due to application
of speci ic standard phantoms, speci ic
treatment plans and treatment units (2, 4, 19).
Hence, the diversity in reported results is
evident (2). The framework developed in this
research is superior to previous models due to inclusion of patient speci ic peripheral dose calculation features such as: 1- calibration of
luence and MU, 2- utilization of patient’s tomographic phantom, 3- transfer of patient’s
planed beam con iguration data to create the patient speci ic MC beam model, 4- conversion of TPS derived beam coordinates to MC beam model coordinates and 5- multiple conformal beam dose calculations.
A MC framework including a 6 MV beam
model and a tomographic phantom was
developed for patient's speci ic OED
calculations. The model was implemented and validated for a 3DCRT breast treatment. The
results of model validation showed an
acceptable agreement between calculated and measured data. The maximum percentage difference for out-of- ield calculation was 17%.
The acceptance criterion for percentage
difference is 30% for out-of- ield region (18). The
uncertainty of the radiochromic dosimetry, error in MC calculation and differences in the composition of the phantom and corresponding model contributed to the overall uncertainty.
The overall one-sigma dose measurement uncertainty in ilm dosimetry, using Devic protocol for a uniform ield of above 0.4 Gy, is up
to 2% (15). The maximum statistical uncertainty
in out-of- ield dose calculation was 23%.
Our results are comparable to those of a similar study in which the mean difference between calculated and measured out-of- ield doses was reported as 11.4%. Calculated doses for out of ield organs were comparable to our results as well. The dose values for stomach, esophagus, liver, lung, spleen and kidney were reported as 109.54, 85.45, 43.15, 21.82, 71.24
and 24.36cGy, respectively (19). Comparing these
values to our results shows the maximum difference of 18.7 cGy for stomach. This difference can be the result of inherent error in
low dose out-of- ield dose calculations,
Figure 3. The results of calculated OED for different out of field organs in 3D-CRT of le1 breast (50 Gy prescribed dose).
difference in linac and phantom models and setup differences (source-to-surface distance setup verses SAD). It has been reported that SAD
setup may result in lower out-of- ield doses (19).
The framework developed in this research can be a valuable tool for calculating peripheral dose and out-of ield patient speci ic OEDs, the quantities which are needed when calculating risk of secondary cancer induction as the result
of radiotherapy (20). In other words, this code
can be used as a patient speci ic treatment plan optimization tool in order to select a treatment plan with the lowest risk of secondary cancer induction.
ACKNOWLEDGEMENTS
The authors wish to acknowledge the support from the department of radiotherapy of Milad Hospital, Isfahan, Iran. The authors would also like to thank Dr. Karbalai for his valuable
comments during this research. Con licts of interest: Declared none.
REFERENCES
1. BEIR (2006) Health risks from exposure to low levels of ionizing radia on BEIR VII. P.N.R.C., Na onal Academy of Science.
2. Xu XG, Bednarz B, PaganeA H (2008) A review of dosime-try studies on external-beam radia on treatment with respect to second cancer induc on. Phys Med Biol, 53:
193-241.
3. Atarod M, Shokrani P, Azarnoosh A (2013) Out-of-field beam characteris cs of a 6 MV photon beam: results of a Monte Carlo study. Appl Radiat Isot, 72: 182-194.
4. Bednarz B, Athar B, Xu XG (2010) A compara ve study on the risk of second primary cancers in out-of-field organs associated with radiotherapy of localized prostate carcino-ma using Monte Carlo-based accelerator and pa ent mod-els. Med Phys, 37: 1987-93.
5. Cyriac TS, Musthafa MM, Ganapathi Raman R, Abdul Haneefa K, Bhasi S (2015) Out-of-field photon dosimetry study between 3-D conformal and intensity modulated radia on therapy in the management of prostate cancer.
Int J Radiat Res, 13(2):127-34.
6. So rios S, Li J, Ma CM (2007) Monte Carlo determina on of radia on-induced cancer risks for prostate pa ents undergoing intensity-modulated radia on therapy. J Appl
Clin Med Phys, 8(4):14-27.
7. Ruben J, Davis S, Evans C, Jones P, Gagliard F, Haynes M, Hunter A (2008) The Effect of Intensity-Modulated Radio-therapy on Radia on-Induced Second Malignancies. Int J
Radiat Oncol Biol Phys, 70: 1530-6.
8. Donovan E, James H, Bonora M, Yarnold J, Evans P (2012) Second cancer incidence risk es mates using BEIR VII mod-els for standard and complex external beam radiotherapy for early breast cancer. Med Phys, 39: 5814-24.
9. Hall EJ and Wuu CS (2003) Radia on-induced second can-cers: The impact of 3D-CRT and IMRT. Int J Radiat Oncol
Biol Phys, 56: 83-88.
10. Howell RM, Hertel NE, Wang ZL, Hutchinson J, Fullerton GD (2006) Calcula on of effec ve dose from measure-ments of secondary neutron spectra and scaJered photon dose from dynamic MLC IMRT for 6 MV, 15 MV, and 18 MV beam energies. Med Phys, 33: 360-368.
11. Rogers DWO, Walters B, Kawrakow I (2007) BEAMnrc user manual. NRCC Report PRIS-0509(a).
12. Walters B, Kawrakow I, Rogers DWO (2005) DOSXYZnr-cUsers Manual NRC Report PIRS-794 rev B. Na onal Re-search Council of Canada, OJawa.
13. Zhan L, Jiang R, Osei EK (2012) Beam coordinate transfor-ma ons from DICOM to DOSXYZnrc. Phys Med Biol, 57:
513-23.
14. Atarod M and Shokrani P (2013) Monte Carlo study of fetal dosimetryparameters for 6 MV photon beam. J Med
Sig-nals Sens, 3: 12-17.
15. Devic S, Seuntjens J, Sham E, Podgorsak EB (2005) Pre-ciseradiochromic film dosimetry using a flat-bed document scanner. Med Phys, 32: 2245-53.
16. Popescu IA, Shaw CP, Zavgorodni SF, Beckham WA (2005) Absolute dose calcula ons for Monte Carlo simula ons of radiotherapy beams. Phys Med Biol, 50: 3375-92.
17. Deasy JO, Blanco AI, Clark VH (2003) CERR: A computa on-al environment for radiotherapy research. Med Phys, 30
(5):979-85.
18. Venselaar J, Welleweerd H, Mijnheer B (2001) Tolerances for the accuracy of photon beam dose calcula ons of treatment planning systems. Radiother Oncol, 60:191–
201.
19. Berris T, Mazonakis J, Tzedakis A, Fasoulaki A (2013) Calcu-la on of organ doses from breast cancer radiotherapy: a Monte Carlo study. Journal of Applied Clinical Medical
Physics, 14(1):133-46.
20. Schneider U, Zwahlen D, Ross D, KaserHotz B, Vet M (2005) Es ma on of radia on-induced cancer from three-dimen onal dose distribu ons: concept of organ equiva-lent dose. Int J Radiat Oncol Biol Phys, 61(5):1510-5.
294
Int. J. Radiat. Res., Vol. 15 No. 3, July 2017