ISSN 1479-4403 76 ©Academic Publishing International Ltd
Mobile Learning Study for High School Mathematics
Vani Kalloo and Permanand Mohan
The University of the West Indies, St Augustine, Trinidad and Tobago
[email protected]
[email protected]
Abstract: A mobile learning research project was conducted in Trinidad and Tobago to determine if mobile learning can assist high school students in learning mathematics. Several innovative techniques were used in this research to address the problem of high failure rates of mathematics in high schools in the Caribbean. A mobile learning application was developed based on a subset of the high school mathematics curriculum used in the English-speaking Caribbean. Game-based learning, personalization and multiple learning strategies were used in conjunction with mobile learning to assist students in improving their performance in mathematics. Three evaluation studies were conducted with the mobile learning application. During the studies, usage data was captured automatically by the system and this was used to determine the extent to which the students actually used the mobile application. At the end of each study, a questionnaire was used to capture student opinions of the mobile learning application. Questionnaire data is based solely on student responses and there is no guarantee of its accuracy and reliability. This paper focuses on the responses of the students to the questionnaire and seeks to determine if the usage data can increase the reliability of the questionnaire data. It summarizes the behaviour patterns of the students gleaned from the usage logs and compares this to the students’ responses to the questionnaire. Generally it was found that the students’ responses agreed with the usage data, though there were occasions when the responses diverged.
Keywords: mobile learning, learning mathematics, high school mathematics
1. Introduction and background
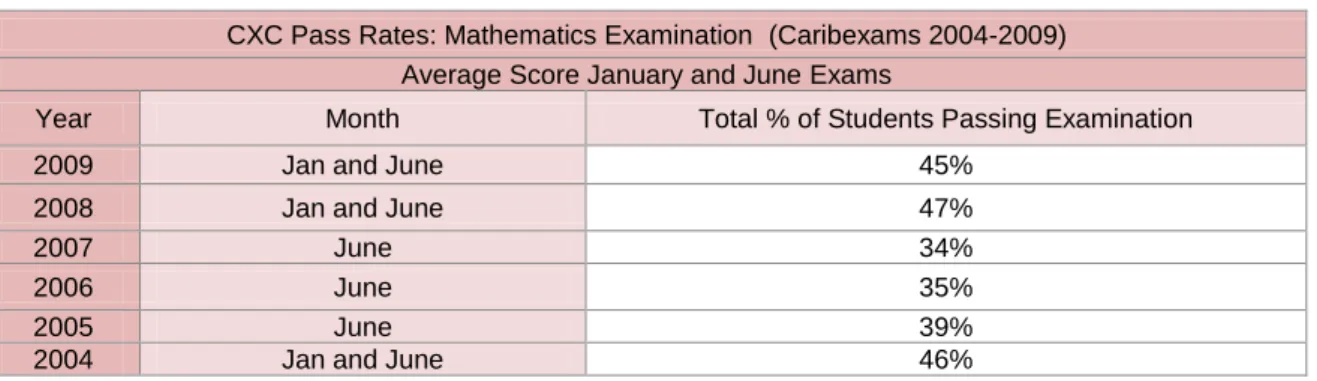
The high failure rates of mathematics in the Caribbean reveal that many students have difficulties with mathematics. This is a major problem since mathematics is a necessary prerequisite for students to progress in education and employment. High school students in most Caribbean countries prepare for the Caribbean Examinations Council (CXC) mathematics examination. Table 1 shows the pass rates for CXC mathematics for the period 2004 to 2009. It reveals that at most 47% of the students have passed mathematics in the Caribbean. This statistic highlights the fact that there is a need for more innovative learning solutions to assist students with improving their mathematics skills.
Table 1: CXC pass rates for the 6 year period, 2004-2009
CXC Pass Rates: Mathematics Examination (Caribexams 2004-2009) Average Score January and June Exams
Year Month Total % of Students Passing Examination
2009 Jan and June 45%
2008 Jan and June 47%
2007 June 34%
2006 June 35%
2005 June 39%
2004 Jan and June 46%
One potential solution is mobile learning. Mobile learning is the exploitation of ubiquitous handheld technologies, together with wireless and mobile phone networks, to facilitate, support, enhance and extend the reach of teaching and learning (m-learning.org, 2011). Mobile learning is expected to be motivating and offer the advantages of learning anywhere and anytime. The main reason for choosing mobile learning in our research is its popularity especially with young students today. Almost every person in Trinidad and Tobago owns at least one mobile phone. The cost of mobile devices and calling rates are quite affordable and the mobile infrastructure in Trinidad and Tobago is well established resulting in most people acquiring mobile devices with improved features every year. A similar situation exists in other Caribbean countries. Mobile devices offer advantages such as the
opportunity to learn anywhere and anytime and self-directed learning. Our research attempts to harness the potential benefits of mobile devices to provide a learning platform which targets poor performance in high school mathematics.
This paper provides an overview of the mobile learning system developed in our research and the evaluation studies conducted with this system. However, its main goal is to compare students’ responses on a post-test questionnaire to their actual usage of the mobile application. In particular, the paper seeks to answer the following research questions:
Why are students’ perceptions of mobile learning technology important? What is the value of comparing usage data to students’ responses? What does the comparison reveal?
Can questionnaire data be relied upon?
2. Literature review
Mobile learning in past years has proven to be successful in many different contexts and with various target groups. Faux et al. (2006) reported on a study where primary school students showed improvements in literacy after using PDAs. Cook et al. (2007) reported on a mobile learning study where 73% of the students thought it was important to learn anytime and anywhere. Attewell (2005) indicated that learners were excited to use the mobile devices, a large percentage of them showed improvement in reading and mathematics skills and it helped build their self-esteem and confidence. Benta, Cremene and Padurean (2004) presented a multimedia mobile learning application that combined the advantages of text, images, and audio. They stated that the mobile device captured the students’ attention very quickly and they found it useful. Chu and Liu (2007) conducted evaluations that revealed that students thought it was useful to use mobile devices for learning English. Conway-Smith (2010) reported on a study using mobile learning in South Africa where the results revealed an overall increase in mathematics scores by 3.36% in 18 weeks.
Sharples (2003) describes a system called HandLeR (Handheld Learning Resource) which attempts to put education at the fingertips of students through their mobile device. He reported that the students were excited about owning a piece of cool technology. The study indicates that the use of the mobile devices increases retention and motivation. Valk, Rashid and Elder (2010) conducted a survey of several mobile studies undertaken in developing countries. They reported on one study conducted in the Philippines where the results of the experimental group were only marginally higher than the control group. They reported on another study conducted in Mongolia which revealed an 18% increase from pre-test to post-test performance. There was also a study conducted in rural India which resulted in an average increase of 20% from pre-test to post-test scores.
Shin et al. (2011) investigate the effect of game technology on elementary students learning mathematics. In this study, students who played technology-based arithmetic games outperformed students who played paper-based arithmetic games. Franklin and Peng (2008) presented a mobile learning study for learning mathematics in which iPods were used to help middle school students learn algebraic equations. Videos were provided for students to learn beyond the hours of the classroom. Liebenberg (2008) presented a J2ME application called MOBI for learning mathematics. It addressed some of the challenges posed to mathematics education in South Africa. The application allowed the student to listen to podcasts, view multimedia content or even chat with other students via instant messaging. It offered assessment tools with corrective components. A mobile mathematics study called MoMath (MoMath 2010) in South Africa for mathematics showed that the use of the mobile devices increases retention and motivation. Improvements in students’ end of term tests results have also been seen. Project K-Nect (2008) targeted secondary at-risk ninth graders, helping them to focus on increasing their mathematics skills through mobile smartphones.
The literature on mobile learning documents students’ usage and perceptions of mobile learning. It reports that some researchers used the mobile device as an organizer to assist learning; some used SMS (text messaging) for learning while others developed dedicated learning environments on the mobile device itself. Projects in which the existing features of the mobile device were used for learning, reported that students were excited to use the mobile device for learning. For example, McFarlane, Roche and Triggs (2007) reported on a Becta mobile learning project where the students responded enthusiastically and the teachers indicated that students studied without even being
asked. Perry (2003) reported on another Becta ICT Research project where students were excited and highly motivated when they got PDAs to use for learning. Cook et al. (2007) presented a mobile learning study which required students to gather data using photos and video clips. The results of this study indicate that the students were very task-focused and the mobile phone motivated them to get high grades.
Attewell (2005) conducted a mobile learning study for learning literacy and numeracy and the learners were excited to use the mobile device. Hartnell-Young and Heym (2008) conducted research to determine if there was a positive side to mobile phones in secondary schools. Their findings revealed that students enjoyed the mobile learning and were motivated. Kadirire (2007) used instant messaging for creating collaborative and interactive learning. The students became engaged in course material outside the classroom which motivated them and improved their self-confidence. Most students valued communication with peers and they developed a sense of community. Valk, Rashid and Elder (2010) reported on a project that used a module created for learning English and was tested with a group of bank tellers and restaurant servers. The participants agreed that this method of learning was helpful to them. Valk, Rashid and Elder also reported on a study which explored the effects of mobile learning. However, results indicated that there was no improvement in performance and students were concerned about the challenges of the small screen of the mobile device. This study gives an example of negative responses from some learners. It was suggested that perhaps this method of learning was not suitable for all learners.
Games are extremely popular with every age group. As part of this mobile learning study conducted in secondary schools, a survey was done in Trinidad and Tobago with over 120 students. It revealed that 89% of high school students play computer games at least once a week. Most students enjoy playing games. The data based on student opinions indicated that they are willing to use gaming for learning and some even prefer mobile games. This data is confirmed by many reports from different countries. Hashim et al. (2007) presents the results of a survey conducted at the University of Malaysia comparing the use of mobile games to other digital games. It reveals that 54% of the respondents preferred playing mobile games. A BBC report by Pratchett (2005) provides some statistics on gamers in the UK. 92% of 11-15 year olds play games at least 3 times a week. 48% of 6-65 year olds are heavy gamers, meaning they play at least once a week and at least 82% of individual’s age 6-24 play games.
3. Design and implementation
A mobile learning application was developed offering the learner multiple strategies for learning mathematics such as game-based learning and personalized recommendations. The application was designed to complement the mathematics classes that students normally attend at school. It focused on a subset of the CXC mathematics curriculum dealing with algebra. Specifically, the application targeted topics in algebra such as factors, directed numbers, simplification of expressions, factorization, and equation solving. Algebra was chosen as the main topic for this study since it is one of the most difficult topics in high school mathematics.
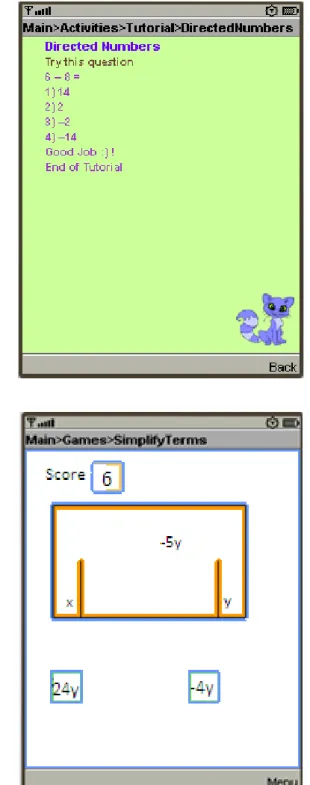
The learning strategies used in the application were Lessons, Examples, Tutorials, Quizzes and Games. The students can choose to use a text-based Lesson, review a worked Example of the problem, try a Tutorial or Quiz, or play a learning Game. Figure 1 shows a screenshot of one of the Tutorials and Figure 2 shows the Simplify Terms Game. The Example feature offers the learner a worked problem with the freedom to manipulate the numerical values which causes the solution to adapt to suit the new values. This gives the learner the ability to dynamically modify the example. The other learning features are intended to help the learner to review the curriculum items targeted by the application. The Tutorial feature consists of three main parts, each displayed in a separate screen. The first part offers a brief explanation of the topic, the second part provides a worked example and the last part generates a question for the student to attempt.
The Game feature was created to encourage students to practice the targeted mathematics skills. This is important since practice has been identified as one of the most important steps in learning a mathematical skill. MobileMath has seven games. A game was created for each topic targeted. These include a Finding Factors Game, a Directed Numbers Game, a Simplification of Expressions Game, a Factorization Game and a Solving Equations Game. The objective of each game is to help the students improve a certain skill. The Factors Game allows the students to practise with factors while the Directed Numbers Game allows them practise with directed numbers. Each game is implemented
in such a way as to ensure that if the student plays, he or she is practising that particular skill. The Simplification of Expressions Game requires the player to sort X-terms from the Y-terms as they drop in from the top of the screen and add the new value to the corresponding X or Y term. The Factorization Game requires the player to select two terms from the given set: a number term and an algebraic term. The Solve Equation Game is made up of four equations and a probable solution for each one. One column of the set is shuffled and the player has to put them back in the correct position.
Figure 1: Tutorial feature
Figure 2: Game feature
The mobile learning system comprises mobile phones used by students, a Web server, and Internet connectivity via a cellular network. A student logs into the application using his mobile phone and proceeds to use the different features of the application. On exit, all scores awarded and usage data are sent to the Web server via the Internet. The Web server also supports a GPRS game and a chat feature. It keeps track of data on student usage of the different features. GPRS stands for General
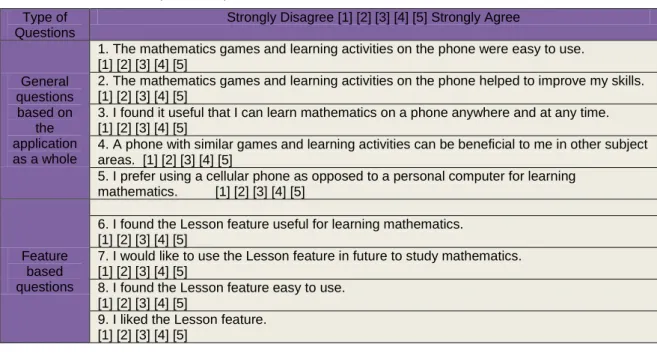
Packet Radio Services which is a wireless based communication service which allows connection to the Internet for mobile phones and computers. The GPRS and Bluetooth capabilities of the mobile devices allow collaboration among students while they play the games and also allow them to discuss mathematical problems with classmates. This gives students a chance to learn from each other. Two main forms of data were collected to be used to evaluate the effectiveness of mobile learning. Data was collected by the mobile device on each student’s usage of the application and a questionnaire was used to gather the students’ perceptions of using mobile learning for mathematics. Table 2 shows some example questions from the questionnaire used.
Table 2: Questions example from questionnaire Type of
Questions
Strongly Disagree [1] [2] [3] [4] [5] Strongly Agree
General questions based on
the application as a whole
1. The mathematics games and learning activities on the phone were easy to use. [1] [2] [3] [4] [5]
2. The mathematics games and learning activities on the phone helped to improve my skills. [1] [2] [3] [4] [5]
3. I found it useful that I can learn mathematics on a phone anywhere and at any time. [1] [2] [3] [4] [5]
4. A phone with similar games and learning activities can be beneficial to me in other subject areas. [1] [2] [3] [4] [5]
5. I prefer using a cellular phone as opposed to a personal computer for learning mathematics. [1] [2] [3] [4] [5]
Feature based questions
6. I found the Lesson feature useful for learning mathematics. [1] [2] [3] [4] [5]
7. I would like to use the Lesson feature in future to study mathematics. [1] [2] [3] [4] [5]
8. I found the Lesson feature easy to use. [1] [2] [3] [4] [5]
9. I liked the Lesson feature. [1] [2] [3] [4] [5]
The first section of the questionnaire was designed to get a general idea of what the students thought about using the mobile application. This section attempted to get an idea of what the students thought of using this technology for the first time for learning mathematics.
The second section of the questionnaire focused on getting feedback from the students, based on each feature of the mobile application. Since the application consisted of several screens, screen shots were used to remind the students of the feature in question. The Likert scale was used to make it easy for the students to respond to each question since they simply had to circle a number to represent their response. It also promotes a more accurate response from the students since they have a range of options.
The mobile learning application collected data based on each student’s usage as they used each feature. The date and time of each use, the length of time and the number of times each feature was used was captured. Data on which options were selected by each student was collected in an effort to determine if they used the recommendations made by the mobile application. All scores in each game and the quiz were recorded. This data was sent to the server via a GPRS connection. The mobile devices used by the students had an unlimited GPRS connection. However in the event that the connection went down, the data was stored on the mobile device and sent to the server when the connection became available again. The data collected was analyzed at the end of the study to determine how much the students used the application and how they performed on the assessment features.
4. Evaluation
Three evaluation studies were conducted to determine the effectiveness and usability of the mobile learning application. Approximately 20 students participated in each study; thus, the sample size was almost 60 students. In the first study, the students used mobile learning without encouragement or interference from the teacher. In the second study, support and encouragement were provided by the teacher, in the form of text messages and classroom meetings. The students of Study 1 and Study 2 had been taught algebra in a previous term at school and they used mobile learning to determine if
their performance would improve. The students of Study 3 learned algebra during the study for the first time. They were taught in the classroom and used mobile learning as a support tool to augment their study of algebra. The objective of Study 3 was to determine how mobile learning would impact on students who were learning algebra for the first time. This study consisted of an experimental group and a control group. Pre-tests and post-tests was conducted to evaluate if there were any difference in student performance and questionnaires were completed in order to gauge students’ opinions of the different features of the mobile learning application.
The results of Studies 1 and 2 revealed that there were statistically significant improvements in students’ performance after using the mobile learning application. In Study 1 the mean value of the pre-test was 55.1 and the mean value of the post-test was 63.5, showing an increase in average performance. A 2-tailed significance t-test revealed a value of 0.025 implying that there is a significant difference between the test scores and the post-test scores. In Study 2 the mean value of the pre-test was 30.7, while the mean of the post-pre-test was 40.9 showing an average increase in performance. The 2-tailed significance t-test revealed a value of 0.001 implying that there is a significant difference between the pre-test scores and the post-test scores (Kalloo and Mohan 2011b).
However, in Study 3, the students of the experimental group did not perform any better than the students of the control group. In Study 3, the experimental group obtained an average score of 48.8% while the control group obtained an average score of 49.5%. The data also showed that the students who passed the post-test scored an average of 63% and the students who failed scored an average of 34%. It also shows that the students who passed the post-test used the mobile application 22% more and 63% longer than the students who failed (Kalloo and Mohan, 2011a).
This paper gives an analysis of the students’ responses to the questionnaire in all three studies and it compares this to the actual use of the mobile learning application by the students.
5. Students’ perceptions and usage of the mobile learning system
There are various attributes of a learning tool which can contribute to its success, such as being fun, having games, being visually appealing and using animation. However, before trying to evaluate why the learner finds it appealing, it is essential to first evaluate if they found it appealing at all. The learner’s perception of the learning tool is extremely important in the evaluation process and ultimate success of the tool. If the learner does not perceive it as beneficial, this can impact negatively on its success. The questionnaire data can be used to provide valuable data with regard to learner perceptions. The difficulty lies in getting an accurate account from the learner of their perceptions. When interviews and questionnaires are used there is always the possibility that the responses are not truthful or accurate. Verifying that the responses are accurate is essential before it is further developed.
A questionnaire is a research tool designed to obtain information from individuals based on specific information. It can cost effectively gather information in a particular format, making it easy for the user to enter the data and remain anonymous. However this method of collecting research information can have some disadvantages, for example the individual has little motivation to complete the questions honestly and meticulously. Even though it may not be possible to verify the questionnaire data to 100% accuracy, other data gathered in the study may be able to add credibility to the responses. In our research, we consider it beneficial to compare the questionnaire responses to the usage data because:
Usage data can prove that the user actually used the system, implying that they are qualified to accurately answer the questions because they have some degree of experience using the application: For instance if an individual is answering questions based on a specific method of learning then he or she can only respond to the questions accurately if her she has some experience with this learning method. The server data proves that the students used the mobile application and it illustrates how frequently they used it. This data can substantiate the questionnaire responses verifying that they were well qualified to respond to questions.
Usage data can verify responses to some of the questions such as how often they used the system: The data can also verify the user’s truthfulness in at least some of the questions. The questionnaire asked questions such as “How often did you use this feature?” Since the usage data collected
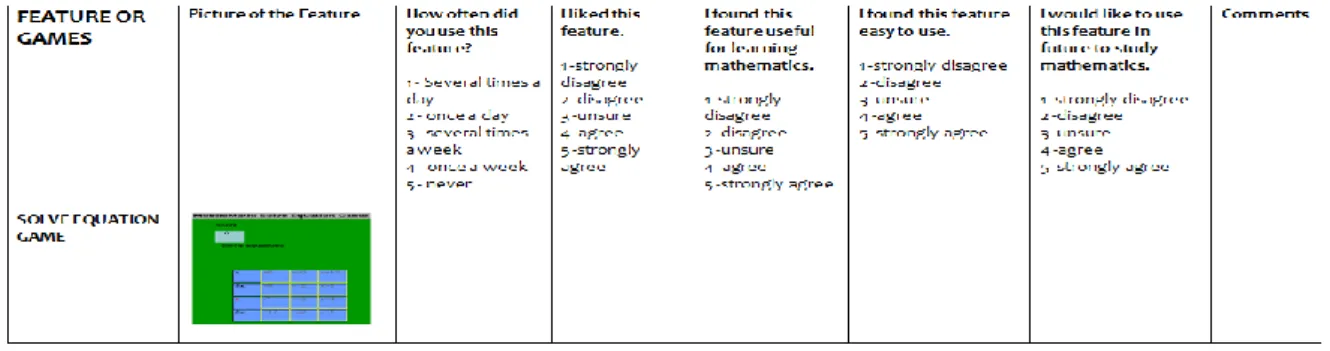
contained this information, it could be verified if the user was being honest. Figure 3 shows a sample of the questionnaire issued to the students. The first question for instance can be verified by the usage information collected. Therefore if it is determined that the user answered most of the verifiable questions accurately then the likelihood of the unverifiable questions being answered accurately is greater.
Figure 3: Sample from questionnaire
6. Results
Students’ Perceptions on Frequent Use of Features and Possible Future Use
Figure 4 displays two sets of data on one graph using primary and secondary vertical gridlines. The primary gridline is the vertical axis on the left and the secondary gridline is the one on the right. The primary gridline represents the percentage of students who indicated in the questionnaire that they used the application several times a week. The secondary gridline represents the average frequency of actual use based on the server data. This graph shows a comparison of the server to the questionnaire data. It illustrates that 65% of the students agreed that they used the Game feature several times a week. The actual server data reveals that on average they used the Games at least 5 times. The point, at which the line graph ascends, represents the alignment of the server data with the questionnaire responses. An example of this is the games data in Figure 4.
Figure 4: Comparison of questionnaire responses and server data on actual frequency of use
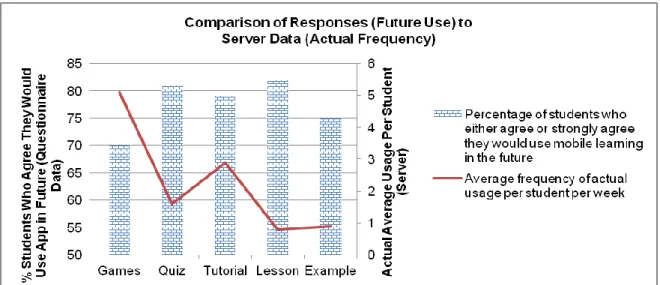
Figure 5 compares the student responses to the question about using the application in the future with the server data on usage of the application. The primary gridline represents the percentage of students who indicated in the questionnaire that they would use the mobile application in the future. The secondary gridline represents the average usage per student based on the server data. The questions based on the students’ potential use of the application in the future can be corroborated by the server data. Figure 5 shows that 70% of the students claimed that they would use the application in the future, if given the opportunity. The line segment in Figure 5 shows that the students actually used the Games several times a week as claimed.
Figure 5: Comparison of responses for future use with server data of actual frequency of usage Figure 4 shows that 79% of the students stated that they used the Quiz feature several times a week. The server data shows that the students on average used the Quiz feature1.6 times per week. Figure 5 shows 81% of the students agreed that they would use the Quiz feature in the future. Figure 4 shows 64% of the students stated on the questionnaire that they used the Tutorial feature several times a week. The server data illustrates that the students actually used this feature on average 2.9 times per week. Figure 5 shows 79% of the students stated that they would use this feature in the future. Figure 4 shows that 77% and 66% of the students claimed that they used the Lesson and Example features several times a week respectively. However, the usage data shows that the application was not used several times a week. 75% and 82% of the students agreed that they would use the Example and Lesson features respectively in the future if they were available.
Students’ Perception of Each Feature
Figure 6 is a bar chart which uses two vertical gridlines to compare questionnaire data and server data. The primary and secondary gridlines represent questionnaire and server data respectively showing a comparison of the two. It shows the student responses when asked questions (displayed next to the graph on Figure 6) based on each feature. 77% and 71% of the students responded positively to the questions asked on the Lesson and Example features, respectively. (Note that the term “responded positively” is used if a student either agreed or strongly agreed to a question.) However, server data reveals that these features were used minimally per week on average shown by the line graph on Figure 6.
*Questions Asked for Each Feature
I liked this feature. I found this feature useful for learning mathematics I found this feature easy to use.
I would like to use this feature in the future to study mathematics.
Figure 6: Comparison of usage of the application to questionnaire responses based on each feature An examination of the Tutorial, Quiz and Game features reveals that the percentage of students who responded positively to the questions based on each feature was 70%, 82%, and 70.6% respectively (Figure 6). The server data shows that the usage was far greater for these three features than the others.
Students’ Perception of Each Game
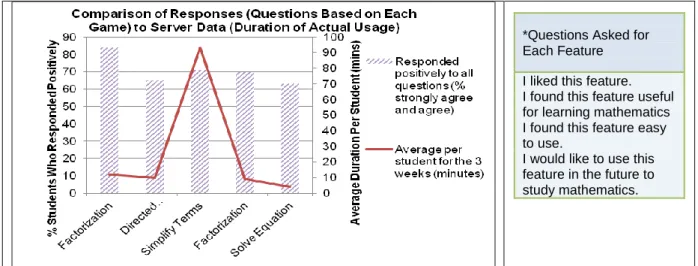
Figure 7 shows server data and questionnaire data based on each individual game. The questionnaire data is the percentage of students who responded positively to the questions (displayed on the side of the graph in Figure 7) for each game shown on the primary gridline. The server data shows the length of time on average which each student used each game in minutes and is shown on the secondary gridline. Figure 7 illustrates that the students used each game at least 4 minutes which was more than some of the other features.
*Questions Asked for Each Feature I liked this feature. I found this feature useful for learning mathematics I found this feature easy to use.
I would like to use this feature in the future to study mathematics.
Figure 7: Comparison of server data and student responses based on each game Students’ Perception of the Whole Application
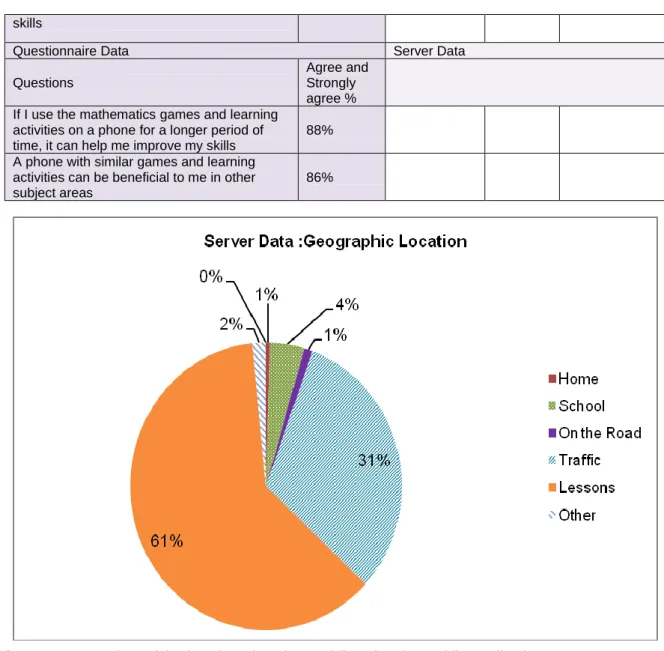
Table 3 shows the responses to questions based on the usefulness of learning anytime and anywhere with mobile learning; how easy it was to use the mobile application; and, if they preferred mobile devices over a PC for learning mathematics. 93% of the students agreed that they found the mobility of learning useful and 81% found it was easy to use. 52% of the students stated that they preferred mobile devices for learning as opposed to the PC. The table illustrates that, on average, the students used the application 35 times and 154 minutes for the three week period. 32% of the students used the mobile application longer than the average student and 37% used it more often than average. The students participating in the mobile learning experiments had the option of entering their geographic location each time they logged on to the system. If the student chose not to enter a location then by default there was no location set. Figure 8 shows server data based on the location from where the students used the mobile learning application. The questionnaire data reveals that the 66% of the students stated that they used the mobile learning outside of their homes. The data shows that whenever the students specified a location, 99% of the time the mobile learning application was used outside of their homes.
Table 3: Questionnaire and server data
Questionnaire Data Server Data
Questions
Agree and Strongly agree %
I found it useful that I can learn mathematics
on a phone anywhere and at anytime 93%
Average per student
Percentage of students who used app more than average The mathematics games and learning
activities on the phone were easy to use 81%
Duration of system use in minutes
154 32%
I prefer using a mobile phone as opposed to a personal computer for learning mathematics 52%
Frequency of use of mobile application
35.8 37%
The mathematics games and learning
skills
Questionnaire Data Server Data
Questions
Agree and Strongly agree % If I use the mathematics games and learning
activities on a phone for a longer period of time, it can help me improve my skills
88%
A phone with similar games and learning activities can be beneficial to me in other subject areas
86%
Figure 8: Server data of the location of students while using the mobile application
7. Discussion
Students’ Perceptions on Frequent Use of Features and Possible Future Use
Figure 4 illustrates that the server data supports the questionnaire data for the Games feature. It suggests that the server data is in alignment with the questionnaire responses which indicate that the Games feature was used several times a week. Figure 5 shows that the students were familiar enough with the Games feature to respond to the games questions on the questionnaire accurately. This adds credibility to their responses based on the Games feature. The server data reveals that since the students used the application frequently they are more likely to use it in the future than students who did not use it for the evaluation study. Data from Figures 4 and 5 illustrates that the students did not use the Quiz feature as much as the Game feature; however, the data confirms that the Quiz feature was used to a reasonable extent, giving credibility to the responses made by the students. Figure 4 show that the students’ responses confirm that they used the Tutorial feature several times a week. Figure 5 provides evidence which adds credibility to the questionnaire responses for the Tutorial feature. Data from Figure 4 does not support the results obtained by analysing the questionnaire responses based on the Lesson and Example features. This evidence suggests that the responses for the Lesson and Example features cannot be relied upon. Since the data shows that the students did not use the Lesson and Example very much in the three weeks, their responses lack credibility for these features.
Students’ Perception of Each Feature
Figure 6 shows that the usage data does not support the claims made on the Example and Lesson features on the questionnaire. According to the responses, the students found it easy to use, they liked the features, thought it was useful, and agreed they would use it in the future; however, they did not use it very much. Therefore this data implies that the responses based on the Lesson and Example features cannot be relied upon. Figure 6 highlights the fact that the students used the Games, Tutorial and Quiz features more than the Lesson and Example features implying that the student responses for some questions were more reliable than others and they were better prepared to answer these questions since they were familiar with the features.
Students’ Perception of Each Game
Figure 7 was based on each individual game. This figure was generated from the server data and reveals that the students used the Games more than the other features, which gives some credibility to the questionnaire responses based on the Games. Other questionnaire data reveals that 68% of the students responded positively to the following statement “I enjoyed the learning Games more than the other learning activities”. This data is supported by the server data which reveals that the students used the Games more than the other learning activities. Figure 7 highlights the fact that they used the Simplified Expression Game the longest thereby confirming their questionnaire responses based on this game.
Students’ Perception of the Whole Application
Table 3 reveals that the students used the mobile learning application a significant amount of time for the three weeks, suggesting that their responses to the questions based on the application as a whole were generally reliable. Figure 8 provides evidence that the students made excellent use of the mobility of the application since they used it away from home most of the time. This highlights an important advantage of using a mobile device as opposed to a PC for learning mathematics.
When comparing the server data to the questionnaire responses, the server data on actual usage confirmed the questionnaire responses. There were two cases involving the Lesson and the Example feature where the server data did not match the students’ responses. However, it is unclear what may have been the reason for the inflated responses. It may have been that the students forgot, did not keep an accurate account of how much they used it or perhaps did not feel comfortable being completely honest. On the other hand, the usage data for the Game feature actually shows that the students used the learning games more than they thought. This is an interesting result and seems to suggest that students underestimate the time spent on learning activities involving games. Perhaps this suggests that the students did not accurately keep track of their usage. This is a very positive indicator for using more games in mobile learning.
Since the usage data verified the questionnaire responses for three out of the five features then it can be concluded that the questionnaire data is valid for more than 50% of the application content. Therefore this analysis adds credibility to the questionnaire data. Thus, it is reasonable to accept the results that at least 80% of the students thought that the application was easy to use, it can help improve their skills and that it was useful to study anytime and anywhere.
The comparison with the server data adds value to the questionnaire data. Therefore the results of the mobile learning study are supported by both substantial server data and questionnaire data. Students’ perceptions are very important to the success of any new learning technology. The results indicate that the server data is generally in agreement with the students’ perceptions of the mobile learning application. These results are very significant to the field of mobile learning.
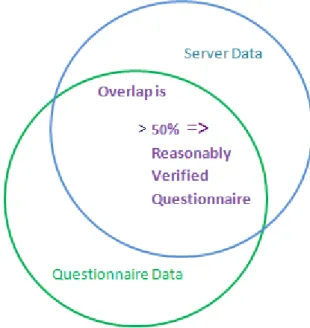
Figure 9 is a visual representation of the comparison of the questionnaire data and server data. It suggests that in cases where the server data is relevant to the questionnaire data, a comparison can be made. If the comparison reveals that the server data supports more than 50% of the questionnaire data, this suggests that the questionnaire data is fairly accurate.
Figure 9: Comparing questionnaire data with server data
8. Conclusion and future research
This paper focuses on the student responses to using a mobile learning application for high school mathematics. The students’ opinions on mobile learning are essential to the success of this method of learning mathematics. The students’ opinions are collected via a questionnaire. The reliability of the questionnaire data can be improved by obtaining other sources of information to corroborate the data. In this research, the responses to the questionnaire were analyzed and compared to the actual usage data which was collected by the system. The usage data is compared to the students’ responses in order to determine the degree of accuracy of the questionnaire responses.
Some of the other features were used just as much or even more than the students claimed. An example of this is the Games feature. The data indicates that the students’ responses for the Game feature were more credible than that of the Lesson and Example features. The students’ responses on the questionnaire and the usage data from the server both indicate that the students used the Games feature of the mobile learning application the most. Thus, including more game-based learning in future mobile learning applications may be a good strategy. Studies to improve the learning games so that they are more attractive, motivating, interactive, and fun are likely to have a great impact on the effectiveness of future mobile learning applications.
The data indicates that even though the Lesson and Example features were not used a lot, they were still used to some extent. This suggests a need for an optional feature to allow the reviewing of the main concepts of each topic while the Games could be the main focus of the learning application. The data also indicates that the students used the Tutorial feature several times a week. This is another learning strategy worth exploring in future research. An analysis of why the student chose this feature over the Lesson and Example may provide interesting insight which can be used in future mobile learning development.
The majority of the students who participated in the three evaluation studies generally responded positively to the mobile learning application. The students came from many districts and high schools throughout Trinidad and Tobago. This mobile learning study is the first of its kind in Trinidad and Tobago and the wider Caribbean and the results suggest that mobile learning for mathematics may be beneficial for high schools in the Caribbean and elsewhere. However, more development and experimentation is required before definitive statements can be made.
Generally, the usage data confirms the credibility of the students’ responses. However, there are a few cases where the usage data indicates that the students used certain features less than reported
on the questionnaire. This data adds credibility to the findings of the study presented. This approach can be beneficial to other research studies by providing a method to verify or add credibility to questionnaire data in a similar manner, if the appropriate usage data is available, strengthening the results presented. This is seen as essential as students’ perceptions are critical in the success of such learning tools.
Acknowledgements
The authors wish to acknowledge The University of the West Indies and the Telecommunication Services of Trinidad and Tobago (TSTT Foundation) for their financial support in this project.
References
Attewell, J. (2005) “Mobile technologies and learning: A technology update and m-learning project summary.” Learning and Skills Development Agency: United Kingdom. http://www.m-learning.org/docs/The%20m-learning%20project%20-%20technology%20update%20and%20project%20summary.pdf (accessed November 30, 2011).
Benta, K.I., Cremene, M. & Padurean, R. (2004) “Multimedia m-learning using mobile phones.” In Proceedings of MLEARN 2004: Mobile Learning anytime everywhere, July 5-6, 2004, 27-28, Rome, Italy; London: Learning and Skills Development Agency.
Caribexams. (2004) “Caribbean Examination Council (CXC) Mathematics pass rates assembled from data published by CXC annual school reports.” http://www.caribexams.org/ m_pass_rates (accessed October 19, 2010).
Chu, Y. & Liu, T. (2007) “Handheld computer supported context-aware learning with 2D barcodes.” In
Proceedings of the Seventh IEEE International Conference on Advanced Learning Technologies, (ICALT 2007), July 18-20, 2007, 485-486, Niigata, Japan.
Conway-Smith, E. (2010) “Teaching with cell phones. GlobalPost”
http://www.globalpost.com/dispatch/education/100720/south-africa-teaching-cell-phones?page=0,0 (accessed November 30, 2011).
Cook, J., Bradley, C., Lance, J., Smith, C. & Haynes, R. (2007) “Generating learning contexts with mobile devices. Mobile learning: Towards a research agenda.” WLE Centre Occasional Papers in Work-Based Learning, ed. Norbert Pachler, 55-74, London: WLE Centre
http://www.wlecentre.ac.uk/cms/files/occasionalpapers/ mobilelearning_pachler2007.pdf (accessed November 19, 2010).
Faux, F., McFarlane, A., Roche, N. & Facer, K. (2006) “Learning with handheld technologies: A handbook from Futurelab.” Bristol, UK: Futurelab. http://www.futurelab.org.uk/research (accessed November 30, 2006). Franklin, T. & Peng, L. (2008) “Mobile math: math educators and students engage in mobile learning.” Journal of
Computing in Higher Education, 20 (2): 69-80.
Hartnell-Young, E. & Heym, N. (2008) “How mobile phones help learning in secondary schools.” BECTA. http://research.becta.org.uk/index.php?catcode=_re_rp_02&rid=15482§ion=rh, (accessed November 17, 2010).
Hashim, H.A., Ab Hamid, S. H. & Wan Rozali, W. A. (2007) “A Survey on mobile games usage among the Institute of Higher Learning (IHL) students in Malaysia.” In First IEEE International Symposium: Information Technologies and Applications in Education (ISITAE '07), November 23-25, 2007, 40-44, Kunming, China. Kadirire, J. (2007) “Instant messaging for creating interactive and collaboration m-Learning environments.”
International Review of Research in Open and Distance Learning. 2 (8): 1-14.
Kalloo, V., & Mohan, P. (2011a) “Correlation between student performance and use of an mLearning application for high school mathematics.” In Proceedings of the Eleventh IEEE International Conference on Advanced Learning Technologies, (ICALT 2011), July 6-8, 2011, Athens, Georgia, USA, pp. 174-178.
Kalloo, V., & Mohan, P. (2011b), “An investigation into mobile learning for high school mathematics.” International Journal of Mobile and Blended Learning, 3(3), 60-77, July-September 2011.
Liebenberg, J. (2008). “Mobile mathematics – lessons learned.” In Proceedings of the mLearn 2008 Conference, The Bridge From Text To Context, October 7-10, 2008, 346, Ironbridge Gorge, Shropshire, UK,
http://www.scit.wlv.ac.uk/brendan/mLearn2008.pdf, (accessed November 30, 2011).
McFarlane, A., Roche, N. & Triggs, P. (2007) “Mobile learning: Research findings.” Becta, July 2007.
http://partners.becta.org.uk/upload-dir/downloads/page_documents/ research/mobile_learning_july07.pdf (accessed February 4, 2008).
m-learning.org, (2011), http://www.m-learning.org/knowledge-centre/whatismlearning, (accessed November 30, 2011)
MoMath. (2010) “Mobile learning for mathematics: Nokia project in South Africa.” Symbian tweet,
http://www.symbiantweet.com/mobile-learning-for-mathematics-in-south-africa, (accessed November 30, 2011).
Perry, D. (2003) “Handheld computers (PDAs) in schools.” Becta, http://partners.becta.org.uk/ page_documents/research/handhelds.pdf (accessed September 27, 2010).
Pratchett, R. (2005) “Gamers in the UK: digital play, digital lifestyles.” BBC Creative Research and Development. http://open.bbc.co.uk/newmediaresearch/files/BBC_UK_Games_Research_2005.pdf (accessed November 30, 2011).
Project K-Nect. (2008) http://www.projectknect.org/Project%20K-Nect/Home.html
http://www.cxc.org/examinations/exam-results-reports (accessed November 30, 2010).
Sharples, M. (2003) “Disruptive devices: mobile technology for conversational learning.” International Journal of Continuing Engineering Education and Lifelong Learning, 12 (5/6): 504-520.
Shin, N., Sutherland, L. M., Norris, C. & Soloway, E. (2011) “Effects of game technology on elementary student learning in mathematics.” British Journal of Educational Technology. doi:
10.1111/j.1467-8535.2011.01197.x.
Valk, J-H., Rashid, A. T. & Elder, L. (2010) “Using mobile phones to improve educational outcomes: An analysis of evidence from Asia.” The International Review of Research in Open and Distance Learning, 11 (1).