c
Sharif University of Technology, February 2010
On Fatigue Striations
z
A.J. McEvily
1;and H. Matsunaga
2Abstract. This paper provides a review of the research that has led to our current understanding of the process of fatigue striation formation. An important question addressed is whether or not at low stress intensity values, fatigue cracks can propagate intermittently in steels and aluminum alloys. It is concluded that there is no valid evidence for propagation on other than a cycle-by-cycle basis.
Keywords: Fatigue striations; Fatigue crack growth; Fatigue fractography; Fatigue mechanism.
INTRODUCTION
The aim of this paper is to review the current un-derstanding of fatigue striations, i.e. how they are formed, what are their geometries, and over what range of fatigue crack what are growth rates they are found. The matter of whether or not the fatigue crack growth process at low ranges of the stress intensity factor, K, is cycle-by-cycle or intermittent will also be discussed. BACKGROUND
Interest in fatigue striations began with the seminal 1951 paper \Fractographic Registrations of Fatigue" by Zape and Worden [1], which provided the rst micrographs of fatigue striations. These fatigue stri-ations were observed by light microscopy in 7075-T6 aluminum alloy, 1010 steel and low-alloy steel, and were immediately recognized to be a characteristic of fatigue crack growth; an example is shown in Figure 1. Since the time of Zape and Worden's discovery, research on fatigue striations has been directed at:
1. The mechanism of fatigue striation formation, 2. Whether or not the process of fatigue crack growth
occurs on a cycle-by-cycle basis, particularly at low K levels.
1. Materials Science and Engineering, Unit 3136, University of Connecticut, 97 N. Eagleville Rd., Storrs, CT 06269 USA. 2. Department of Mechanical Engineering, Fukuoka University,
8-19-1 Nanakuma, Jonan-ku, Fukuoka, 814-0180, Japan. *. Corresponding author. Email: [email protected] z. On the occasion of his 60th birthday, the authors dedicate
this paper to Prof. Dr. Dietmar Eier of the University of Kaiserslautern in Germany.
Received 22 April 2009; received in revised form 5 July 2009; accepted 12 September 2009
Figure 1. A rst micrograph of fatigue striations (7075-T6 aluminum alloy [1] with permission of ASM International r. All rights reserved.)
Progress in understanding the nature of fatigue striations increased rapidly in the 1950's and 1960's as the result of several more-or-less concurrent events, one of which was the 1953 fatigue-related crashes of two Comet aircraft, which focused interest on fatigue crack growth. In addition, the advent of the transmission electron microscope with its high resolution and depth of focus and, later, the scanning electron microscope together with the development of fracture mechanics, greatly promoted research concerning the nature of fatigue crack growth and striations.
In the immediate period after Zape and Wor-den's work, considerations of the mechanism of fatigue crack growth were strongly inuenced by Orowan's 1939 proposed mechanism for fatigue crack initia-tion [2]. In Orowan's view, crack initiainitia-tion required the cyclic hardening, over a number of cycles, of a critical volume of material, to a local fracture level. This
model was adapted to the case of fatigue crack growth, for example by Head [3]. However, in 1960, Forsyth and Ryder [4], using light microscopy and a fatigue-cracked aluminum alloy specimen, clearly showed that an increment of fatigue crack growth occurred in each loading cycle. They used a two-step cyclic loading procedure in which the number of cycles applied at each step was known and found a one-to-one correspondence between the number of load cycles applied and the number of striations created in each loading block. By this means, they were able to present convincing evidence that in the range of crack growth rates of 5 10 7 m/cycle to 5 10 6 m/cycle and higher
a fatigue crack advanced in each loading cycle, with each loading cycle resulting in the formation of one striation. This nding was of signicance, not only with respect to the thinking regarding the fatigue crack growth process, but also regarding the emerging elds of fractography and failure analysis, for in inspecting a part that had failed in fatigue, it was now possible, by counting striations and measuring their spacings, to gain insight as to the prior loading history of the part. Research on the mechanism of striation formation following Forsyth and Ryder's work moved ahead rapidly. In 1962, Laird and Smith [5] showed that in a high-strain loading cycle of a ductile metal, crack tip blunting occurred on uploading and a striation accompanied by crack tip re-sharpening occurred on downloading. In this study, the striation spacings were quite large of the order of 100 microns; a 1967 version of this process is shown in Figure 2 [6].
In a study remarkable for its excellent micro-graphs and ndings, McMillan and Pelloux [7] carried
Figure 2. The plastic blunting process of fatigue crack propagation in the stage II mode. (a) Zero load; (b) Small tensile load; (c) Maximum tensile load; (d) Small
compressive load; (e) Maximum compressive load; (f) small tensile load. The double arrowheads in (c) and (d) signify the greater width of slip bands at the crack in these stages of the process. The stress axis is vertical ([6] with permission of ASTM).
out an extensive examination of striations formed in aluminum alloy 2024-T3. A two-stage replica technique was used to prepare replicas that were shadowed with germanium in the direction of the crack propagation for examination in an electron microscope. The crack growth rates studied ranged from 2 10 7 m/cycle
up to 5 10 5 m/cycle; much lower than in the work
of Laird and Smith [5], and all the fatigue striations were of the ductile type [8]. By examining the contrast resulting from shadowing, McMillan and Pelloux were able to present that the fatigue striations showed a ridge or \saw tooth" prole. They were also able to determine unambiguously the slope orientation on each side of a striation and, with this information, to develop a model for striation formation of the type shown in Figure 3. In the discussion in the paper, Schijve [9] presented a similar model, as shown in Figure 4. The saw-tooth pattern observed by McMillan and Pelloux has since been observed by other investigators, e.g. Mughrabi et al. [10] and Cai and McEvily [11]. The models for striation formation proposed by McMillan
Figure 3. Saw-tooth striations created in the crack propagation sequence ([7] with permission of ASTM).
Figure 4. A model for the creation of saw-tooth type striations ([9] with permission of ASTM).
and Pelloux [7] and by Schijve [9] are generally accepted today. However, the matter of whether or not a crack always advances at an increment per cycle at low K levels has remained unsettled.
In early work, growth by an increment per cycle was supported. For example, Hertzberg and Paris [12] used a replica technique together with an electron mi-croscope and observed agreement between the striation spacings and the average crack growth rate, down to 510 8m/cycle in 2024-T3 aluminum alloy. However,
there was considerable scatter in the striation spacings and, in establishing an average striation spacing, an average of ten replicas was used. Broek and van der Vet [13] obtained a similar correlation in this same alloy down to 3 10 8 m/cycle. But, at lower
crack growth rates, the striation spacing exceeded the average growth rate; a circumstance attributed by them to non-uniform growth along the crack front at low K levels. Broek later observed a correlation between striation spacing and crack growth rates, down to 4 10 8m/cycle in both 2024-T3 and 7075-T6 [14].
Schivje [15], in fact, concluded that \crack extension in principle occurs in every load cycle as a consequence of cyclic slip occurring in every load cycle." More recently, Riemelmoser et al. [16] presented an argument for cycle-by-cycle propagation of fatigue cracks at small stress intensity ranges and attributed a minimum value of striation spacing with decreasing amplitude of stress intensity to a limiting spacing between slip lines.
However, the fact that a fatigue crack should grow cycle-by-cycle at low growth rates is not now a universal view, for evidence has been presented which purports to show that in aluminum alloys and in steel, the growth process is intermittent in nature below a growth rate of 2 10 7 m/cycle. For example, in
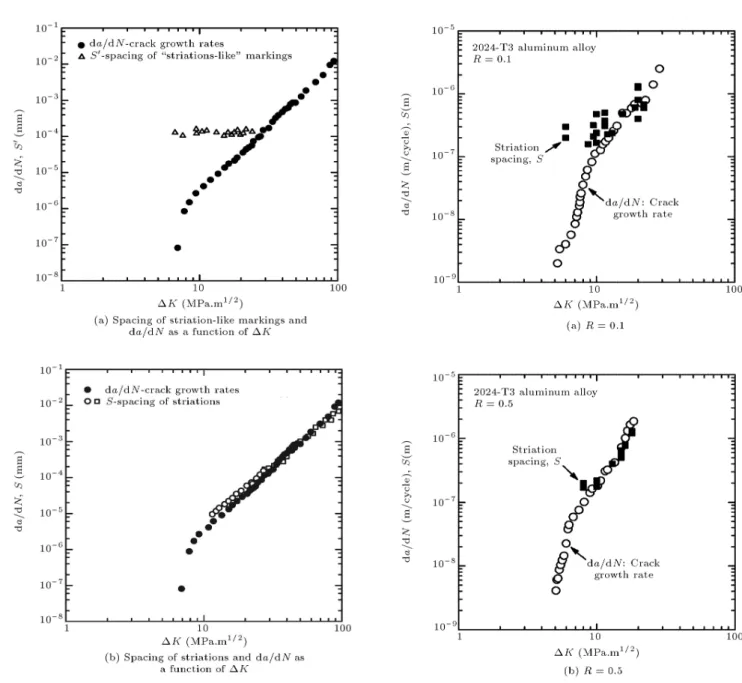
the case of aluminum alloys, Nix and Flower [17] have observed the striation spacing exceeded the fatigue crack growth rate at low K values, as shown in Figure 5. Similar results were obtained by Davidson and Lankford [18] for aluminum alloys and, by Roven and Nes [19] for ductile steel as shown in Figure 6. Note that in the latter case, the markings observed by Roven and Nes were found over the growth rate range of 10 10 to 10 7 m/cycle. Many researchers
who found such results concluded that fatigue crack growth in the lower K range was intermittent, and that thousands of cycles might be required to advance a fatigue crack an additional increment. In passing, we note that the striations shown in Figure 5a do not indicate any signs of wear, as might be expected if the crack front were stationary for a large number of cycles.
In the remaining portion of this paper, the nature of the fatigue crack growth process at low growth rates will be further considered.
Figure 5. (a) The appearance of striations at low K; and (b) A comparison of striation spacings and
macroscopic growth rates in 7010 high strength aluminum alloy (after [17]).
Figure 6. Striation spacing vs. measured crack propagation rate for steel (grain size, d, 11 m). Note the constant striation spacings below da=dN 10 7
m/cycle. Based upon tests conducted at R = 0:5 in laboratory air (after [19]).
EXPERIMENTAL WORK Steel
Fatigue crack growth studies were carried out by Cai [20] at R = 0:05 in air and in a vacuum using 6.35 mm thick compact specimens that had been machined from a plate of normalized 1018 steel. R is the ratio of the minimum to maximum stress in a loading cycle. Thin foils containing portions of the fracture surfaces were examined at a high resolution STEM at 60 kV to obtain images of the fracture surfaces as well as of the underlying dislocation arrays. A stereo-imaging technique was used to analyze the details of the crack prole as a function of the K level.
Figure 7a shows the appearance of striations formed at a growth rate of 5 10 7 m/cycle. Such
striations were present over 50-90% of the fracture surface in this range of crack growth rates. Use of the stereo-imaging technique showed that the striations were of the saw-tooth pattern, with the peaks slightly
Figure 7. Striations and dislocation arrays in 1018 steel ([11] with permission of Elsevier).
rounded, and the opposing sides of the fracture surface mirroring each other. Electron diraction studies of the fracture surface revealed that the average crack growth plane was the f110g, the resultant of simultaneous slip on two f112g in < 111 >. Figure 7b shows the dislocation array beneath the striations shown in Figure 7a, and it can be seen that there is a clear correspondence between striations and dislocation arrays.
The appearance of the fatigue fracture surface which developed at crack growth rates below 1:510 7
m/cycle is shown in Figure 8a. It is characterized by heavy striation-like markings spaced at an interval of about 1:5 10 7 m. The area fraction containing this
type of marking increased rapidly below a growth rate of 10 7 m/cycle, reaching a level of 90% at a growth
rate of 10 9m/cycle. The underlying dislocation array,
which was developed in the low growth rate regime, is shown in Figure 8b. It consists of a cell structure, which is elongated in the direction parallel to the crack front, which is usually < 111 > with the angular rotation across a cell boundary being about 5. It is signicant
that the width of a cell in the direction of fatigue crack propagation is 1:5 10 7 m, exactly the same
spacing as that of the striation-like markings observed in this range. Further, whereas the saw-tooth striation markings were dicult to detect below a growth rate
Figure 8. Striation-like markings in 1018 steel observed at growth rates below 10 7 m/cycle and dislocation cell
structure underlying striation-like markings (with permission of Elsevier [11]).
of 2 10 7 m/cycle, the striation-like markings were
clearly evident.
Figure 9a is a schematic diagram, which indicates the characteristic features of the saw-tooth striations found in 1018 steel. The striation dimensions, a, b and h, identied in Figure 9a and determined by stereo-imaging techniques are shown in Figure 9b. Of particular interest is the fact that, in accordance with our observations of striations, the striation height for 1018 steel goes to zero at a fatigue crack growth rate of the order 10 7 m.
A plot of da=dN as well as the spacing be-tween striation-like markings obtained by Cai [20], as
Figure 9. Characteristics of saw-tooth striations in 1018 steel [20].
a function of K, is shown in Figure 10a. Note that the spacings of these well-dened striation-like markings are just about 10 7 m/cycle (at the growth
rate corresponding to the limit of resolution of the striations). The spacings of the striation-like markings for 1018 steel are similar to those of the spacings shown in Figure 6 for microalloyed steel [19]. Careful exami-nation of the region between the striation-like markings revealed additional markings that were parallel to the crack front at crack growth rates in the interval between 10 8 to 10 7m/cycle. The spacings of these markings
corresponded closely to the average crack growth rate, as shown in Figure 10b. We, therefore, conclude that the markings observed by Roven and Nes [19] were ssures in cell boundaries, not striations.
Figure 10. Comparison of fatigue crack growth rates with fracture surface markings in 1018 steel [20].
Aluminum Alloys
Fatigue crack growth tests were carried out on compact specimens of aluminum alloys 2024-T3 and 2519-T87. Figure 11a shows the results for 2024-T3 tested at R = 0:1. As observed by Nix and Flower [17] and others, at the lower K values, the striation spacings exceed the corresponding da/dN values. However, at R = 0:5, there is better agreement between striation spacings and da/dN values, as a function of K (Figure 11b).
Figure 12 shows the appearance of the fatigue fracture surface in 2024-T3 at a K value of 20 MPa.m1=2 for R = 0:1 in an area where the striations
are well dened. However, the fraction of area in
Figure 11. Comparison of striation spacings and macroscopic growth rates in 2024-T3 aluminum alloy.
Figure 12. Striations in 2024-T3 aluminum alloy (K = 20 MPa.m1=2, R = 0:1, CGD: Crack growth
direction).
which such striations are found varies with the K level as shown in Figure 13. It is important to note that less than 1% of the fracture surface contains striations at a K of 6 MPa.m1=2; a level at which
the striation spacing exceeds the corresponding da/dN value for 2024-T3. Similar results have been obtained by Otsuka et al. [21] for annealed low carbon steels and by Yamagiwa et al. [22] for 2.25Cr-1Mo steel.
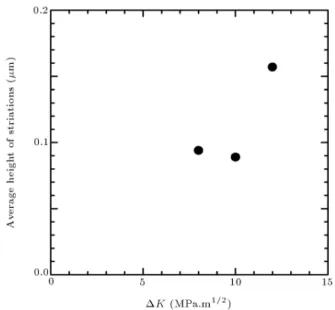
Figure 14 is a plot of the height of the striations for values of 8, 10 and 12 MPa.m1=2. In contrast to
steel, it is not possible to extrapolate to zero height in Figure 14 because of the anomalously high striation spacings at low K. However, the lower limit of resolution in aluminum alloy occurs at a growth rate of 3 4 10 8 m/cycle based upon the observations
of Hertzberg and Paris [12] and Broek and van der Vet [13]. In the present study, it has been found that the corresponding growth rate in steel is higher;
Figure 13. Fraction of striated area as a function of K in 2024-T3 aluminum alloy tested at R = 0:1.
Figure 14. Height of striations as a function of K in 2024-T3 aluminum alloy tested at R = 0:1.
1 2 10 7m/cycle. The dierence may be due to
the dierence in elastic moduli between aluminum and steel.
The cause of the discrepancy between da/dN values and striation spacings diers in comparing steel with aluminum alloy. In the case of steel, striation-like markings were created at cell boundaries. In aluminum, cells did not form. It is signicant that in aluminum alloy at a K of 6 MPa.m1=2, only one
per-cent, perhaps even less, of the fracture surface contains striations. We note that at a K of 6 MPa.m1=2, in
a small region where striations were observed, a ridge ran in the direction of crack propagation, as shown in Figure 15. We propose that this ridge is a barrier to crack propagation and that, at this location, the crack front was temporarily arrested. As the rest of the crack front moved on, the crack opening displacement at the crack arresting point gradually increased until the resistance at the arresting point was overcome. Then, the lagging portion of the crack front moved forward rapidly to join up with the rest of the crack front, giving
Figure 15. Striated region at K = 6 MPa.m1=2in
rise to striations more widely spaced than the average growth rate. Except at the arrest points, the process of fatigue crack growth was cycle-by-cycle in nature. It is noted that at R = 0:5, little, if any, discrepancy exists between the striation spacings and the da/dN values. This may mean that the impediments to crack growth are less eective at high mean stress than at low mean stress.
Eect of the Environment on Striations
It has long been known that if a fatigue crack is grown in a vacuum environment, striations are dicult to observe. For example, for both 1018 steel and 2519-T87 tested in vacuum, striations were not observed. McEvily and Gonzalez [23] observed that the crack tip opening displacement for 304 stainless steel was much larger in vacuum than in air, and proposed that the reason for the absence of striations in vacuum was that, although a striation was created at the crack tip on unloading, it was swept into the crack anks during the next loading cycle as indicated in Figure 16, and so disappeared.
Nix and Flower [17] have noted that two types of striation can form in aluminum alloy 7010-T76 tested in an ambient environment. One is basically a saw-tooth type (Type A [8]), and the other consists of deep slots traversing an essentially at (110) fracture surface (Type B). Type B striations also developed in 2519-T87 and diered considerably in appearance from the Type A striations formed in 2024-T3, as can be seen by comparing Figures 12 and 17. In 2519-T87 [20], the striations resemble more the striations of Laird and Smith [5] (Figure 2), and the Type B striations observed by Nix and Flower for aluminum alloy 7010-T76.
Figure 16. A schematic representation indicating the inuence of the environment on striation formation ([23] with permission of TMS).
Figure 17. Type B striations in 2519-T87 aluminum alloy [20].
Other Considerations
In the above discussion, the term \crack closure" was not mentioned. One might expect that such a phenomenon might aect the appearance of striations, particularly at low R values where closure is most pronounced. Indeed, that is sometimes the case, as, for example, low carbon steel subjected to cyclic loading at R = 1, where the fatigue fracture surface can be polished to a mirror nish due to the repeated contact and sliding of the opposing crack surfaces. In many other cases, however, alteration of the striations does not occur. This is due to the nature of the crack closure. In aluminum alloys, crack closure occurs chiey in the plane-stress region at the specimen surface (plasticity-induced closure). In steels, it occurs throughout the thickness, but only at a number of points comprising a small percentage of the fracture area (roughness-induced crack closure) [24]. Therefore, due to the wedge-opening processes associated with crack closure, crack closure can protect, rather than alter, the appearance of the striations.
CONCLUSIONS
The conclusions reached as a result of this study are: 1. The mechanism of fatigue striation formation is well
established and is based upon the work of Laird and Smith [5], McMillan and Pelloux [7], Schijve [9] and Nix and Flower [17].
2. We have found no evidence, neither in steel nor aluminum alloys, that fatigue cracks propagate other than on a cycle-by-cycle basis.
REFERENCES
1. Zape, C.A. and Worden, C.O. \Fractographic regis-trations of fatigue", Trans. Amer. Soc. Metals, 43, pp.
958-969 (1951).
2. Orowan, E. \Theory of the fatigue of metals", Proc. Roy. Soc. London, A171, pp. 79-106 (1939).
3. Head, A.K. \The growth of fatigue cracks", Phil. Mag., 44(7), pp. 925-938 (1953).
4. Forsyth, P.J.E. and Ryder, D.A. \Fatigue fracture", Aircraft Engineering, 32(4), pp. 96-99 (1960). 5. Laird, C. and Smith, G.C. \Crack propagation in high
stress fatigue", Phil. Mag., 8, pp. 847-857 (1962). 6. Laird, C. \The inuence of metallurgical structure
on the mechanisms of fatigue crack propagation", in ASTM STP 415, Fatigue Crack Propagation, ASTM Conshohocken, PA, USA, pp. 131-168 (1967).
7. McMillan, J.C. and Pelloux, R.M. \Fatigue crack propagation under program and random loads", in ASTM STP 415, Fatigue Crack Propagation, ASTM Conshohocken, PA, USA, pp. 505-535 (1967).
8. Forsyth, P.J.E. \Fatigue damage and crack growth in aluminum alloys", Acta Met., 11(7), pp. 703-715 (1963).
9. Schijve, J. \Discussion", in ASTM STP 415, Fatigue Crack Propagation, ASTM Conshohocken, PA, USA, pp. 533-534 (1967).
10. Mughrabi, H., Prass, P., Christ, H.J. and Puppel, D. \Quantitative study of striations in stage II fatigue crack growth", Proc. NATO Advanced Workshop on Chemistry and Physics of Fracture, R.M. Latanision and R.H. Jones, Eds., Martinus Nijho, Amsterdam, pp. 443-448 (1987).
11. Cai, H. and McEvily, A.J. \On striations and fatigue crack growth in 1018 steel", Mat. Sci. and Engng A, 314(9), pp. 86-89 (2001).
12. Hertzberg, R.W. and Paris, P.C. \Application of elec-tron fractography and fracture mechanics to fatigue crack propagation", Proc. of the First Int. Conf. on Fracture, Sendai, Japan, I, pp. 459-478 (1966). 13. Broek, D. and van der Vet, W.I. \Fatigue crack
propagation", NLR TR 8002U, Amsterdam (1967).
14. Broek, D. \The eect of intermetallic particles on fatigue crack propagation in aluminum alloys", in Fracture 1969, Chapman and Hall, pp. 754-764 (1969). 15. Schijve, J. \Signicance of fatigue cracks in micro-range and macro-micro-range", in ASTM STP 415, Fatigue Crack Propagation, ASTM Conshohocken, PA, USA, pp. 415-459 (1967).
16. Riemelmoser, F.O., Pippan, R. and Stuwe, H.P. \An argument for cycle-by-cycle propagation of fatigue cracks at small stress intensity range", Acta Met. and Mater., 46(5), pp. 1793-1799 (1998).
17. Nix, K.J. and Flower, H.M. \The use of electron optical techniques in the study of fatigue in high strength aluminium alloy 7010", in Materials, Experimentation and Design in Fatigue (Proc. Fatigue'81), Westbury House, Surrey, UK, pp. 117-126 (1981).
18. Lankford, J. and Davidson, D.L. \Fatigue crack mi-cromechanisms in ingot and powder metallurgy 7xxx aluminum alloys in air and vacuum", Acta Met., 31(8), pp. 1273-1284 (1983).
19. Roven, H.J. and Nes, E. \Cyclic deformation of ferritic steel-II. stage II crack propagation", Acta Met. and Mater., 39(8), pp. 1735-1759 (1991).
20. Cai, H. \The mechanisms of fatigue crack growth in 1018 steel", PhD Dissertation, University of Connecti-cut (1995).
21. Otsuka, A., Mori, K. and Kawamura, T., Transac-tions of the Japan Society of Mechanical Engineers, A45(11), pp. 1312-1322 (1979).
22. Yamagiwa, K., Izumi, S. and Sakai, S. \Detecting method of striation region of fatigue fracture surface using wavelet transform", Journal of the Society of Materials Science, Japan, 53(3), pp. 306-312 (2004). 23. McEvily, A.J. and Gonzalez, J. \Fatigue crack
defor-mation processes as inuenced by the environment", Met. Trans., 23A(8), pp. 2211-2221 (1992).
24. McEvily, A.J. \On the cyclic crack-tip opening dis-placement", Fat. Fract. Engng Mater & Struct., 32(3), pp. 284-285 (2009).

![Figure 4. A model for the creation of saw-tooth type striations ([9] with permission of ASTM).](https://thumb-us.123doks.com/thumbv2/123dok_us/8397853.2231189/2.892.469.782.826.1108/figure-model-creation-tooth-type-striations-permission-astm.webp)

![Figure 7. Striations and dislocation arrays in 1018 steel ([11] with permission of Elsevier).](https://thumb-us.123doks.com/thumbv2/123dok_us/8397853.2231189/4.892.65.405.155.333/figure-striations-dislocation-arrays-steel-permission-elsevier.webp)
![Figure 17. Type B striations in 2519-T87 aluminum alloy [20].](https://thumb-us.123doks.com/thumbv2/123dok_us/8397853.2231189/7.892.122.404.829.1093/figure-type-b-striations-t-aluminum-alloy.webp)
