Development of Management Schemes
in Irrigation Planning: Economic
and Crop Pattern Consideration
M. Karamouz
1;, A. Ahmadi
2and S. Nazif
3Abstract. Increasing population has dramatically increased the request for agricultural products. In addition, lands and water resources with suitable quality are limited. Therefore, optimal allocation of limited resources to dierent demands has become very important in recent years. In this study, a model is developed to optimize a water resources allocation scheme considering the conjunctive use of surface water and groundwater resources, as well as determining a suitable crop pattern. The economic objective function of the optimization model is to maximize the net benet, considering the water pumping cost, crop cultivation cost and the benet of total crop production during the study time horizon. The eect of a marginal water decit in the reduction of crop yield and water table uctuations are considered. A genetic algorithm is used to solve the optimization model. The proposed model is applied to the Varamin plain to determine the optimal crop mix and water allocation from surface and groundwater. In order to evaluate the results of the model, the performance indices are calculated. The eect of imposed policies on the crop pattern is investigated through the denition of two scenarios and the results are compared. Also, the potential of the study area, for applying decit irrigation strategies using economic analysis, is investigated.
Keywords: Conjunctive use; Water allocation; Optimization model; Crop pattern; Genetic Algorithm; Water pricing.
INTRODUCTION
Surface and groundwater conjunctive use and land use planning are vital and unavoidable tasks due to increasing water demand for food growth and the limitation of water resources with acceptable quality and quantity. It is necessary to achieve maximum returns from cropping activities and to resolve the problems of water-logging and water table depletion.
System analysis tools have been utilized in the work of Male and Mueller [1], Watkins and McKin-ney [2], Belaineh et al. [3], Reca et al. [4] and Benli and Kodal [5] for resource allocation and economic analysis.
1. School of Civil Engineering, University of Tehran, Tehran, P.O. Box 11365-4563, Iran; and Polytechnic Institute of NYU, Brooklyn, NY, USA.
2. Department of Civil Engineering, Isfahan University of Tech-nology, Isfahan, Iran.
3. School of Civil Engineering, University of Tehran, Tehran, P.O. Box 11365-4563, Iran.
*. Corresponding author. E-mail: [email protected]
Received 1 December 2008; received in revised form 13 June 2009; accepted 28 September 2009
The planning of conjunctive use has been attended to by many researchers, such as Onta et al. [6], Latif and James [7], Reichard [8], Singh et al. [9], Karamouz et al. [10] Syaukt and Fox [11] and Vedula et al. [12].
Besides planning for water allocation, many at-tempts have been devoted to optimizing crop pattern conguration. Karamouz et al. [13] developed a sys-tematic approach to surface and groundwater resource allocations in a study area, considering the eect of crop pattern on irrigation water demand. Khare and Ediwahyunan [14] analyzed the feasibility of conjunc-tive use management using a linear optimization model. A simple economic-engineering optimization model is presented to explore the possibilities of the conjunctive use of surface and groundwater with hydrological and management constraints, and to arrive at an optimal cropping pattern for the optimal use of water resources for the maximization of net benets. Sethi et al. [15] developed two deterministic linear programming and chance-constrained linear programming models to allo-cate available land and water resources optimally on a seasonal basis, so as to maximize the net annual return
from the study area, considering the net irrigation water requirement of crops as a stochastic variable.
Recently, more attention has been given to soft computing techniques, such as Evolutionary Algo-rithms (EA) and, principally, Genetic AlgoAlgo-rithms (GA). Genetic Algorithms are search algorithms based on the mechanism of natural selection and natural genetics. GA modeling is gaining importance because of its robust random search capability and near global optimal values. It originated in the mid 1970s [16] and emerged as a powerful optimization approach. An excellent introduction to GA is given by Goldberg [17], and several other investigators have summarized the essentials of genetic algorithm modeling. GA optimiza-tion methods have been employed in dierent elds of water resources management, such as Kerachian and Karamouz [18], Afshar and Marino [19], Afshar [20] and Karamouz et al. [21].
Raju and Kumar [22] used GA techniques to evolve an ecient cropping pattern for maximizing benets for an irrigation project in India. Constraints include a continuity equation, land and water require-ments, crop diversication and restrictions on storage. Wu et al. [23] developed optimal strategies to balance the need for discharge of sucient groundwater for irrigation with the need to improve the local environ-ment by managing the water table uctuation. Two simulation-optimization models have been formulated and a Genetic Algorithm (GA) is applied to search for the optimal groundwater development strategies [24]. A methodology for the conjunctive use of surface and groundwater resources is developed using a combina-tion of GA and Articial Neural Networks (ANN) as groundwater response functions. Water supplies on agricultural demand, reduction of pumping costs and the control of groundwater table uctuations are considered in the objective function of the optimization model.
In this study [13], work is extended to include the decit irrigation potential. The strategic policies on crop pattern are also considered as a constraint in the model formulation and a management scheme is developed. In this paper, the feasibility of the con-junctive use is evaluated and a GA-based optimization model has been developed for maximizing net bene-ts under various physical and economic constrainbene-ts. The proposed model is utilized to obtain an optimal water allocation and crop pattern in the Varamin plain. Then, the eects of regulatory limitations on the optimum crop patterns are assessed. For this purpose, a scenario is dened, addressing the restrictive policies to maintain a minimum level of a strategic crop. For evaluating the model performance in the dened scenarios, performance indices, namely relia-bility, resiliency and vulnerability have been calculated and the results are compared. The paper is organized
as follows: First, the structure of the proposed model is presented. Then, the description of a case study is given, and the results of the implementation of the proposed model are discussed. Finally, a summary and a conclusion are provided.
Methodology
In this paper, an optimization model is developed to determine the optimum crop pattern and water allocation for maximizing net benet. The net benet is equal to the dierence between the benet of selling crops and crop production costs, which include the pumping cost from surface and aquifer water and the cost of cultivation. The variation of the groundwater table is calculated based on a continuity equation considering the return ow of agricultural lands to the aquifer. Monthly water table uctuation and their ultimate value at the end of the planning time horizon are considered as constraints in determining optimal groundwater allocation. The variation of monthly water demand in a region during the study horizon has been considered. The crop yield is calculated based on the supplied portion of water demand considering crop sensitivity to water decit. A genetic algorithm is used as the optimization technique, via its ability in the problems with a high number of decision variables and nonlinearity.
Structure of Optimization Model
The main objective of the proposed model is to maximize the dierence between the gross benet of crop production and the pumping from surface and groundwater and their associated cultivation costs. In the proposed optimization model, water allocations from surface and groundwater during each month of the time horizon planning, as well as a xed crop pattern mix for the planning period, are decision variables. The structure of the proposed optimization model consists of two parts: costs of crop production and water supply (C) and the gross benet of crop cultivation (B) ($). The structure of the optimization model for a region during y years is as follows:
max Z = B C; (1)
C =
y
X
t=1 m
X
k=1
Gtk Htk hrtk
3:67 10 4 pr
+Stk Htk0 hr0tk
0 3:67 10 4 pr
!
+
y
X
t=1 c
X
p=1
B =
y
X
t=1 c
X
p=1
(Y apt Tp p A); (3)
where Z is net income ($); Gtk is the volume of
groundwater withdrawal from wells in month k and year t (MCM), Stk is the volume of surface withdrawal
from a river in month k and year t (MCM); Htk and
H0
tk are depth of groundwater table and pumping head
from the river in month k and year t (m), respectively; pr is the price of electricity for water pumping from groundwater and surface water ($), respectively; and 0 are pumping eciencies for groundwater and
surface water (%); hrtk and hr0tk are total number of
hours of pumping from groundwater and surface water, respectively, in month k and year t; Y aptis the actual
yield for crop p in year t (Kg/ha/yr); TP is price of
crop p ($/Kg); p is percentage of allocated area for
crop p (%); A is agricultural area (ha); cos tpt is the
xed cost of crop p in year t for agricultural acts, such as, preparing land, pesticide, herbicide, labor etc. ($); n is the total number of crops in the region; y is the total number of years in the planning horizon; and m is the total number of months.
The constraints of the proposed model are formu-lated as follows:
1. Summation of areas under dierent crop production should be equal to the total area that could be utilized.
n
X
p=1
p= 1: (4)
2. Groundwater uctuations are calculated using the water continuity equation for the aquifer (Equa-tion 5). The amount of return ow () is assumed to be equal to thirty percent of the total allocated water to the lands. This value is determined based on the data in the hydrometric stations and expert opinion. The maximum of monthly and total water table uctuations should be less than the maximum allowable downward presented in Equations 6 and 7, respectively:
Htk=( (Stk+ Gtk) Gtk GDtk+ Chtk)
100=(Ss A);
k = 1; ; m; t = 1; ; y; (5)
jHtkj H max;
k = 1; ; m; t = 1; ; y; (6)
y
X
t=1 m
X
k=1
Htk< total H; (7)
where Htkis the water table uctuation in month
k and year t (m); Chtk is the aquifer recharge in
month k of year t (MCM); GDtkis aquifer discharge
through drainage in month k of year t (MCM); Ss is the storage coecient of the aquifer; H max is maximum monthly allowable uctuation of water table (m); and total H is the maximum of the cumulative allowable water table uctuations in the planning horizon (m) (5 m in this study).
3. The amount of the crop yield is a function of allocated water to the crops. A production function developed by Dorenbos and Kassam [25] which considers the relation between actual and poten-tial evapotranspiration is used. Ghahraman and Sepaskhah [26] extended the Dorenbos and Kassam function [25], as shown in Equation 8, based on allocated water and crop water demand.
Ya
Ym
pt= f
Y
i=1
1 Kyi
1 AllocateW D i
i
;
(8) where f is the number of stages for crop growth; (Ya)pt and (Ym)pt are crop yield and potential
crop production of crop p in year t (Kg/ha/yr), respectively; W Di is water demand in month i
(MCM); Allocatei is the allocated water in month
i (MCM); and Kyi is crop sensitivity to the water
decit in month i. This equation is applied for each crop to estimate annual yield.
Genetic Algorithm
Considering the non-linear and the complex objective function of the optimization model and the large number of decision variables, the genetic algorithm is used to solve the optimization model. The genetic algorithm is an adaptive method trying to imitate biological and genetic processes and can successfully be applied to optimization problems.
GA is a population of individuals, named chro-mosomes. Each chromosome represents a potential solution to a problem. This solution is evaluated by its tness function. As each chromosome represents a potential solution, the tness of each chromosome, as a candidate solution, should be evaluated by a random search process to form the decision space. Through successive generation, tness should progressively be improved towards an optimum solution. The new population is generated using the genetic operators including selection, crossover and mutation. Genetic algorithms usually consist of the following steps: 1. Encoding of the decision variables and placing them
in a chromosome: Although binary encoding is the most common method among other encoding approaches in this study, real value encoding is
used. In binary encoding, the discretization of state variables is usually required. In the case of a large number of state variables, the length of each chromosome and, therefore, the convergence time, will be long. But, in real value encoding, the discretization of state variables and the decoding process is not required and, thus, will provide the optimal solutions with more precision and lower computational time.
2. Creating an initial population (rst generation): The initial population is generated through a ran-dom procedure.
3. Determination of tness for every chromosome in the current population (tness evaluation).
4. Selecting the chromosomes as the parents for gen-eration of the next population: Several approaches have been proposed for a selection operator, such as the Roulette Wheel and Tournament methods. The selection operator can aect the convergence and run time of the method and maintain the diversity of the population in each generation. In this study, the Tournament selection method is used.
5. Setting the probabilities for crossover: Crossover operators randomly take one pair that perform well from the mating pool and by exchanging important building blocks between two strings, a new pair is obtained. Crossover occurs between two selected strings with a specic probability (Pc). A one point crossover, which has been selected for this study, randomly chooses a position in the string and new chromosomes are obtained by swapping all Genes after the position.
6. Performing mutation for selected chromosomes: Mutation is an important process that can provide diversity and new genetic information to the popu-lation and prevent premature convergence to local optimal solutions. The mutation operator changes the Gen value randomly in the range of variation, which is usually considered as a percentage of the maximum range of Gen variation.
7. Repeating steps 3-6 until nding the optimal or near optimal solutions.
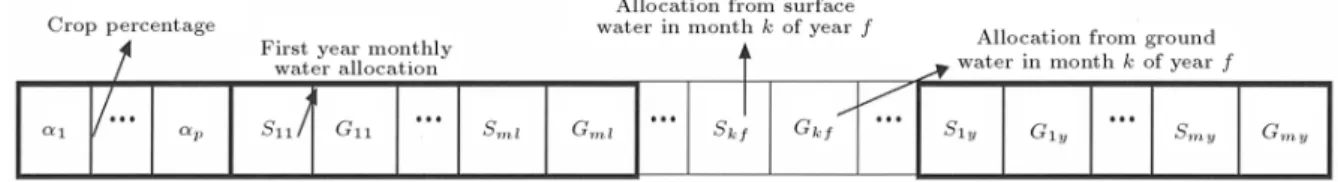
More details of genetic algorithms can be ob-tained in the works of Michalewicz [27] and Gen and
Cheng [28]. The schematic of one chromosome used in the GA model in the proposed optimization model is shown in Figure 1. The number of genes in a chromosome for a y-year planning horizon with P dominant crops is equal to P + 2 m y. The rst set of P genes presents the percentage of each crop in the plain. The remaining genes are lled with the amount of allocated water from the surface and groundwater resources for m months of y years.
Evaluation of System Performance
In order to evaluate the results of the optimization model in real time operation, certain performance criteria are utilized. Hashimoto et al. [29] described systems performance from three dierent viewpoints: 1. How often the system succeeds (reliability); 2. How quickly the system returns to a satisfactory
state once a failure has occurred (resiliency); 3. How signicant the consequences of failure are
(vulnerability).
The appropriate denition for performance indices depends on the main issues and the objectives of the planning. In a denition of these indices, the operational status of water resources systems can be classied as satisfactory (in this case, supplying water demand) and unsatisfactory or a failure (shortage in supplying water demand). The system status in time period t is expressed by the stochastic variable, Xt.
It is a member of the S set if it belongs to a set of satisfactory outputs otherwise it is included in set F , which is the set of all unsatisfactory outputs [30]. In this case, when the allocated water is equal to or greater than water demand, no failure occurs, otherwise failure occurs.
Reliability is the probability that no failure occurs within a specied period of time:
= Pr[Xt2 S]; 8t: (9)
In other words, reliability is the probability that no failure occurs within the planning horizon. Based on the above denition, in this study, it is a measure of the system performance in supplying the water demand
and it is estimated as: =
T
P
i di
T (
di= 1 if (Allocatei W Di)
di= 0 otherwise (10)
where (reliability) is dened as the number of months supplying water demand out of total months (T ) in the planning horizon, and diis a binary variable indicating
the state of supplying water demand.
Resiliency describes how quickly a system re-covers from failure, once failure has occurred. The resiliency of the system can be dened in the planning horizon as follows:
= PrfXt+12 SjXt2 F g: (11)
According to Equation 10, resiliency is basically a measure of satisfactory condition duration.
=
T
P
i ei
T PT
i di
(
ei= 1 if (di 1= 0 and di= 1)
ei= 0 otherwise (12)
where (resiliency) is the ratio of failure months followed by a satisfactory state, out of total months with non-supplying water demand.
Vulnerability measures the magnitude of a fail-ure. In water supply systems, vulnerability can be de-ned as the total shortage volume during the planning horizon. This index is formulated as follows:
=XT
i
Vi
(
Vi= 0 if (Allocatei W Di)
Vi= (Allocatei W Di) otherwise (13)
where Viis the distance of the current system situation
from the desired situation (MCM). CASE STUDY
The Varamin plain, located in the eastern part of the Tehran metropolitan area in Iran, has been considered as the case study. In this plain, the precipitation
is partially aected by Mediterranean systems in the winter and warm Arabian systems in the summer. The average amount of precipitation in the Varamin plain is about 131.4 millimeter per year and the temperature varies from -14.4 to 45.5C. The minimum
and maximum relative humidity values are 15 and 75 percent in summer and winter, respectively.
The surface water resources of Varamin are lim-ited to the Jajrud and Shoor River ows in the west and north of the plain, respectively (see Figure 2). Table 1 shows the average monthly discharge of the Jajrud and Shoor rivers upstream of the Varamin plain and also the average monthly agricultural water demand under existing conditions. There are 5 dominant crops in this plain, namely; wheat, barley, cucumber, tomato and maize (corn) and the irrigation eciency is 39% based on local investigations. Eleven years of available data regarding river discharges in the Varamin plain have been utilized in the optimization model.
Even though there are fertile lands and enough water resources in the case study, the crop yield is less than the crop production potential. This might be because of the allocation of surface and groundwater without considering an appropriate scheme of
con-Figure 2. The rivers resources of Varamin plain.
Table 1. Average monthly discharge of Jajroud and Shour Rivers at the upstream of the Varamin plain. Average Monthly (MCM)
Oct. Nov. Dec. Jan. Feb. Mar. Apr. May June July Aug. Sept. River Jajroud 6.1 11.45 12.91 11.25 14.89 29.58 58.79 56.47 21.65 4.78 4.55 2.16 Discharge Shour 8.27 20.68 28.56 22.26 24.53 23.92 22.99 21.22 5.93 3.69 0.74 1.42 Water Demand 57.66 69.26 17.31 3.06 7.21 29.20 55.52 42.91 9.13 5.73 12.39 32.06
junctive use. Therefore, developing optimal temporal schemes for allocation from both resources are the chal-lenges of irrigation planning in the case study, which could improve agricultural net benet and restore the aquifer water table in the region.
The total number of decision variables of the proposed model for the Varamin plain is 5 (number of dominate crops) + 2 (water resources) 12 (number of months) 11 (number of years) = 269. The proposed model is applied to the case study without considering the minimum required wheat cultivation as a state/province policy. It is called Scenario A.
Constraints related to economic and social limita-tions are also considered in order to comply with some strategic policies of the region. Scenario B is dened based on these policies. The results of the GA-based optimization model include the percentage of dierent allocated crop coverage areas, surface and groundwater allocations, monthly water table uctuations and accu-mulated water table variations. In the GA method, the initial population size, crossover and mutation proba-bilities are the main parameters of the optimization model that are selected by trial and error in this study. The related initial population size, the values of crossover and mutation probabilities are equal to 100, 0.9, and 0.003, respectively. The program terminates by reaching 10000 iterations and the proposed model is written in the Fortran environment. The performance of the proposed water allocation scheme is evaluated through reliability, resiliency and vulnerability indices. RESULTS
At rst, the proposed optimization model was im-plemented for determination of a water allocation scheme and a crop pattern conguration in the case study. In order to investigate the eect of strategic constraints on the optimal crop pattern, Scenario B is evaluated. The results of both scenarios (A and B) are discussed in the following sections. In order to optimize crop pattern conguration, an economic analysis is employed considering decit irrigation, and the results of a variation of crop mix are discussed. Results of Scenario A
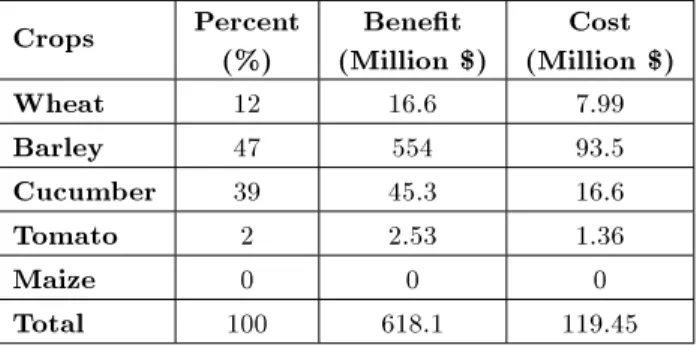
The proposed model has been applied to the Varamin plain to determine the optimal pattern of dominant crops. An obtained optimal crop pattern of a base scenario is presented in Table 2. In this scenario, the coverage area of barley and cucumber, which have high yield with low water demand, has increased to improve the region income.
Components of the objective function including the benet and cost corresponding to the optimal crop pattern are presented in Table 3. The maximum
Table 2. Components of objective function in Scenario A Crops Percent
(%)
Benet (Million $)
Cost (Million $) Wheat 12 16.6 7.99 Barley 47 554 93.5 Cucumber 39 45.3 16.6 Tomato 2 2.53 1.36
Maize 0 0 0
Total 100 618.1 119.45
fraction of cost is obtained through wheat cultivation, out of optimal crop patterns. As shown in Table 3, cucumber is the most benecial crop, although its cultivation has considerable cost. The total benet of the optimal option is about (Million $) 440, while the benet of the existing condition is about (Million $) 79. Investigation of the optimal water allocation scheme, in comparison with water demand variation during eleven years of the study period (Figure 3), shows that in certain months, when surface water is more than water demand, the preference option in water allocation is surface water. However, in some months with low demand, for avoiding the water table increasing beyond the desired level, the total allocated water exceeds demand. The reliability, resiliency and vulnerability of supplying water demand are calculated as 50.0%, 36.4% and 24.1 MCM/month, respectively.
In practice, there are some strategic constraints in addition to economic considerations, which govern the practical optimal crop pattern. The eects of the considered constraints on optimal water allocation and crop pattern are discussed in the next sub-sections. Results of Scenario B
As mentioned in the base scenario analysis, if eco-social constraints are not considered in determining
Figure 3. Comparison of water demand and allocation in Scenario A.
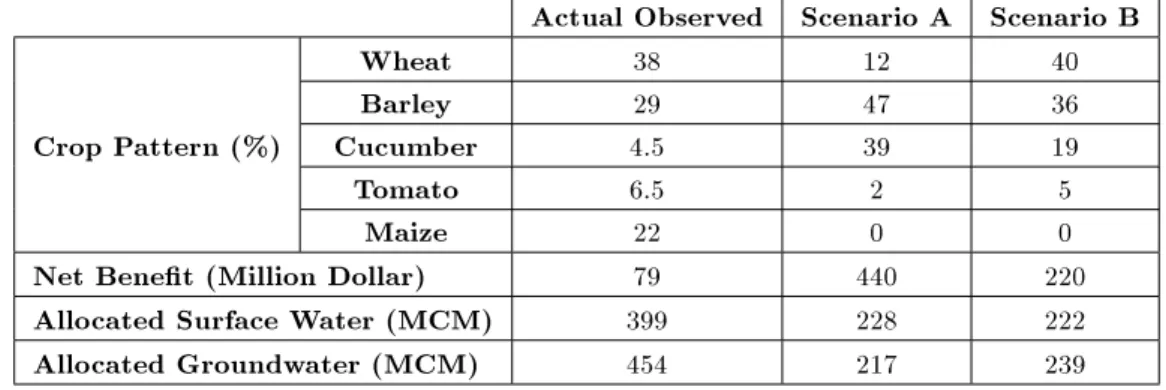
Table 3. Crop pattern, net benet and allocated surface and groundwater in observed condition and Scenarios A and B. Actual Observed Scenario A Scenario B
Wheat 38 12 40
Barley 29 47 36
Crop Pattern (%) Cucumber 4.5 39 19
Tomato 6.5 2 5
Maize 22 0 0
Net Benet (Million Dollar) 79 440 220 Allocated Surface Water (MCM) 399 228 222 Allocated Groundwater (MCM) 454 217 239
the optimum crop pattern, the optimization problem may result in non-practical solutions. For instance, as can be seen in the results of the base scenario (Table 2), strategic crop coverage, such as wheat, decreases signicantly.
To achieve a practical solution, these restric-tions are incorporated into the optimization problem through utilizing new constraints. In the second scenario, the minimum crop coverage area of wheat is set equal to 40%. In this scenario, extra constraint is added to the optimization model as follows:
1>= 0:4; (14)
where 1 is the percentage of crop 1 (wheat). The
results of water allocation, cumulative and monthly variations of a water table for this scenario and the base scenario are shown in Figures 4 to 7. As can be seen in Figures 4 and 5, by imposing the wheat area to be more than 40 percent, maximum monthly water demand increases from 205 MCM to 260 MCM (about 25%) and the reliability of supplying water demand has decreased to 45% from about 50% in the base scenario. The resiliency and vulnerability of supplying water demand are calculated as 38.3% and
Figure 4. Comparison of water demand and allocation in Scenario B.
26 MCM/month, respectively. These results show that the performance of the model under Scenario B is not as good as Scenario A.
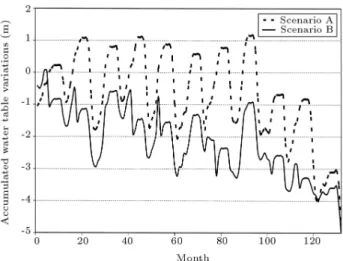
Regarding Figures 4 and 6, groundwater draw-down increases in this scenario, in comparison with Scenario A, and its cumulative variation are negative, with respect to the water table at the start of the operation (level zero). However, uctuations of water table have the same behavior in both scenarios, because the objective function of the optimization model is economic-based and the groundwater table variations are considered as a constraint. Therefore, two scenarios have similar groundwater table variations to use total available water resources for achieving the maximum net benet.
The optimal crop coverage for Scenario B and the base scenario are presented in Table 3. The net benet of the optimal crop pattern in this scenario is about 220 Million Dollars, which is about 50% of the maximum possible benet of Scenario A. It shows that governmental policies could signicantly aect income and these policies should be established considering their eco-social results.
The dierent temporal distributions of water
de-Figure 5. Comparison of monthly groundwater table variations in Scenarios A and B.
Figure 6. Comparison of cumulative groundwater table variations in Scenarios A and B.
Figure 7. Benet variation versus crop coverage in Scenario A.
mand and surface water availability make the ground-water a major part of the ground-water resources supplying the water demand. As can be seen in Table 3, the percent-age of surface and groundwater for supplying the water demand is about 50%, which shows the signicance of the conjunctive use of surface and groundwater in the study region.
The net benet of Scenario B is about three times more than the net benet of 11 years of cultivation in the study area (about $79 Million). The annual allocated water to the agricultural area in Scenario B is about 461 MCM, compared with 853 MCM during the historical periods. Also, in order to increase the prot, barley and cucumber areas have been increased rather than the existing crop pattern, and maize is classied as a non-economical crop. This shows that the optimal crop pattern and water allocation obtained by the optimization model in Scenario B is more ecient than the existing operation scheme.
The proposed model could be expanded for multi-plain, multi-water resources and new crop pattern
conguration. In order to achieve a better management scheme for groundwater table variations, some adjust-ments on objective function and constraints related to the groundwater table variation are needed. Also, developing a groundwater simulation model for estima-tion of water table uctuaestima-tions could help vericaestima-tion of the results.
Decit Irrigation Potential
The physical environment can be a major limiting fac-tor in the growth, productivity and survival of plants. Water stress is usually the main physical limitation to crop yield. The design of irrigation schemes does not address situations in which moisture availability is the major constraint on crop yield. However, in arid and semi-arid regions, increasing water demands are necessitating major changes in irrigation management and scheduling in order to increase the eciency of water allocation in agriculture.
Therefore, innovations are needed to increase the eciency of water use. An option is decit irrigation with plants exposed to certain levels of water stress during either a particular growth period or throughout the whole growth season without signicant reduction in yields. Decit irrigation practices dier from tra-ditional water supply practices. The manager needs to know the level of allowable transpiration deciency without a signicant reduction in crop yield. The main objective of decit irrigation is to increase the water use eciency of a crop by eliminating irrigation that has little impact on yield. The resulting yield reduc-tion may be small compared with the benets gained through diverting the saved water to irrigate other crops for which water would normally be insucient under traditional irrigation practices.
Before implementing a decit irrigation program, it is necessary to know crop yield responses to water stress, either during dened growth stages or through-out the whole season [31]. The crop yield response factor (Ky in Equation 8) varies depending on species,
variety, irrigation method and management practices, and the growth stage when decit evapotranspiration is imposed. The crop yield response factor gives an indication of whether the crop is tolerant to water stress. A response factor greater than unity indicates that the expected relative yield decrease for a given evapotranspiration decit is proportionally greater than the relative decrease in evapotranspiration [32]. The most resistant plants to water stress, with a short critical growth stage and high yield potential under normal irrigation, such as tomato and barley, should be selected to exercise decit irrigation schemes. Me-teorological parameters, such as average variations of annual weather humidity, temperature and evaporation in water decit scheduling should be considered.
In order to investigate the possibility of decit ir-rigation in the Varamin plain, the optimal crop pattern obtained from Scenario A is considered for determining water demand. The benet of the cultivation of each crop is estimated using the yield function presented in Equation 8. By assuming a xed water allocation and crop pattern mix, the percentage of the cultivated area is changed to obtain the maximum income. The variation of net income vs. changes of cultivated area, rather than the existing condition, is presented in Figure 7. The results show that, if the existing crop area of about 58000 ha decreases by 50%, then the maximum benet will be obtained. As can be seen in Figure 7, water stress under the existing condition is more than the threshold limit of the crops resulting in a 44% decrease in net income. Therefore, it is suggested to reduce the cultivated area for less water stress and increased income.
Although economically benecial, this strategy may lead to adverse social impacts, such as the migra-tion of locals due to less job opportunities. Therefore, further studies are needed for determination of the optimal cultivated area in the region considering social and cultural factors.
SUMMARY AND CONCLUSION
In this study, an optimization model for determination of optimal crop patterns and water allocation has been developed. The objective function of this model is to maximize net income with a conjunctive use of surface and groundwater, considering the eects of a marginal water decit in the reduction of crop production. The constraints include allowable monthly and cumulative water table variations and the irrigation land available for crop cultivation. Two scenarios are developed for the evaluation of regional policies on crop patterns in the study area. The scenarios are compared based on the system performances indices including reliability, resiliency and vulnerability. The results show that the model without any imposed minimum crop pattern limitation (Scenario A) provides more income, but social and economic aspects should be considered as constraints in suggesting crop pattern conguration (Scenario B). In this way, Scenario A provides more net benets than the constrained model by up to 50%. In Scenario B, the areas of non-economical crops increase because of some socio-political considerations. Also, the possibility of decit irrigation application in the study region is evaluated. The results show that because the region is under water stress under the existing condition, reducing crop coverage will increase net income. Although the economic analysis shows that reducing the cultivated area could boost net income, social and cultural adverse consequences could follow.
ACKNOWLEDGMENTS
This study was partially supported by a grant from the Management and Planning Organization of Iran in a project entitled \Optimal Water Use in the Agricultural Sector of Tehran Province".
REFERENCES
1. Male, J.W. and Mueller, F.A. \Model for prescrib-ing groundwater use permits", Journal of Water Re-source Planning and Management, 118(5), pp. 543-561 (1992).
2. Watkins, Jr., D.W. and McKinney, D.C. \Decomposi-tion methods for water resources optimiza\Decomposi-tion models with xed costs", Advances in Water Resources, 21(4), pp. 283-295 (1998).
3. Belaineh, G., Peralta, R.C. and Haghes, T.C. \Sim-ulation/optimization modelling for water resources management", Journal of Water Resource Planning and Management, 125(3), pp. 154-161 (1999). 4. Reca, J., Roldan, J., Alcaide, M., Lopez, R. and
Ca-macho, E. \Optimization model for water allocation in decit irrigation systems I. Description of the model", Agricultural Water Managemet, 48(2), pp. 103-116 (2001).
5. Benli, B. and Kodal, S. \A non-linear model for farm optimization with adequate and limited water supplies: Application to the south-east Anatolian project (GAP) region", Agricultural Water Managemet, 62(3), pp. 187-203 (2003).
6. Onta, P.R., Gupta, A.D. and Harboe, R. \Multi-step planning model for conjunctive use of surface and groundwater resources", Journal of Water Re-source Planning and Management, 117(6), pp. 662-678 (1991).
7. Latif, M. and James, L.D. \Conjunctive use to control water logging and salinization", Journal of Water Resource Planning and Management, 117(6), pp. 611-628 (1991).
8. Reichard, E.G. \Groundwater surface water man-agement with stochastic surface water supplies: A simulation optimization approach", Water Resource Research, 31(11), pp. 2845-2865 (1995).
9. Singh, D.K., Jaiswal, C.S., Reddy, K.S., Singh, R.M. and Bandarkar, D.M. \Optimal cropping pattern in a canal command area", Agricultural Water Managemet, 50(6), pp. 1-8 (2001).
10. Karamouz, M., Kerachian, R. and Zahraie, B. \Monthly water resources and irrigation planning: A case study of conjunctive use of surface and ground-water resources", J. Irrig. Drain. Eng., 130(5), pp. 391-402 (2004).
11. Syaukt, S. and Fox, G.C. \Conjunctive surface and groundwater management in the Jakarta region of Indonesia", Journal of the American Water Resource Association, 40(1), pp. 241-250 (2004).
12. Vedula, S., Mujumdar, P.P. and Sekhar, G.C. \Con-junctive use modeling for multicrop irrigation", Agri-cultural Water Managemet, 73(3), pp. 193-221 (2005). 13. Karamouz, M., Zahraie, B., Kerachian, R. and Eslami, A. \Cropping pattern and conjunctive use manage-ment: A case study", Irrigation and Drainage, 57, pp. 1-13 (2008).
14. Khare, D. and Ediwahyunan, M.K. \Assessment of conjunctive use planning options: A case study of Sapon irrigation command area of Indonesia", Journal of Hydrology, 328(3-4), pp. 764-777 (2006).
15. Sethi, L.N., Panda, S.N. and Nayak, M.K. \Optimal crop planning and water resources allocation in a coastal groundwater basin, Orissa, India", Agricultural Water Managemet, 83(3), pp. 209-220 (2006). 16. Holland, J.H., Adaptation in Natural and Articial
Systems, University of Michigan Press, Cambridge Mass (1975).
17. Goldberg, D.E., Genetic Algorithms in Search, Op-timization and Machine Learning, Addison Wesley, Reading, Mass (1989).
18. Kerachian, R. and Karamouz, M. \Waste-load alloca-tion model for seasonal river water quality manage-ment: Application of sequential dynamic genetic algo-rithms", Scientia Iranica, 12(2), pp. 117-130 (2005). 19. Afshar, M.H. and Marino, M.A. \A Convergent genetic
algorithm for pipe network optimization", Scientia Iranica, 12(4), pp. 392-401 (2005).
20. Afshar, M.H. \Application of a genetic algorithm to storm sewer network optimization", Scientia Iranica, 13(3), pp. 234-244 (2006).
21. Karamouz, M., Moridi, A. and Fayyazi, H.M. \Dealing with conict over water quality and quantity alloca-tion: A case study", Scientia Iranica, 15(1), pp. 34-49 (2008).
22. Raju, S.K. and Kumar, N.D. \Irrigation planning us-ing genetic algorithm", Water Resources Management, 18(2), pp. 163-176 (2004).
23. Wu, J., Zheng, L. and Depeng, L. \Optimizing ground-water development strategies by genetic algorithm: A
case study for balancing the needs for agricultural irrigation and environmental protection in northern China", Hydrogeology Journal, 15(7), pp. 1265-1278 (2007).
24. Karamouz, M., Tabari, M.M.R. and Karachian, R. \Conjunctive use of surface and groundwater re-sources: Application of genetic algorithms and neural networks", Water International, 32(1), pp. 163-176 (2007).
25. Dorebbos, H. and Kassam, A.H., Yield Response to Water, Irrigation and Drainage Paper, FAO., 33, 193 p. (1979).
26. Ghahraman, B. and Sepaskhah, A.R. \Linear and non-linear optimization models for allocation of a limited water supply", J. Irrig. Drain. Eng., 124(5), pp. 138-149 (2004).
27. Michalewicz, Z., Genetic Algorithms Data Structures Evolutionary Programs, Springer, New York (1992). 28. Gen, M.R. and Chang, L., Genetic Algorithm and
Engineering Optimization, Wiley Europe Publication (2000).
29. Hashimoto, T., Stedinger, J.R. and Loucks, D.P. \Reliability, resiliency, and vulnerability criteria for water resources performance evaluation", J. Water Resour. Res., 18(1), pp. 14-20 (1982).
30. Karamouz, M., Szidarovszky, F. and Zahraie, B., Water Resources Systems Analysis, Lewis Publishers, Boca Raton, USA (2003).
31. Kirda, C. and Kanber, R., Water, No Longer a Plentiful Resource, Should be Used Sparingly in Ir-rigated Agriculture, Kirda, C., Moutonnet, P., Hera, C. and Nielsen, D.R., Eds., Crop yield response to decit irrigation, Dordrecht, The Netherlands, Kluwer Academic Publishers (1999).
32. Kirda, C., Kanber, R. and Tulucu, K., Yield Response of Cotton, Maize, Soybean, Sugar Beet, Sunower and Wheat to Decit Irrigation, Kirda, C., Moutonnet, P., Hera, C. and Nielsen, D.R., Eds., Crop yield response to decit irrigation, Dordrecht, The Nether-lands, Kluwer Academic Publishers (1999).