Sharif University of Technology
Scientia IranicaTransactions A: Civil Engineering www.scientiairanica.com
The eect of inadequate compaction on compressive
strength of concrete exposed to elevated temperature
T. Gonen
Department of Civil Engineering, Faculty of Engineering, Usak University, 64200, Usak, Turkey. Received 9 August 2014; received in revised form 25 January 2015; accepted 9 May 2015
KEYWORDS Inadequate compacting; Taguchi method; ANOVA;
High temperature; Compressive strength.
Abstract.One of the important factors aecting the quality of concrete is the placement of fresh concrete inside the formwork. Inadequate compaction is a common problem in concrete technology. In this study, the eect of inadequate compaction on compressive strength and ultrasonic pulse velocity of concrete exposed to elevated temperature is examined. For this purpose, various compaction rates were applied during the casting stage of concrete in order to simulate various levels of inadequate compaction. Four dierent water-cement ratios (0.50, 0.40, 0.38, and 0.35) were selected. All concrete specimens were exposed to 450 or 900C for one hour. The Taguchi approach was used to reduce the
number of samples. The results were evaluated by the Analysis of Variance (ANOVA) method. Test results showed that inadequate compaction played a signicant role, more than curing time, in the compressive strength after high temperature exposure.
© 2016 Sharif University of Technology. All rights reserved.
1. Introduction
Concrete is a composite material having porous, com-posed of mineral aggregates in a cement matrix. The hydration reaction of cement occur a solid porous system. The porous system of concrete allows trans-port of water and other substances [1]. The pores of concrete are classied according to their size as air pores, capillary pores, gel pores, and compaction pores (aect durability) [2,3]. The gel pores, which are mostly 1.5-2.0 nm in size, do not inuence negatively the strength of concrete. The role of these pores is to directly aect creep and shrinkage. On the other hand, capillary, air, and compaction pores are responsible for reductions in compressive strength and the Young's or elasticity modulus [4-8].
Concretes with higher water-to-cement ratios nat-urally contain more water than what is required for complete hydration of cement. This excess water
*. Tel.: +90 276 221 21 21; Fax: +90 276 221 21 37 E-mail address: [email protected]
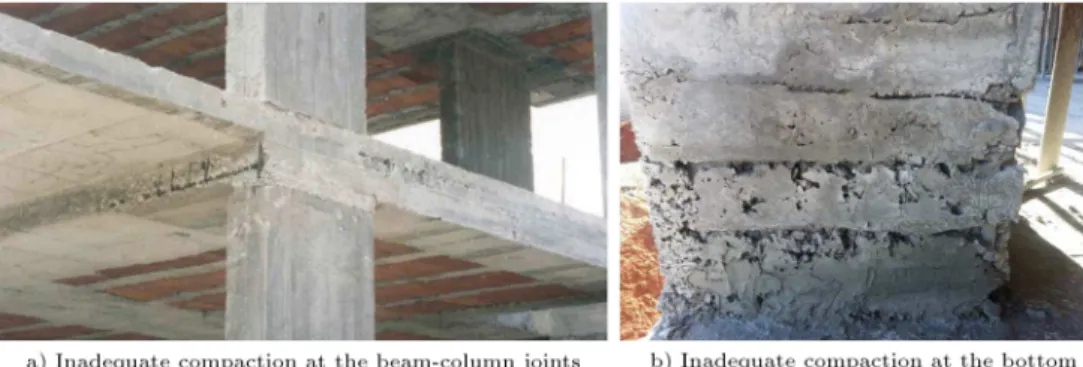
causes voids known as capillary pores. Pores in con-crete can also occur by inadequate compaction caused by poor workmanship (see Figure 1). This pore system is one of the most important properties of concrete because of its eects on carbonation and sorptivity [9]. High temperature is known to cause durability problems in concrete. Even though concrete is a noncombustible material, its internal structure dete-riorates at high temperature. The type of present pores plays an important role in durability. Generally, low porosity with dense microstructure is probably essential to obtain good resistance to several factors, such as chloride, sulphate, etc. However, a dense microstructure seems to be a disadvantage when ex-posed to re. For instance, a great dierence may exist between the properties of high performance con-crete and normal concon-crete after being subjected to elevated temperature [10-12]. Because the porosity of high performance concrete is low and its structure is dense, its performance at high temperature is lower than that for the normal strength concrete [13]. Of course, the level of desiccation of high strength concrete
Figure 1. Concrete defects resulting from inadequate compaction. Table 1. The chemical properties of the Portland cement.
Chemical analysis (% by mass) SiO2 Al2O3 Fe2O3 CaO MgO SO3 Ignition
loss
Insoluble
residue Cl
26.86 8.09 5.18 45.88 3.64 2.41 2.95 4.99 0.01
Physical analysis
45 Blaine Initial Final Specic Density Increase Compressive strength (%) (cm2/g) setting setting gravity (g/cm3) in volume 2 days 7 days 28 days
(hour) (hour) (g/cm3) (%) (N/mm2) (N/mm2) (N/mm2)
1.9 4326 02:35 03:45 2.98 2.92 4 16.9 28.4 39.0
exposed to high temperature is related to its humid-ity.
There has been much research on the properties of normal and high performance concretes subjected to high temperatures [14-17]. However, no study on the behavior of inadequately compacted concrete at elevated temperature has been performed. This study was performed to ascertain the inuence of inadequate compaction on compressive strength and ultrasonic pulse velocity of concretes exposed to elevated tem-perature. The Taguchi method was generally used to reduce the number of required experiments and to determine the optimum conditions. Furthermore, ANOVA tests were performed to statistically evaluate the major process parameters and their contributions to the compressive strength of the concrete.
2. Materials and methods 2.1. Materials
Tap water was used as concrete mixing water in all test specimens. The aggregate, river gravel and sand, commonly used in concrete production, were used (max. size of aggregate = 16 mm). Water absorption and density values of the aggregate were 3.5% and 2.75 g/cm3, respectively. The cement used in this
study was CEM I 42.5 N according to TS EN 197-1 (Turkish standard) [18]. The chemical compositions (as percentage by mass of the constituent oxides), the
mechanical and some physical properties of the CEMI 42.5 were presented in Table 1.
2.2. Mix design and Taguchi method
One of the most important stages in the design of experiments is selection of the controlling factors. The controlling factors should be included so to make it possible to identify non-signicant variables at the earliest opportunity [19]. The Taguchi method is a statistical method developed by Genichi Taguchi as an optimization technique [20]. According to Taguchi method, the performance of a specimen tested may be aected by both environmental conditions and compo-nents. Taguchi's method supplies parameter design to researchers with a systematic and ecient method for determining near optimum design parameters for both performance and cost [21,22].
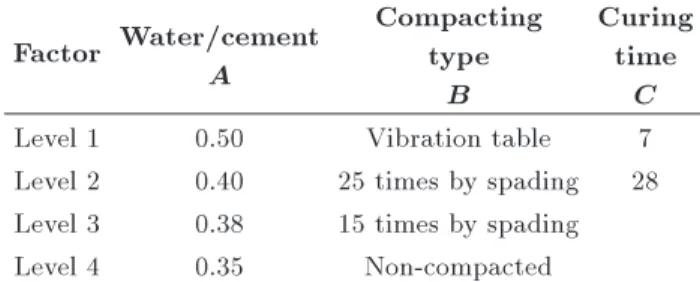
The compressive strength will mainly depend on the manufacturing conditions employed. Table 2 shows the variables considered in the experiment. Concretes were characterized by dierent water/cement contents of 0.35, 0.38, 0.40, and 0.50. The concretes were pre-pared by four dierent compacting techniques to create various levels of compaction porosity. In addition, two curing times were examined, 7 and 28 days. All mixes included 400 kg/m3 of cement. Experimental
param-eters and variables measured, which were determined in initial tests, are summarized in Table 2. In this optimization, four levels and three parameters were
Table 2. Controllable factors and their variation levels. Factor Water/cement
A
Compacting type
B
Curing time
C Level 1 0.50 Vibration table 7 Level 2 0.40 25 times by spading 28 Level 3 0.38 15 times by spading Level 4 0.35 Non-compacted
taken based on a L16 orthogonal array according to Taguchi design (Table 3).
In Table 3, it should be noticed that parameter A (i.e., water/cement ratio) has four levels: A1 (i.e., 0.50), A2 (i.e., 0.40), A3 (i.e., 0.38), and A4 (i.e., 0.35). Parameters B and C are compaction type and curing time, respectively. All test of concrete samples was repeated three times under the same laboratory conditions to observe the eect of variability on the physical and mechanical properties studied.
As previously emphasized, the compressive strengths of concrete samples were measured at ele-vated temperature. Signal to noise rate was chosen as the optimization criterion. Signal to noise rate for \the larger the better" situation for compressive strength was evaluated by utilizing Eq. (1) (see Ref. [23]):
S=N = 10 log10 "
1 n
n
X
i=1
1 Y2
i
#
: (1)
Lower porosity gives better performance. For this reason, the \smaller is better (LB)" for porosity pa-rameter was used to nd the optimal experimental conditions (Eq. (2)) [23], where S=N (Signal/Noise) is performance statistics, Yi is the performance value
of ith experiment, and n is the number of recurrence done for an experimental combination. In the Taguchi approach, the experiment corresponding to optimum experiment conditions may not be done during the whole period of experimentation. In such cases, the signal to noise rate corresponding to optimum studying conditions can be estimated by using the balanced characteristic of orthogonal array [24].
S=N = 10 log10 "
1 n
n
X
i=1
(Yi Y0)2
#
: (2)
2.3. Specimen preparation and curing
The concretes were prepared in the laboratory using a pan type mixer with 56 liters of capacity. The mixture proportions were calculated by the absolute volume method. 100 mm cubic molds were used to place fresh concrete. Fresh concrete was placed into the mold by a compacting bar or vibration table. The compacting bar was a 3800 mm long steel bar, a 25 mm square end for ramming with 1.8 kg weighing. Various levels of compaction porosity (poor, medium, high) were cre-ated with dierent compaction techniques during the casting process. These techniques involved vibration or 25 tamps per layer (double layer 50 mm) for good
Table 3. The chosen L16experimental plan and results.
Exp. no
Parameters and their levels
Porosity (%)
Compressive strength (MPa)
A B C 20C 450C 650C 900C
M1 1 1 1 14.4 52.0 38.0 33.6 15.4
M2 1 2 2 14.6 49.6 37.8 32.8 12.7
M3 1 3 2 15.0 60.7 45.9 36.5 15.9
M4 1 4 2 15.5 55.3 33.5 31.7 10.5
M5 2 1 1 13.9 63.2 58.1 48.5 26.9
M6 2 2 1 14.3 61.5 58.0 43.5 19.7
M7 2 3 2 14.8 57.7 48.3 35.7 12.3
M8 2 4 2 15.3 54.6 40.3 33.5 10.4
M9 3 1 2 9.2 95.4 88.4 52.1 19.3
M10 3 2 2 11.0 91.4 85.6 51.2 23.2
M11 3 3 1 12.3 80.3 65.4 41.0 17.9
M12 3 4 1 13.5 73.2 58.6 36.4 13.4
M13 4 1 2 9.8 97.2 81.1 49.4 24.1
M14 4 2 2 10.4 94.7 88.2 60.5 30.9
M15 4 3 1 11.6 85.5 79.6 46.9 22.9
compaction (VC and 25C, respectively), 15 tamps per layer (double layer 50 mm) for medium compaction (15C), and Non-Compacted (NC) for poor compaction. Concrete specimens with various rates of compaction were kept for 24 h in laboratory conditions and then cured for a period of 7 or 28 days in water saturated by lime.
2.4. Compressive strength and ultrasound Compressive strengths were determined on 100 mm cubic specimens at elevated temperatures. Compres-sive strength tests were applied to control samples and samples were exposed to elevated temperature with 3000 kN hydraulic load controlled by a digital display press.
The transit time of a pulse between transduc-ers placed on the surfaces of a concrete structure is measured by means of ultrasonic pulse velocity equipment. The pulse velocity can be calculated using the measured path length through the concrete. Since ultrasonic tests are aected by the humidity of the concrete, specimens were dried in an oven before tests. Wave speed was calculated with Eq. (3).
V = (h=t)106; (3)
where V is supersonic wave speed (m/sec), t represents the time between transmission and reception (sn), and h is the measuring distance between the surfaces of concrete specimens (m).
2.5. Apparent porosity
100 mm cubic specimens were prepared for porosity tests. Oven dried (Wdry), saturated dried surface
(Wsat), and underwater weight (Wwat) of these
spec-imens were determined and porosity values of the specimens were found according to Eq. (4) [25-27].
P = (Wsat Wdry)
(Wsat Wwat)100: (4)
2.6. High temperature
Specimens with various compacting and water-cement ratios were air dried for 7 days at an average tempera-ture of 20C and relative humidity of 30 10% before
exposure to high temperatures. After drying, the
three specimens from each group were heated to 450, 650, or 900C at a 6C /min heating rate, while the
control specimens were kept at laboratory temperature. Each temperature reached was maintained for 1 h [28]. Heating-cooling procedures were three stages. Firstly, specimens were heated to the specied temperature level without loading. Then, the specimens were kept for one hour at the target temperature, and nally cooled to room temperature, and then subjected to testing [29].
3. Results and discussion
The aim of this study was to determine the eects of inadequate compaction of concrete on compressive strength exposed to elevated temperature by means of the Taguchi method. Statistically signicant and percent contributions of the factors, measured on the strength and porosity properties of concrete samples, were evaluated by using ANOVA.
Taguchi method clearly helped in designing this partial factorial ANOVA, which reduced the number of trials to 16. This resulted in using less material (thus reducing cost), less space for storing the specimens while they were cured, and less time spent for preparing the samples. The best possible testing conditions for the specimens prepared by dierent mixing processes can be determined from the main eect in Figures 2-6 for porosity and compressive strength at elevated temperature. In addition, Figures 2-6 shows the relative importance of the experimental parameters on compressive strength and porosity. Figure 2 shows the variation of performance statistics with porosity parameters.
\Level 1" compaction was performed by vibration. The series corresponding to level 1 (compacting) can be seen in Table 3 (column B). The signal to noise value of the rst data point is, thus, the average of the results of the experiment of porosity or compressive strength obtained from the experiments 1, 5, 9, and 13. The experimental conditions for the second data point, thus, are the conditions of the experiments starting with number 2 in column B (i.e., experiments 2, 6, 10, and 14), and so on.
Figure 3. S=N graph of factors measured and eect ratio for compressive strength at 20C.
Figure 4. S=N graph of factors measured and eect ratio for compressive strength at 450C.
Figure 5. S=N graph of factors measured and eect ratio for compressive strength at 650C.
Figure 6. S=N graph of factors measured and eect ratio for compressive strength at 900C.
Porosity increased depending on the increase in water-binder ratio. It is clearly seen that water/cement ratio was the most inuential parameter, with a 74% eect on porosity of concrete specimens (Figure 2). The compacting method was the second most inuential parameter, with a 21% eect on porosity. The porosity increased as water/cement increased and compaction rate decreased. The average S=N ratio of all specimens was -22.164. Non-compacted and 15 tamps per layer concrete specimens were below average. The least eective parameter was curing time. A previous
study [30], investigating the eects of curing conditions, water-cement ratio, and curing time on porosity, gave similar trends.
The compressive strength of concrete highly de-pends on the ratio of water to cement and of cement to aggregate. At the same time, it depends on degree of compaction, grading, shape, bond between mortar and aggregate, strength, and size of the aggregate [31-33]. Also, the compressive strength of concrete varies inversely with w=c ratio. In this study, 0.35 w=c ratio maximized the S=N as expected (Figure 3). Water
cement ratio played a role in determining compressive strength of samples cured at 20C for 28 days. Other
parameters, evaluated in this study, had very little eects for samples cured at 20C for 28 days. The
test results demonstrated that inadequate compaction caused a slight decrease in compressive strength [9].
The compressive strength of concrete decreases after it is subjected to high temperatures. Degree of decrease is dependent on material properties as well as environmental factors (such as constituents, initial strength before exposure to high temperature, moisture content [34,35]. The high moisture content of concrete can give rise to vapor pressure in the pores, especially in high strength concrete at high temperature and may result in explosive spalling. As the moisture content has an important role in high temperature resistance and spalling behavior of concrete, the concrete speci-mens were dried to a constant weight in a drying oven in this study.
Generally, compressive strength of concrete spec-imens decreased with increase in temperature (see Table 3). Figures 4-6 shows the variation of the signal to noise of parameters on the compressive strength of specimens exposed to 450, 650, and 900C. The
best performance at all temperatures was shown by vibration compacted samples having 0.35 w=c. The higher the w=c ratio, the more decrease of compressive strength at all temperature levels. It was clearly shown in Figures 4-6 that the inuence of compaction increased with increase in temperature, while the role played by w=c ratio decreased. The best performance at all temperatures for the 0.35 w=c samples was shown by vibration compacted samples cured for 28 days. Increased water content decreased compressive strength at all temperatures (Figures 4-6). ANOVA analysis showed that both w=c ratio and compaction type played signicant roles in compressive strength at 650 and 900C.
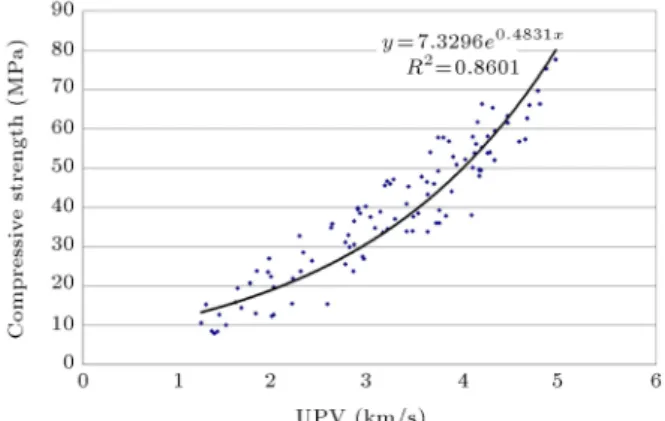
Ultrasonic Pulse Velocity (UPV) is often used for assessing the quality of concrete and to estimate compressive strength. Ultrasonic pulse velocity has been used for a long time to estimate the physical and mechanical properties of cementitious systems. A number of relationships relating ultra-pulse velocity to concrete strength are available in the literature for self-compacting concretes [36], concretes with mineral admixtures [37], and various others [38-41]. However, errors in estimation of compressive strength using non-destructive tests can occur because of the heterogeneity of the concrete's composition, such as varied air and moisture contents [42]. The coecient of correlation (R2) values indicated that the relationship between
ultrasonic pulse velocity and compressive strength is low, possibly because of the concrete mixture or the elevated temperature [43]. The relationship between ultrasonic pulse velocity and compressive strength was
Figure 7. The relationship between compressive strength and UPV.
very good. In case R2 = 0:86, it can be said
that 86% of the variation in the compressive strength was calculated by the exponential relationship with ultrasonic pulse velocity (see Figure 7).
4. Conclusion
This paper focused on the eects of inadequate com-paction on compressive strength when exposed to ele-vated temperature. In this study, the Taguchi method was used to reduce the required number of samples. ANOVA was applied to the experimental data to determine eciency. According to ANOVA, the most eective factor on compressive strength of specimens was w=c ratio. The eect of inadequate compaction on compressive strength increased with increase in temperature. At all temperatures, the maximum compressive strength was observed in samples with 0.35 water-cement ratio with vibration compaction. The eect of compaction on compressive strength was 48% at 900C, while it was 6% at 20C. The
Taguchi approach was successfully used to determine the physical and mechanical properties of dierent compacted concretes in this study. The ndings in this study may be very useful for determining mechanical and physical properties of an actual application. Fur-thermore, in this study, it was determined that the relationship between UPV and compressive strength was high.
References
1. Steens, A., Dinkler, D. and Ahrens, H. \Modelling carbonation for corrosion risk prediction of concrete structures", Cement and Concrete Research, 32(6), pp. 935-941 (2002).
2. CEB (Comite Euro-International du Beton) De-sign Guide, Durable Concrete Structures, Lausanne: Thomas Telford Ltd (1992).
concrete structures", Workshop Report, edited by Rostam S. Copenhagen (1983).
4. Soroka, I., Portland Cement Paste and Concrete, London: Macmillan (1979).
5. Mehta, P.K., Concrete: Structure, Properties and Materials, New York: Prentice-Hall (1986).
6. Neville, A.M. and Brooks, J.J., Concrete Technology, Singapore: Longman (1990).
7. Brandt, A.M. \Cement based composites: materials", Mechanical Properties and Performance, London: E & FN Spon (1995).
8. Newman, K. \Concrete systems", in: L. Holliday (Ed.), Composite Materials, Elsevier, USA, pp. 336-352 (1966).
9. Gonen, T. and Yazicioglu, S. \The inuence of com-paction pores on sorptivity and carbonation of con-crete", Construction and Building Materials, 21(5), pp. 1040-1045 (2007).
10. Demirel, B. and Kelestemur, O. \Eect of elevated temperature on the mechanical properties of concrete produced with nely ground pumice and silica fume", Fire Safety Journal, 45, pp. 385-391 (2010).
11. Turkmen, I. and Fndk, S.B., Several Properties of Mineral Admixtured Lightweight Mortars at Elevated Temperatures Fire and Materials, 37(5), pp. 337-349 (2010).
12. Furumura, F., Abe, T. and Shinohara, Y. \Mechanical properties of high strength concrete at high temper-atures", Proceedings of the Fourth Weimar Workshop on High Performance Concrete: Material Properties and Design, Weimar, Germany, Oct. pp. 237-254 (1995).
13. Tarun, R.N. and Rudolph, N.K. \Temperature eects on high-performance concrete", 6th International Sym-posium on Utilization of High Strength/High Perfor-mance Concrete (2002).
14. Uygunoglu, T. and Tobcu, I.B. \Eect of aggregate type on linear thermal expansion of self-consolidating concrete at elevated temperatures", Science And En-gineering of Composite Materials, 19, pp. 259-269 (2012).
15. Poon, C.S., Azhar, S., Anson, M. and Wong, Y.L. \Comparison of the strength and durability perfor-mance of normal and high-strength pozzolanic con-cretes at elevated temperatures", Cement and Con-crete Research, 31(9), pp. 1291-1300 (2001).
16. Poon, C.S., Shui, Z.H. and Lam, L. \Compressive behavior of ber reinforced high-performance concrete subjected to elevated temperatures", Cement and Con-crete Research, 34, pp. 2215-2222 (2004).
17. Chan, Y.N., Luo, X. and Sun, W. \Compressive strength and pore structure of high-performance con-crete after exposure to high temperature up to 800C",
Cement and Concrete Research, 30, pp. 247-251 (2000).
18. TS EN 197-1, Cement- Part 1: Composition Sand Conformity Criteria for Common Cements, Turkish Standards Institution, Turkey (2002).
19. Nian, C.Y., Yang, W.H. and Tarng, Y.S. \Optimiza-tion of turning opera\Optimiza-tions with multiple performance characteristics", Journal of Materials Processing Tech-nology, 95, pp. 90-96 (1999).
20. Ranjit, R., A Primer on the Taguchi Method, New York: Van Nostrand Reinhold (1990).
21. Turkmen, I., Gul, R. and Celik, C.A. \Taguchi ap-proach for investigation of some physical properties of concrete produced from mineral admixtures", 43(6), pp. 1127-1137 (2008).
22. Nuruddin, M.F. and Bayuaji, R. \Application of Taguchi's approach in the optimization of mix propor-tion for microwave incinerated rice husk ash foamed concrete", International Journal of Civil & Environ-mental Engineering, 09(09), pp.121-29 (2009). 23. Kelestemur, O., Arc, E., Yldz, S. and Gokcer, B.
\Performance evaluation of cement mortars containing marble dust and glass ber exposed to high temper-ature by using Taguchi method", Construction and Building Materials, 60, pp. 17-24 (2014).
24. Irdemez, S., Yildiz, Y.S. and Tosunoglu, V. \Opti-mization of phosphate removal from wastewater by electrocoagulation with aluminum plate electrodes", Separation and Purication Technology, 52(2), pp. 394-401 (2006).
25. Papadakis, V.G., Fardis, M.N. and Veyenas, C.G. \Hydration and carbonation of pozzolonic cements", ACI Mater. J. Technical Paper, 89(2), pp. 119-130 (1992).
26. Cabrera, J.G. and Lynsdale, C.J. \A new gas pa-rameter for measuring the permeability of mortar and concrete", Magazine Concrete Research, 40, pp. 177-182 (1988).
27. Rossignolo, J.A. and Agnesini, M.V. \Durability of polymer-modied lightweight aggregate concrete", Ce-ment Concrete Comp., pp. 375-380 (2004).
28. Mohamedbhai, G.T.G. \Eect of exposure time and rates of heating and cooling on residual strength of heated concrete", Magazine Concrete Research, 38, pp. 151-158 (1986).
29. Ahmet, B., Kizilkanat, A.B., Yuzer, N. and Kabay, N. \Thermo-physical properties of concrete exposed to high temperature", Construction and Building Mate-rials, 45, pp. 157-161 (2013).
30. Turkmen, I. \Inuence of dierent curing conditions on the physical and mechanical properties of concretes with admixtures of silica fume and blast furnace slag", Materials Letter, 57, pp. 4560-4569 (2003).
31. Bhanja, S. and Sengupta, B. \Investigations on the compressive strength of silica fume concrete using statistical methods", Cem. Concr. Res., 32, pp. 1391-1394 (2002).
32. Elices, M. and Rocco, C.G. \Eect of aggregate size on the fracture and mechanical properties of a simple concrete", Engineering Fracture Mechanics, 75(13) pp. 3839-3351 (2008).
33. Rocco, C.G. and Elices, M. \Eect of aggregate shape on the mechanical properties of a simple concrete", Engineering Fracture Mechanics, 76(2), pp. 286-298 (2009).
34. Sarshar, R. and Khoury, G.A. \Material and environ-mental factors inuencing the compressive strength of unsealed cement paste and concrete at high tempera-tures", Mag. Concr. Res., 45, pp. 51-61 (1993). 35. Chan, Y.N., Peng, G.F. and Anson, M. \Spalling
mechanism and re resistance of high performance silica fume concrete with dierent moisture content", Proc. of the 4th Beijing Inter. Symp. of Cem. and Concr., Beijing, China, pp. 149-153 (1998).
36. Ulucan, Z.C., Turk, K. and Karatas, M. \Eect of min-eral admixtures on the correlation between ultrasonic velocity and compressive strength for self-compacting concrete", Russian Journal of Nondestructive Testing, 44(5), pp. 367-374 (2008).
37. Gul, R., Demirboga, R. and Guvercin, T. \Compres-sive strength and ultrasound pulse velocity of mineral admixtured mortars", Indian Journal of Engineering & Materials Sciences, 13, pp. 18-24 (2006).
38. Turgut, P. \Research into the correlation between concrete strength and UPV values", NDT.net. 12:12 (2004).
39. Nilsen, A. and Aitcin, P. \Static modulus of elasticity of high strength concrete from pulse velocity tests", Cem. Concr. Aggr., 14(1), pp. 64-66 (1992).
40. Phoon, K.K., Wee, T.H. and Loi, C.S. \Development of statistical quality assurance criterion for concrete using ultrasonic pulse velocity method", ACI Material Journal, 96(5), pp. 568-573 (1999).
41. Tharmaratram, K. and Tan, B.S. \Attenuation of ultrasonic pulse in cement mortar", Cem. Concr. Res., 20, pp. 33{340 (1990).
42. Cho, Y.S., Kim, J.H. and Hong, S.U. \Compressive strength prediction of porous concrete using nonde-structive tests", Journal of Civil Engineering and Architecture, 5(12), pp. 1053-1064 (2011).
43. Prasopchaichana, K. \Evaluating the compressive strength of concrete exposed to elevated temperatures using ultrasonic pulse velocity and articial neural net-works", 6th European Workshop on Structural Health Monitoring - Poster, 17 (2012).
Biography
Tahir Gonen received his PhD degree in Construction Education from Firat University, Turkey, in 2009, and is currently Assistant Professor in the Civil Engineering Department, Construction Materials Division, Usak University, Turkey. His main research interests include dierent concrete design, durability, and mechanical properties.