ISSN: 2252-8938 62
Refined Clustering of Software Components by Using K-Mean
and Neural Network
Indu Verma, Amarjeet Kaur, Iqbaldeep KaurDepartment of Computer Science and Engineering, Chandigarh University, India.
Article Info ABSTRACT
Article history: Received Feb 6, 2016 Revised April 9, 2016 Accepted May 10, 2016
Data Mining is extraction of relevant information about data set. A data-warehouse is a location where information is stored. There are various services of data mining, clustering is one of them. Clustering is an effort to group similar data onto single cluster. In this paper we propose and implement k-mean and neural network for clustering same components in single cluster. Clustering reduces the search space by grouping similar test cases together according to the requirements and, hence minimizing the search time, for the retrieval of the test cases, resulting in reduced time complexity. In this research paper we proposed approach for re-usability of test cases by unsupervised approach and supervised approach. In unsupervised learning we proposed k-mean and in supervised learning neural network. We have designed the algorithm for requirement and test case document clustering according to its tf-idf vector space and the output is set of highly cohesive pattern groups.
Keyword: Back Propagation Clustering Data Mining Feed Forward K-Mean Neural Network
Copyright © 2015 Institute of Advanced Engineering and Science. All rights reserved. Corresponding Author:
Iqbaldeep Kaur,
Department of Computer Science and Engineering, Chandigarh University,
Gharuan, India.
Email: [email protected]
1. INTRODUCTION
The computational process of determining appropriate information or patterns in large data set is defined as data mining. Clustering is one of functionality of data mining that group abstract objects of cluster of similar objects. Most of the domains use clustering for the reuse of software, text documents, images and patterns. In software engineering, the need of clustering arises from software component classification, component clustering, performing software component search and for the component retrieval from software repository [1].
Clustering may be categorized as supervised and unsupervised. Information retrieval and clustering makes reusability of software components easy. Reusing software is the process of developing new system and software that already prevail rather than (new creation) creating software system from initial point.There are various clustering techniques are available like, Density-based Methods, Hierarchical Methods, Model-based Clustering Methods, Grid- Model-based, Partitioning Methods [2] etc. Extensive research has been done these over large no. of applications. There is no exhaustive research using aggregation of partitioning method (k-mean) and Neural Network. This can find its applications for the area of image segmentation or information retrieval. However, recently researcher throws a light on the use of this aggregate approach to software engineering for component reusability. To reduce the time space complexity, clustering process of software component retrieval must be automated. So the inspiration behind the design of an algorithm is automation of component clustering. These clusters then thus help in choosing the required component with high cohesion and low coupling quickly and efficiently.
2. APPROACH
In the following sections we provide details on the individual methods, and then describe how they were used to generate our results.
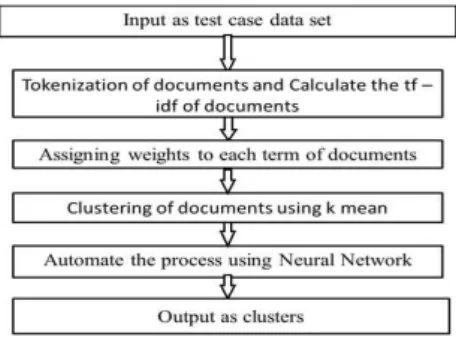
Figure 1. Methodology
The first step while creating clusters of documents is to convert the whole document into a single statement. The simplest way to represent a text is with a single string. These tokens become input for data mining or text mining. Then after that term frequency (tf) and inverse document frequency (IDF) is calculated for assigning the weights to each term of the document. The values of tf-idf act as input or data points for k-mean.
2.1 K-Mean
It is one of the important parts of partitioning methods and issimplest forms of unsupervised learning algorithms. This algorithm is used for solving a clustering problem in any field. It is a straightforward and effortless way which helps in classifying a data set through a definite number of clusters (say c-clusters). Initially the numbers of cluster are fixed so that it becomes easy to classify the given data set. Its goal is to partition k observations of a data set into c clusters, where each observation of data set belongs to the cluster having minimum or nearest mean. Now follow the previous step for each point belonging to the dataset and unite to the nearest center. The first data set is completed when no any points left. Now again calculate centroids as bar center of the clusters resulting from previous step. After this, the same dataset points and the nearest new center be supposed to be binded together. The value of k keeps on changing until convergence in results occurs. In our work the tf-idf values of the input documents will become data points for the k-mean algorithm.
The Objective Function is
( ) ∑ ∑ (‖ ‖
) , (1)
Where,
‘||xi - vj||2’ is the Euclidean distance between xi and vj.
‘ci’ = number of data points in i th
cluster. ‘c’ = number of cluster centres.
Algorithm for K-mean: BEGIN
X= {X1, X2, X3…..Xm}….Set of data points C = {C1, C2, C3…..Cn} …. Set of centres Initialize v (v C) For each (v)
{
For (i=1, i<= Xm, i++) {
Find Distance Di using Euclidean distance If (Di == min)
{
Allocate data point i to the center v }
Return Di End If } End For } (End for each)
C= {C1, C2, C3…..Cj}….Set of data points I = {I1, I2, I3…..In} …. Set of centers Initialize v (v I) For each (v)
{
For (k=1, k<= Cj, k++) {
Find Distance Dk using Euclidean distance If (Dk converges with Di)
Then Stop Else Go To 5 } End For }
(End for each) End algorithm 2.2. Neural Network
When A Neural Network (NN) is often called artificial neural network (ANN), is an estimation method or model which is based on neurons. It processes information using connectionist approach where all the nodes are connected with each other with some weight age. Mostly a neural network is an adaptive system in which the pattern changes on the basis of flow of information through the network while learning [4]. Neural network is able to use some hidden unknown information in the data. This process of capturing hidden information is called learning or training network. It is trained to carry out specific function by modifying the values of the weights between elements. The back propagation nn is a multilayered feed forward nn and is most widely used for learning.
Some benefits of neural network:
1. Adaptive learning: A capacity to acquire skill to perform different activities which are depended on the provided data for training.
2. Self-Organisation: A neural network can develop its own functional body that retains the information acquired during learning period.
3. Real Time Operation: Neural Network and Data processing may be lugged in parallel, and various hardware devices are being manufactured and designed specially to exploit this capability in the best manner possible.
Types of Neural Network used are: 1. Feed Forward ANN
2. Feedback ANN
2.3. Feed Forward Neural Network
FF network is a simple NN consist of an input, output and one or more layers of neurons. The power of the network can be noticed based on group behavior of the connected neurons and the output is decided through continuous assessment of its output by scrutinizing. The virtue of this network is that it becomes proficient in estimating and analyzing input patterns.
Figure 3. Feed Forward Network [4]
Presume input node ‘a’, hidden node ‘b’, output node ‘c’ and ‘w’ weight of node. The input layer is when feed with particular training model, the sum of weighted input nodes to the bth node in the hidden layer is as follows
∑ (2)
Equation2 is used to calculate the total input to the input values of the input layer. The θj term is the biased term added to the output value of the input layer that always has a value of 1. The bias is added to resolve the problem where the input values are zero. If input value is zero, then the NN couldn’t be trained without bias.
The resulting value from the input layer becomes the input for hidden layer. The processing in the hidden layer is done by using sigmoid function. This determines the neuron's output; a typical activation function used the sigmoid equation given below.
(3)
Above equations are used to find out the output of the output layer. 2.4. Feed Back or Back Propagation Neural Network
In this type of ANN, the output is fed back into the network to improvise the input to achieve the best possible results internally. The feedback network feeds information back into itself and is pertinent in solving optimization problems. These are mainly used by the internal system error corrections.
Figure 4. Feed Back Network [4]
Error Calculations and Weight Adjustments are done during back propagation also called as propagation of error. If the expected target value of output of node c is tc and the actual activation value of the output node, c, is oc, then the difference between the expected output and the actual output is given by
(4)
Error signal at output node c is:
( ) ( ) (5)
Weight adjustment or modification in weights after calculating error signal:
( )
(6)
Where lr is learning rate and µ is momentum. Error signal at hidden node b is:
( ) ∑( ) (7)
Weight adjustment in weights after calculating error signal:
( )
(8)
Where is updated weight. Pseudo code for Neural Network Input:
Requirement (R) Test cases document (T)
1. For I=0 to Len(R and T)… do Tokenize input text of R and T Remove Stop word
Make a Vector space model (TF-IDF) Log N/D 2. For I=0 to Len(R and T)… do
Vectorize all Documents (t1, t2, t3...tn) for test cases Input these vectorization on K-mean
Output is K number of cluster Make K number of classes
Put features of these documents and make training set 3. For I=0 to Len (Doc.training.Features)… do
Neural Network Model
4. For I=0 to Len (Doc.test.Features)… do
Test on neural network multi classification model use following cluster classes C2, C3, C4, C5, C6, and C7
Vectorize all Documents (r1, r2, r3...rn) for requirements Analysis of the cluster on
1. Accuracy = TP+TN/P+N 2. Precision= TP/TP+FP 3. Recall =TP/TP+FN Output:
Cluster of document according to document similarity
3. PERFORMANCE RESULTS AND IMPLEMENTATION
This section describes the experimentation part. For testing the effectiveness of the algorithm, we tested it on requirement and test case dataset. The data set is divided randomly 80-20percent, out of which one is for training and other is for testing. These results are calculated on the basis of confusion matrix which allows visualizing the performance of supervised algorithm.
3.1. Comparative Analysis
Below discussed results are for clusters 2, 3, 4, 5, 6, 7.
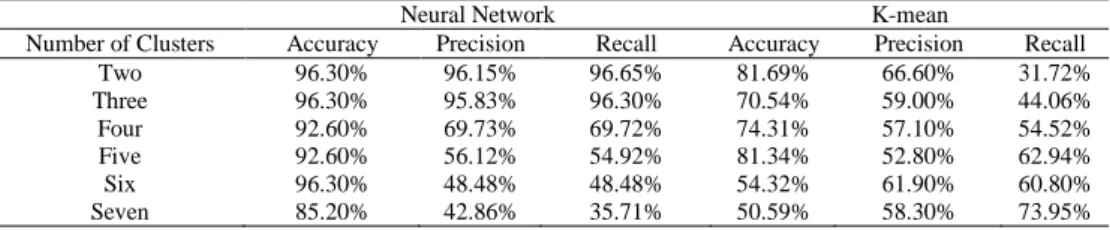
Table1. Comparative analysis of K-mean and Neural Network
Neural Network K-mean
Number of Clusters Accuracy Precision Recall Accuracy Precision Recall
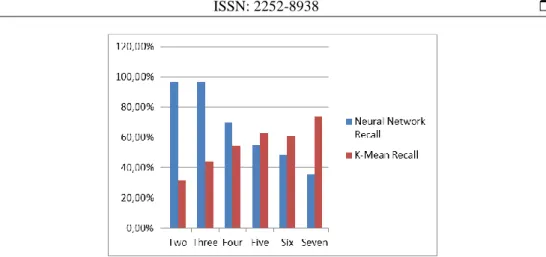
Two 96.30% 96.15% 96.65% 81.69% 66.60% 31.72%
Three 96.30% 95.83% 96.30% 70.54% 59.00% 44.06%
Four 92.60% 69.73% 69.72% 74.31% 57.10% 54.52%
Five 92.60% 56.12% 54.92% 81.34% 52.80% 62.94%
Six 96.30% 48.48% 48.48% 54.32% 61.90% 60.80%
Seven 85.20% 42.86% 35.71% 50.59% 58.30% 73.95%
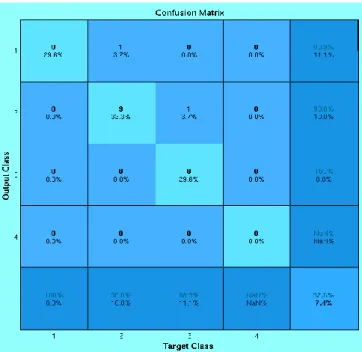
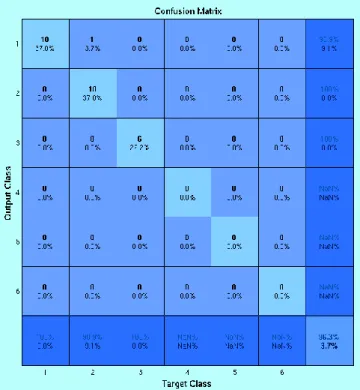
3.2. Neural Network Result
Below discussed results are calculated on the basis of feed forward and back propagation neural network.
Figure 6. Three Classes Clasification
Figure 8. Five Class Classification
Figure 10. Seven Class Classification
Figure 11. Represents the Comparison of Measured Accuracy of K Mean with Measured Accuracy of Neural Network.
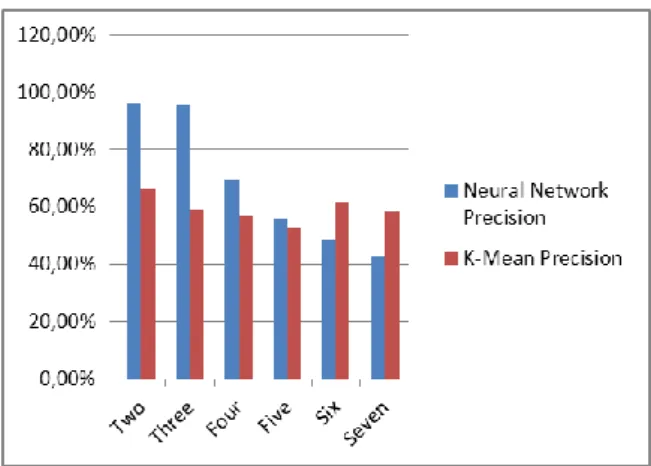
Figure 12. Represents the comparison of measured precision of k mean with measured precision of neural network.
Figure 13. Represents the Comparison of Measured Recall of K Mean with Measured Recall of Neural Network.
4. CONCLUSION
In this paper we have represented how supervised and unsupervised techniques play important role in component based test case resemble with requirements. Unsupervised clustering methods are use to cluster the similar type of documents, reduce the search space and provide higher efficient and supervised learning is use to automate the process. In this research paper we proposed approach for re-usability of test cases by unsupervised approach and supervised approach. Hence, to automate the process using neural network is applied on the data set which gave the classified data and then parameter evaluation is done. We have implemented multilayer neural network when there are number of classes or categories are present. In future neural network can be used with AdaBoost learning technique for improving the performance.
ACKNOWLEDGEMENTS
I would like to express my sincere and deep sense of reverence for Dr. Amit Verma, Head of Department, Computer Science and Engineering, Chandigarh University, Gharuan for his guidance and continuous encouragement.
REFERENCES
[1] Srinivas, Chintakindi, Vangipuram Radhakrishna, CV Guru Rao. Clustering and Classification of Software Component for Efficient Component Retrieval and Building Component Reuse Libraries. Procedia Computer Science, 31 2014.
[2] Rokach, Lior, Oded Maimon. Clustering methods. In Data mining and knowledge discovery handbook. 2005: 321-352. Springer US.
[3] Huang, Zhexue. Extensions to the k-means algorithm for clustering large data sets with categorical values. Data mining and knowledge discovery 2, 1998; 3: 283-304.
[4] Hassoun, Mohamad H. Fundamentals of artificial neural networks. Proceedings of the IEEE 84, 1996; 6: 906. [5] Li, Jinhong, Bingru Yang, Wei Song, Wei Hou. Clustering Frequent Itemsets Based on Generators. In Intelligent
Information Technology Application, 2008. IITA'08. Second International Symposium on, IEEE, 2008; 2: 1083-1086.
[6] G Kiran Kumar, T Bala Chary, P Premchand. A New and Efficient K-Means Clustering Algorithm. International Journal of Advanced Research in Computer Science and Software Engineering, 2013; 3(11).
[7] Faraoun, KM, A Boukelif. Neural networks learning improvement using the K-means clustering algorithm to detect network intrusions. International Journal of Computational Intelligence 3, 2006; (2): 161-168.
[8] Aneetha, AS, S Bose. The combined approach for anomaly detection using neural networks and clustering techniques. Computer Science & Engineering 2.4 (2012): 37.
[9] Li, Ming, Hang Li, Zhi-Hua Zhou. Semi-supervised document retrieval. Information Processing & Management
45.3 (2009): 341-355.
[10] Huang, Zhexue. Extensions to the k-means algorithm for clustering large data sets with categorical values. Data mining and knowledge discovery 2.3 (1998): 283-304.
[11] Sakthi, M, A Thanamani. An Enhanced K Means Clustering using Improved Hopfield Artificial Neural Network and Genetic Algorithm. International Journal of Recent Technology and Engineering (IJRTE), 2277-3878. [12] Lin, Yung-Shen, Jung-Yi Jiang, Shie-Jue Lee. A similarity measure for text classification and clustering. IEEE
Transactions on Knowledge and Data Engineering, Year 2013. [13] Dostál, P, P Pokorný. Cluster analysis and neural network. Year 2009.
![Figure 2. Artificial Neural Network [4]](https://thumb-us.123doks.com/thumbv2/123dok_us/8385223.2227890/3.892.286.631.842.1097/figure-artificial-neural-network.webp)
![Figure 3. Feed Forward Network [4]](https://thumb-us.123doks.com/thumbv2/123dok_us/8385223.2227890/4.892.312.599.310.495/figure-feed-forward-network.webp)
![Figure 4. Feed Back Network [4]](https://thumb-us.123doks.com/thumbv2/123dok_us/8385223.2227890/5.892.284.633.120.349/figure-feed-back-network.webp)