The ecology of the Tamar estuary. III. Salinity and temperature conditions in the lower estuary
14
0
0
Full text
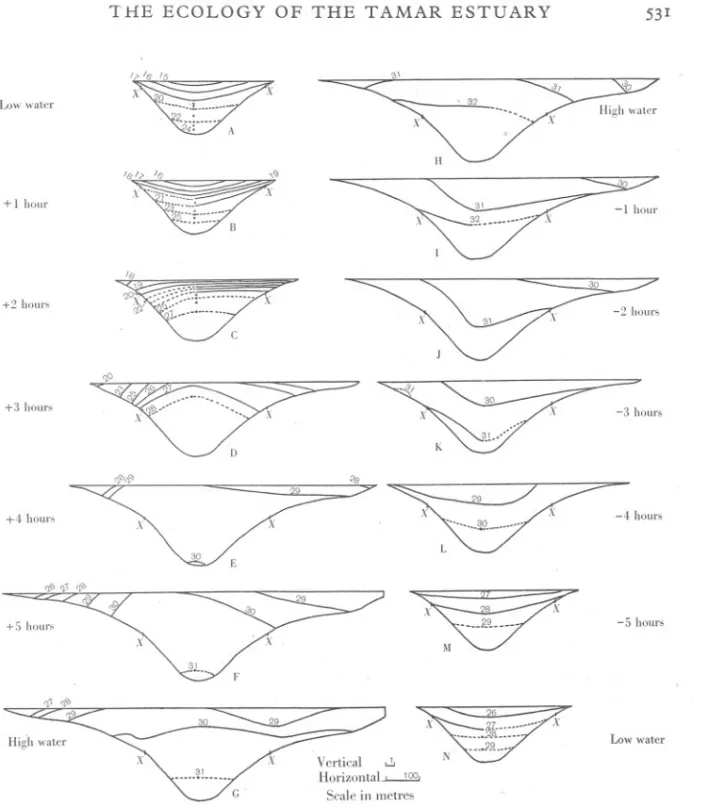
(2) 53°. A. MILNE. sentative estuarine position were made on a rising tide and on a falling tide. The rainfall was slightly above normal in the former and normal in the latter (see rainfall in Fig. 3). The first of these- sets of observations was carried out on May 24 1937, when the predicted height of the tide was 4"35 m., and the second on June 3, when it was 3"76 m. Normally tidal heights range from about,3 to 5 m. above chart datum. For the positions mentioned in this paper the map reproduced in Part I of this series (Hartley & Spooner, 1938) should be consulted. That the area under consideration in this ecological study is a natural compartment or division of the estuary is emphasized by the following extract from Percival (1929): "It would appear that the main body of incoming sea water does not pass Cargreen. A considerable portion goes into the Lynher and Tavy and covers the mud-flats on each side between Saltash and Neille* Point. A further large quantity is held over the flats between Neille Point and Hole's Hole." Our observations were made about midway between Saltash Bridge and Neal Point (7.7 km. from mouth of estuary), a position chosen because it lies near the middle of the area under consideration and in a fairly straight stretch of the river. Collections were taken (at hourly intervals) at nine points, marked by buoys, in the cross-section-one in mid-river and four in each of the intertidal areas from high-water mark to low-water mark" Sampling was done by means of a reversing bottle at t or 1 m. intervals from the bottom to the surface. Salinities were determined with immersion hydrometers and temperature corrections made. Depth was plotted against time for each of the nine stations and, upon these, isohaline curves were superimposed by means of salinity-depth curves; finally isohalines on a cross-section of the river at intervals of 1 hr. were drawn as in Fig. I. It is seen that on a rising tide the Cornish margin is a little less saline than the Devon, and on a falling tide the reverse is true. This lag may be explained by the contour of the river and does not alter the general fact that when the tide is rising there is an "up-bulging" of the more saline layers from the bottom in the middle; and when it is falling there is a "down-bulging" of the less saline or fresh layers of the river. This bulging is produced by friction at the edges, where the water is shallow, tending to retard water movement in that region as compared with the middle or deeper part. It must be remembered that the bulging is exaggerated in Fig. lowing to the differences between the horizontal and vertical scales. Owing to this bulging the surface water tends to be a little more saline in mid-river than at the edges at high water, and vice versa at low water" Fig. 1 shows that, in this region of the estuary, salinity stratification in mid-river at low water is much more pronounced than at high water, the range being greater though the salinity is less. The action of the river interferes slightly with the usual tidal oscillation. It would be interesting to know the magnitude, range and duration of * In these reports, following recent Ordnance maps, the spelling "Neal". is adopted..
(3) THE. ECOLOGY. '~. Low water. . ~--.;i"'". ~. +4 hours. p...;. ~. ~. ~. X. ". X. X. K. D. X. 30 .,.-' 31..". X. -3. hours. -. .. ~-"""" 30. E. + 5 hours. ,,1 ,,'0 ,,~. 53I. B. ~._._.--._-_. .. --'-. X ",/;,..,. ~~. ESTUARY. ,9. + 2 hours. +:J hours. TAMAR. A. 'e 1;> 10 + 1 hour. OF THE. ~~. -5 hours. 30 Low water. High water. Vertical,"" Horizontal~ Scalein metres Fig. 1. Isohalines on a cross-section of the Tamar Estuary (midway between Saltash and Neal Point). A-G on May 24, H-N on June 3 1937. X is low-water mark of equinoctial spring tides. Cornwall to the left, Devon to the right of each section. Dotted lines indicate insufficient data-sometimes only one record at the level in question. Single dots between isohaline curves indicate intermediate salinities, e.g. in Section A two dots between isohalines 17 and 20 show the levels in mid-river at which salinities of 18 and 190/00 were obtained. The sections represent conditions at hourly intervals between high and low water. \ I.
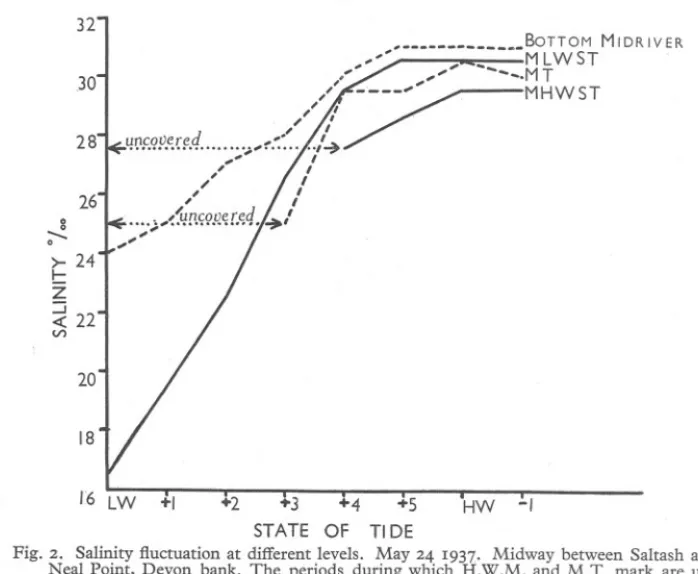
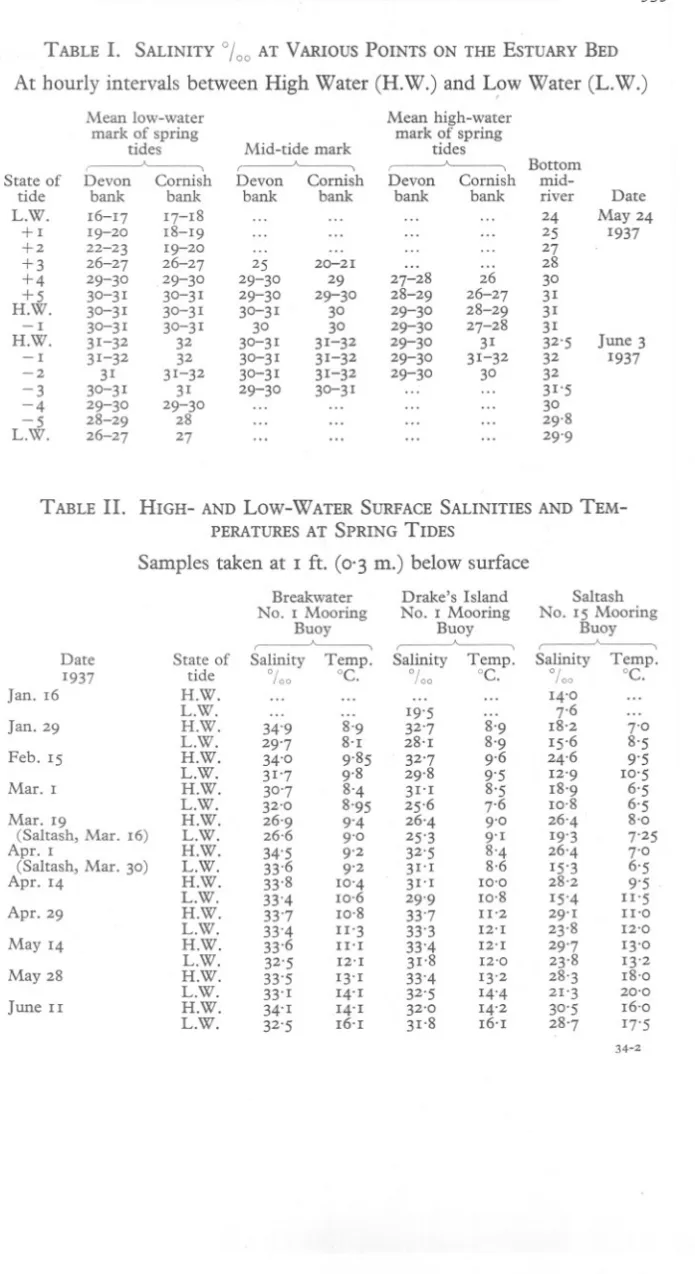
(4) A. MILNE. 532. incidence of salinities experienced by organisms at vario~s points on the. estuary bed over a period of several years.The work attached to such an investigation is not practicable, but some insight into got by a study of data compiled from Fig. I (see Fig. positions chosen' were (a) bottom mid-river, (b) mean tides, (c) mid-tide mark, and (d) mean low water of spring. the problem may be 2 and Table I). The high water of spring tides. The fluctuation. 32 30 28. ->-. 26. 8. 0. 24. t: Z ::i «22 V'). 20 18. /6 LW. +1. +2. +3 +4 +5 STATE OF TIDE. HW. -I. Fig. 2. Salinity fluctuation at different levels. May 24 1937. Midway between Saltash and Neal Point, Devon bank. The periods during which H.W.M. and M.T. mark are uncovered by the tide are indicated. M.L.W.S.T. is mean low-water (mark) of spring tides. M.H.W.S.T. is mean high-water (mark) of spring tides. M.T. is mid-tide mark. L.W. is low water; H.W. is high water. Numbers 1-5 represent hours.. in the water layers above bottom mid-river need not be studied because this region is inhabited principally by plankton which moves with the currents and therefore stays in water of more or less suitable salinity. The only animals of importance in this region are fishes which can avoid low salinities by going deeper, and also the organisms living on the mid-river buoys (the latter are dealt with in Part IV of this series). Fig. 2 is drawn from data obtained on the Devon shore on May 24; the conditions on the Cornish bank were similar. In this section of the estuary, near high-water mark, organisms suffer least fluctuation, and those near low-water mark suffer most; while those at midtide mark experience a fluctuation intermediate between these two. That is,. .~.
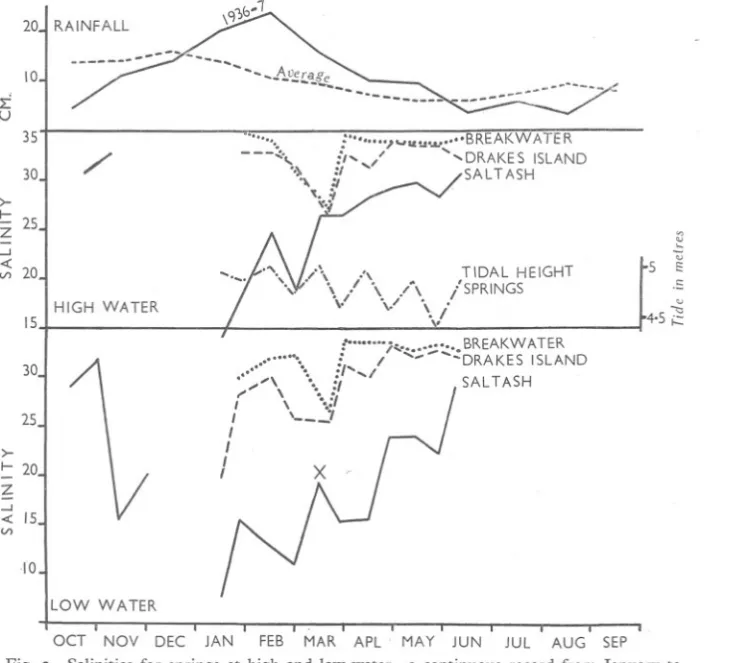
(5) THE. ECOLOGY. there is a fluctuation mark. An organism salinities possible in at high-water mark,. OF THE. ---~. ~~,~ge. --- ---------. 35. ""'". /'. i""';;""'",,'-v. ---~\).. >I-. Z. -'. ~. BREAKW ATER. it / ~. ""DRAKES ISLAND. '.1 ~:f. /SALTASH. '" ~ <) 5 EO. 25. ~ 20. /\.". \. HIGH WATER 15. /. \.. TIDAL. : 1 .',,'''''''. . i'/... ..I ,," \ '.:/. 30. ,""". \. I / /. 25.. .BREAKW. "':"---':DRAKES. ,,' "" I. HEIGHT. .S. \. /, /SPRINGS v' \;\.. !'''''''';''''. .. \:/. ~. 4.5 i:::.. ATER ISLAND. SALTASH. '-__7. ,. >-. !:. 533. \Cj')b_l. ~ u 30. ESTUARY. gradient decreasing from low-water mark to high-water at low-water mark experiences the greatest and least the intertidal area and indeed in the entire estuary bed; while the fluctuation is very much less, it is important. 20J RAINFALL 10. TAMAR. I. 20. -'. <c 15 II). .10. ILOW OCT Fig.. WATER NOV. DEC. JAN. FEB. MAR. APL. MAY. JUN. JUL. AUG. SEP. 3. Salinities for springs at high and low water-a continuous record from January to June 1937. Tidal height in metres. Total montWy rainfall for Tamar Valley Area (average of eight stations) 1936-7; and normal average montWy rainfall for Egloskerry (one of these stations). Point X is referred to in the text.. to note that it is also in the higher end of the salinity range. On proceeding from low-water mark to high-water mark the upper limit of the salinity range falls only very slightly, while the lower rises considerably. Thus the higher the level in the intertidal area at which an organism lives the more favourable the salinity conditions it will meet. Another aspect of possible biological importance is the duration of the period of fluctuation. Near high-water mark, not only is the fluctuation JOURN.. MAR. BIOL. ASSOC. vol.. XXII, 1938. 34.
(6) 534. A. MIL~E. smaller than at points lower in the intertidal area and higher in the salinity range, but organisms are subjected to fluctuation for a shorter time. Owing to stratification, the farther down one goes in the intertidal area the longer is the duration of incidence of the high salinity (cf. Figs. I and 2); this will be more evident in winter than in summer for stratification is more pronounced in rainy periods. Fig. 2 shows that organisms at bottom mid-river and at mid-tide mark (in this section of the estuary) experience a salinity fluctuation similar in range. The salinity change at mid-tide mark, however, takes place at approximately twice the rate of the change at the bottom mid-river; therefore the former position would be more dangerous to organisms affected by rate of fluctuation. At low-water mark the fluctuation was high-from 16 to 300/00 in about 4 hr.; this was followed by a high, relatively steady salinity (over 30%0) for 4 hr.; then as sudden a drop as the original rise in another 4 hr. The osmotic changes to which an organism would be subjected are thus considerable, i.e. ca. 10 atm. in 4 hr. The data given in Fig. 2 are for a specific day-May 24 1937, but considering the height of the tide, the rainfall and other factors, they cannot be very far short of normal winter conditions. The series for June 3 (see Table I) must approximate to summer conditions. Fluctuation may be a little less than on June 3 during drought, but it will be appreciably greater than on May 24 during a winter spate. Some indication of the maximum and minimum salinities for the season in question may be gained from Fig. 3 and data given on pp. 538-9. The effect of these positional fluctuations on the horizontal up-river penetration of marine organisms will be discussed in a later paper. SEASONAL SURFACE VARIATIONS IN SALINITY. In an investigation of the fauna and flora of the mid-river buoys it was found necessary to have some idea of the surface salinities in mid-river. They were taken at a depth of I ft. (0'3 m.). At high and low water of spring tides samples were regularly taken at three positions in the estuary (Table II) and supplemented by open-sea observations taken at the same time. At spring tides the maximum and minimum salinities (river-flow and wind being normal) may be expected since it is at this time that the sea advances and recedes farthest in any estuary. Saltash No. 15 Mooring Buoy (6 km. from mouth), and Drake's Island, No. I Mooring Buoy (- 2'5 km. from mouth), were taken always at exactly high and low water; Breakwater, No. I Mooring Buoy, * within 90 min. on either side of the tide on the few occasions on which the times of collection did not coincide * Position outside the area covered by the map of the estuary: it is well out in Plymouth Sound, 2 kIn. due S, of the W. end of Drake's Island.. -~.
(7) THE. ECOLOGY. TABLE I. SALINITY 0/00. OF THE. TAMAR. ESTUARY. 535. AT VARIOUS POINTS ON THE ESTUARY BED. At hourly intervals between High Water (H.W.) and Low Water (L.W.) Mean low-water mark of spring tides Devon bank. State of tide. Cornish bank. L.W.. 16-17. +1 +2 +3. 19-20 22-23 26-27 29-3° 3°-31 30-31 30-31 31-32 31-32 31 3°-31 29-3° 28-29 26-27. +4 +5. H.W. -I H.W. -I. -2 -3 -4 -5 L.W.. TABLE. Mid-tide Devon bank ... ... ... 25 29-3° 29-3° 3°-31 3° 3°-31 3°-31 3°-31 29-3° ... ... .... 17-18 18-19 19-20 26-27 29-3° 3°-31 3°-31 3°-31 32 32 31-32 31 29-3° 28 27. mark Cornish bank. Devon bank. Cornish bank. ... ... .... ... ... .... ... ... .... 20-21 29 29-3° 30 3° 31-32 31-32 31-32 3°-31 ... ... .... Date 1937. State of tide H.W. L.W.. 16. H.W.. Jan. 29. L.W. Mar.. IS. H.W.. I. L.W. H.W.. L.W. Mar. 19 (Saltash, Apr. I (Saltash, Apr. 14. Mar.. 16). H.W. L.W. H.W.. Mar.. 30). L.W. H.W.. Apr.. 29. L.W. H.W. L.W.. May. 14. H.W.. May 28 June. II. ... ... .... taken at I ft. (0'3 m.) below. Breakwater No. I Mooring Buoy. Feb.. 27-28 28-29 29-30 29-3° 29-3° 29-3° 29-3° .... ... 26 26-27 28-29 27-28 31 31-32 3° ... ... ... .... Bottom midriver 24 25 27 28 3° 31 31 31 32'5 32 32 31'5 3° 29.8 29'9. Date May 24 1937. June 3 1937. II. HIGH- AND LOW-WATER SURFACE SALINITIES AND TEMPERATURES AT SPRING TIDES Samples. Jan.. Mean high-water mark of spring tides. L.W. H.W. L.W.. H.W. L.W.. surface. Drake's Island No. I Mooring Buoy. Saltash No. IS Mooring Buoy. Salinity. Temp.. Salinity. Temp.. Salinity. 0/00. °C.. 0/00. °C.. 0/00. '" ... 34'9 29'7 34'0 31'7 3°'7 32'0 26'9 26.6 34'5 33.6 33'8 33'4 33'7 33'4 33.6 32'5 33'5 33'1 34'1 32'5. .... .... .... .... 19'5 32'7 28'1 32'7 29'8 31'1 25.6 26'4 25'3 32'5 31'1 31'1 29'9 33'7 33"3 33'4 31.8 33'4 32'5 32'0 31'8. 8'9 8'9 9.6 9'5 8'5 7.6 9'0 9'1 8"4 8,6 ro.o 10.8 II'2 12'1 12'1 12'0 13'2 14'4 14'2 16'1. 8'9 8'1 9.85 9'8 8'4 8'95 9'4 9'0 9'2 9'2 10'4 10.6 10.8 II'3 II'1 12'1 13'1 14'1 14'1 16'1. 14'0 7'6 18'2 15.6 24'6 12'9 18'9 10.8 26'4 19'3 26"4 15'3 28'2 15'4 29'1 23'8 29'7 23.8 28'3 21'3 3°'5 28'7. Temp. °c.. 7'0 8'5 9'5 10'5 6'5 6'5 8'0 7'25 7'0 6'5 9'5 II'S II'O 12'0 13'0 13'2 18'0 20'0 16'0 17'5 34-2.
(8) A. MILNE. 536. with high and low water. When samples were not taken on the exact date of springs, they were taken when the tide was still of spring magnitude according to the tide-table. At a position about half a mile above Hamoaze Buoy No. IS the following differences in the salinity of the surface layers were noted: Salinity (%0) difference between A. Surface. Surface and 1"8 m.. and 0"9 m. ;. ;. Date May 24 June 3. Max.. Min.. 1"9 I "I. 0"0 0"0. Max.. Mean 0"59:t 0"24:t. 0"22 0" 14. 3"4 1"2. Min. 0"0 0"0. Mean I"55:t 0.50 0"4I:t 0.16. These figures are a summary of conditions at hourly intervals from high to low water. It has been pointed out farther back that the data for May 24 may be taken as (roughly) representative of a condition not far short of normal winter condition, and that of June 3 as normal summer. The differences from the surface salinity are small in the first two metres and almost negligible in the first metre. Moreover, the differences between the salinity at the surface and the depths mentioned become less and less on proceeding seaward, till in the Sound, under the worst winter conditions, they are practically nonexistent. Fig. 3 and Table II show the fluctuation in salinity at 6 hr. intervals at each position. There is a fluctuation gradient increasing up-river from the seaward end of the estuary. Not only does the fluctuation increase in range in the up-river direction, but it also moves down in the scale of salinities-both high- and low-water salinities become less (as might be expected) and the low-water salinity decreases to a greater extent than the high-water salinity. The fluctuation is very great at Saltash. The greatest and least differences between the mid-river surface salinity at high water and the succeeding low water are: Saltash Drake's Island Breakwater. Greatest 12"8%0 5.5%0 5.2%0. difference (9"0 atm.) (3"5 atm.) (3.5 atm.). Least. difference. 1.8%0 (1"5 atm.) 0"2%0 ( ) 0"3%0 ( ). Figures in brackets are the resulting changes of osmotic pressure (corrected for temperature at the prevailing salinities).. The lowest low-water and the highest high-water salinity recorded during to June, 1937, are (%J Saltash, 7.6 and 3°.5; Drake's Island, 19.5 and 33.7; and Breakwater, 26.6 and 34.9. Here we have discussed spring tides as most likely to produce maximum and minimum salinity; but high and low values may sometimes be produced during neaps depending on the rainfall and wind. October 1936 was an exceptionally dry month and although rainfall in-. January.
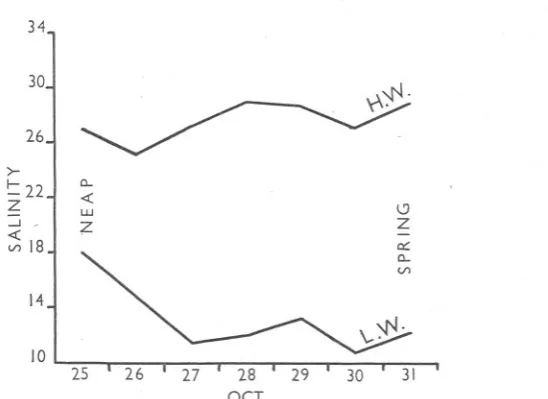
(9) THE. ECOLOGY. OF THE. TAMAR. ESTUARY. 537. creased towards the end of the month it was still below average. During the last week of the month a daily observation of surface salinity at high water and low water was made (Fig. 4) at Weirquay. There is an indication of greater fluctuation at springs than at neaps; and even in dry weather the fluctuation is very great. Fluctuation is greater and has a longer duration of incidence on a buoy than at a corresponding point intertidally (extreme lowwater mark excepted). 34 30. 26. >-. a.. «. 0 Z a:: a... LJj. 22l V). ;z:. 18. V). 14 10 25. .. Fig. 4. Dailysurfacesalinity. 0/00. 26. 27. . . . .. 28 29 30 31 OCT at high and low water from neap to spring at Weir quay. .. The regular sampling of surface salinities was carried out from January to June 1937, but five other spring tide observations were taken during October, November and December 1936 (see Fig. 3). RAINFALL AND SALINITY. Since rainfall influences salinity, the average total montWy rainfall from October 1936 to September 1937 is also given in Fig. 3. These values have been compiled from data supplied by the Cornwall Rainfall Association from eight stations distributed in the Tamar Valley area. Unfortunately the normal average for the area is available for one only of these eight stations, namely Egloskerry; this, for lack of better, has been included in Fig. 3 as illustrative of the normal average. Rainfall was extraordinarily high in the winter of 1936-7. Mr A. Pearse Jenkin, secretary to the Association, notes that at Redruth in Cornwall the rainfall for the first four months of 1937 was practically equal to the normal fall for the first eight months of the year. On comparing the rainfall curve with the salinity curves in Fig. 3 it will be seen that there is a noticeable lag between excessive rainfall and salinity.
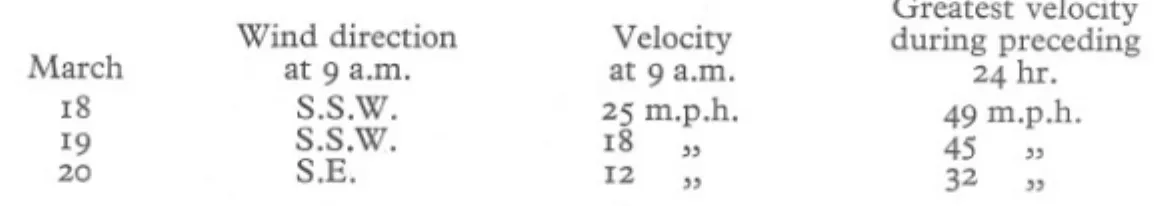
(10) A. MILNE. 538. depression. That the salinity curves are irregular is explained by the fact that wind and tidal height affect water movement also. For instance at point X (Fig. 3) salinity at low water is higher than might be expected taking tidal height and rainfall into account-it ought to have been at least 5%0 lower. Water movements in the Tamar Estuary. are affected by winds from about S.S.W. through S. to S.E. tending to pile water up-river; and winds from the opposite directions tending to push water down-river. At the point X, which was on March 19 1937, the Plymouth Meteorological Report gives: March 18 19 20. Wind direction at 9 a.m. S.S.W. S.S.W. S.E.. Velocity at 9 a.m. 25 m.p.h. 18 " 12 ". Greatest velocity during preceding 24 hr. 49 m.p.h. " 45 32 ". Thus the high salinity recorded at low water was due to the tide being prevented from flowing out to its fullest extent, even though it was a 5 m. tide. The effect of a continued southerly wind is to prevent the ebb flowing completely out of the estuary basin and to pile up the next flow still farther. If river level, tidal height and wind were known, other anomalies could be explained. OTHER SURFACE AND BOTTOM RECORDS OF SALINITY. Many samples were taken in the estuary of the River Tamar during the course of other work; these are not easily tabulated, but the following is a brief summary, from over 100 records, given in round figures for the sake of clarity; they are included for the use of other workers in this series. When considering mud-dwelling animals, it must be remembered that the salinity of interstitial water is always higher, usually much higher, than that of the overlying water (Tees Survey, 1935; Reid, 1930, 1932). For depths at the various stations see Part I of this series. Hamoaze near the outlet of St John's Lake (1'5-2 km. from mouth). In a normal winter the surface salinity at low water varies from 34 to 200/00; while at high water it varies from 35 to 30%0' Bottom salinity is generally well over 300/00 at all states' of the tide. In the exceptionally rainy months of January and February 1937, high-water salinities such as 14, 18 and 24%0 were recorded at the surface. In a normal summer, salinities are not much below open sea condition, and the lowering at low water is naturally much less than in winter. Saltash (6.8 km. from mouth). Fig. 3 and Table II give records of surface salinity in all sorts of conditions of spring tide, rainfall and wind, summer and winter. Fig. I and Table I, which refer to a station midway between Saltash and Neal Point, gives bottom. ~--'-"".
(11) THE. ECOLOGY. OF THE. TAMAR. ESTUARY. 539. and intertidal values in what might almost be taken as normal summer and winter conditions. The only other records available for Saltash are bottom salinities for the months of October, November and December of 1936 when the rainfall was only a little below the normal for winter: high water, 30-35%0; low water, 25-32%0, Neal Point (9 km. from mouth). In a normal winter, surface salinity at low water varies from about 7 to while at high water it ranges from 12 to 29%0' Bottom salinity is from 24 to 32%0 . Valuesas low as 4-7%0 have been recorded forlow-water surface in January and February 1937. In a normal summer, high-water surface may be as high as 33%0'. 26°/. 0O;. Weirquay (13 km. from mouth). In a normal winter, surface salinity at low water may fall to 1%°' and high water is quite commonly 23%0' Bottom salinity may be 16-25%0 at low water, though in excessively rainy periods it will fall much lower. In a normal summer, high-water surface salinity may reach 26%0, Pentillie Quay (16'5 km. from mouth). In a normal winter the surface salinity at low water ranges from less than 1%0 up to 5%0; at high water the surface is from 5 to 16%°' The lowest record from the bottom was 2%°' though the water may be almost fresh for a short time during a heavy spate. The normal summer surface salinity may reach as high as 24%0 at high water. Percival (1929) also gives high-water surface salinities for a dry summer at all these stations. Attention may here be drawn to the presence of a thin" skin" of practically fresh water on the surface at the upper stations for a short time immediately after an excessive downpour of rain. Spate waters from the Plym affecting the Sound. The Plym brings down large quantities of china-clay in colloidal form which give the water a milky appearance. If the wind is from the south, this clay water may be seen on the surface covering an area bounded by a line drawn through the north end of Rum Bay, No.1 Mooring Buoy Drake's Island, and the bathing pool just below the Laboratory. On January 13 1937, a surface sample just inside this area had a salinity of 16'2%0 as compared with a salinity of 28'2%0 on the surface just outside the area (the two sampling stations about 3° m. apart near Drake's Island)..
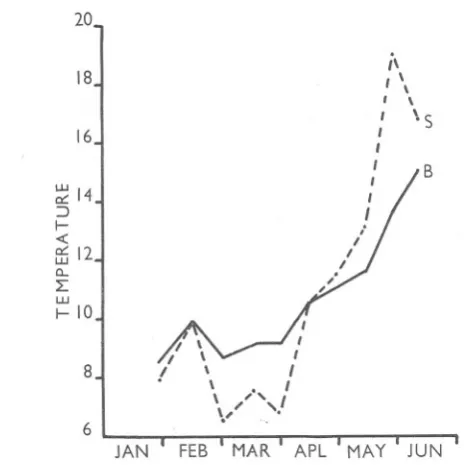
(12) A. MILNE. 54°. TEMPERATURE OF THE SURFACE WATERS. Morning high-water and afternoon low-water temperatures for springsat about 8 a.m. and 2 p.m. respectively-were taken fortnightly with standardized thermometers from January to June 1937 at 1 ft. below the surface (0'3 m.) at Saltash, Drake's Island and Breakwater in "mid-river" (Table II); temperatures were also taken at various positions in the open sea beyond the Breakwater. Fig. 5 contains only the Breakwater and Saltash average (between morning and afternoon) temperatures, for the sake of clearness. 20 ;\ 1\. 18. I I I I I I I. 16. ~ 14 ::J. \ \. S. B. I. I« ffi \2 c... L:. LU I- 10. 8 6 JAN. FEB. MAR. APL. . MAY' JUN. Fig. 5. Temperature (OC.) of surface waters at the Breakwater (B) and Saltash (8). This is the average between high-water (morning) and low-water (afternoon) temperature at . I ft. depth (0'3 m.).. In the winter sometimes the morning and sometimes the afternoon temperature was the higher; in the summer the afternoon temperature was always the higher. The differences between morning and afternoon tend to be least at the Breakwater and greatest at Saltash; they vary from 0'0 to 2'00 c., and are greatest in summer. Temperatures at Saltash were lower in winter and higher in summer than at the Breakwater (Fig. 5). Breakwater temperatures approximate to open sea temperatures; they show only a slight increase in range. Drake's Island records are similar to those at the Breakwater with a small increase in range; the bottom end of the range is lower-showing a decided tendency towards. --~.
(13) THE. ECOLOGY. OF THE. TAMAR. ESTUARY. 54!. the Saltash condition. Thus we see a gradient from open sea to Saltash, with the smallest range in the former and the greatest in the latter. The temperature records given are not to be taken as absolute maxima and minima for the period in question; they are intended only as an indication of the conditions prevailing. Maximum ranges recorded were: 8'1-16'1° C. 7.6-16'1° C. 6'5-20'0° C.. Breakwater.. . Drake's Island Saltash. There must be violent fluctuation in temperature, at least in the marginal waters if not in mid-river, when on a hot day the water runs in over the exposed mud-flats. In mid-river, however, the greatest changes in a fortnight were: Breakwater, 3'0° c., May-June; Drake's Island, 2'90 c., May-June; and Saltash, 7'0° c., May. The temperature increases gradually from winter to summer. Day-to-day fluctuations in temperature were not measured. Taken alone temperatures may have only a very small effect, but in conjunction with salinity their influence is much increased (cf. Huntsman, 1918) and this combined influence increases in the up-river direction. In estuaries farther north, such as the Dee in Aberdeenshire, very big fluctuations due to the mixture of the relatively warm sea water and large quantities of melted snow may be expected in winter; in such localities, low temperature might be of more importance as a limiting factor than in the Tamar. HYDROGEN-ION. CONCENTRATION. The Tamar draws much of its water from peat moor, but sea water is so well buffered that there was little evidence of acidity in the surface waters (at least in that section of the Tamar under consideration) on April 27 1937 when rainfall was of normal winter order, as shown below: High water at 8 p.m.. Samples from I ft. depth (0'3 m.). pH corrected for salt error.. Position Pentillie Saltash St John's Lake (Hamoaze end) Drake's Island. Salinity. Time 12 noon 6.40 p.m. 7.05 p.m.. pH 7'54 8'18 8'23. (0/00). 7.30 p.m.. 8'15. 33'9. 9'8 29'7 32"4. No continuous survey of pH was taken.. Thanks are due to Dr H. B. Moore for help in collecting of cross-section samples..
(14) A. MILNE. 542. SUMMARY. An attempt has been made to give the range and rate of fluctuation of salinity (and, to a lesser extent, of temperature) that organisms experience at various points on the bed of the lower Tamar Estuary and in the overlying water-especially near the surface. Such work until now does not seem to have been attempted. The following general facts emerge: On proceeding from high-water mark to low-water mark there is an increase in the range, rate and duration of fluctuation in salinity. Also the upper limit of the salinity range rises very slightly while the lower limit falls by a large amount, i.e. there is a more or less uniform gradient from high-water mark to low-water mark. Near high-water mark the fluctuation is less and of shorter incidence and is distributed over a higher level of the total salinity range (for the intertidal area) than near low-water mark. Owing to stratification, the farther down the intertidal area the (slightly) longer is the duration of the high salinities, especially in winter. At mid-tide mark the fluctuation is very similar to that on the bottom in mid-river, but is of twice the rate. Conditions in the surface waters at 1 ft. depth (0'3 m.), as representative of the top metre at least, were also investigated at fortnightly intervals summer and winter. Samples were taken at springs as being most likely to give an indication of maxima and minima, though wind, tidal height and river level may on occasion combine to give maxima and minima at neaps. As the average salinity decreases up-river the range of fluctuation increases. While both high- and low-water salinities fall, the latter falls more rapidly. Rainfall in the winter of 1936-7 was exceptionally heavy and there is a noticeable lag between excessive rainfall and depression of salinity. Rather more scanty data of salinity at various other stations in the region under consideration in this series are given for the use of other workers in the series. Temperature records for surface waters in summer and winter at springs show that on proceeding up-river (1) there is a slight daily fluctuation in midriver, (2) there is an increase in the annual range, i.e. the farther from the sea the colder it is in winter and the warmer in summer. REFERENCES ALEXANDER, W. B., SOUTHGATE, B. A. & BASSINDALE, R.; 1935. Survey of the River Tees. Part II. The Estuary-chemical and biological. D.S.I.R. Water Pollution Research, Tech. Paper NO.5, H.M. Stationery Office. HARTLEY,P. H. T. & SPOONER,G. M., 1938. The ecology of the Tamar Estuary. I. Introduction. Journ. Mar. Bio!. Assoc., Vol. XXII,pp. 501-8. HUNTSMAN, A. G., 1918. The vertical distribution of certain intertidal animals. Trans. Roy. Soc. Canada, Sect. IV, p. 53. PERCIVAL,E., 1929. A Report on the fauna of the estuaries of the River Tamar and River Lynher. Journ. Mar. Bio!. Assoc., Vol. XVI,p. 81. REID, D. M., 193°. Salinity interchange between sea water in sand and overflowing fresh water at low-tide. Journ. Mar. Bio!. Assoc., Vol. XVI,p. 609. 1932. Salinity interchange between sea water in sand and overflowing fresh water at low-tide. Journ. Mar. Bio!' Assoc., Vol. XVIII,p. 299. CAMBRIDGE:. PRINTED. BY W. LEWIS, M.A., AT THE UNIVERSITY. PRESS.
(15)
Figure
+4
Related documents
292 For exemple, in Romania, with in IMNA Bucharest was designed and manufactured the technical equipment EXPLANT 500 (figure 1) designed to extract
recently, there wasn’t a strong need for CenturyLink to add that feature for the Globe area. CenturyLink will be updating its equipment as will the County, which will enable caller
Resolved, the House of _____ concurring, That the 78th General Convention direct that the 2004 Model Policies developed by The Church Insurance Agency Corporation for
BRIEF DESCRIPTION OF PROJECT APPROVED FOR COLLECTION AND USE: Rehabilitate runway 1/19 and runway safety area, phase I Snow removal equipment.. Crack seal
The earliest sources to refer to the story of Hesiod’s death belong to the fifth century bc: Pindar mentions the tradition that the poet was young twice and had two graves,
– ntop users can also monitor VoIP without having to use any specialized VoIP traffic analysis application (VoIP is not a first class citizen)?. – The use of
Number Course # Credits Date and Location Contact Person and Phone Remarks Northwestern Health Sciences University 1403-76 Ethics, Risk Management and Record Keeping 6 Kingston,
Таблиця 1 Загальна характеристика процесу управління інтелектуальним капіталом на всіх його рівнях Рівень розгляду Чинники впливу на процес
