Sharif University of Technology
Scientia IranicaTransactions E: Industrial Engineering www.scientiairanica.com
Human errors incorporation in work-in-process group
manufacturing system
C.W. Kang, M. Ullah and B. Sarkar
Department of Industrial and Management Engineering, ERICA Campus, Hanyang University, Ansan, 426-791, Republic of Korea. Received 11 June 2015; received in revised form 1 May 2016; accepted 18 June 2016
KEYWORDS Human error Type I; Human error Type II; Group-technology; Optimal lot size.
Abstract. Decisions, about product acceptance or rejection, based on technical measurement report in ultra-precise and high-tech manufacturing environment is highly challenging as product reaches nal stage after high value-added processes. Moreover, the role of technical personnel in decision making process for inventory models with focus on group-technology manufacturing setup has been considered relatively less. Most of the literature assumes that decisions are perfect and error free. However, in reality, human errors exist in making such decisions based on measurement reports. This paper incorporates human errors into the decision making process focusing on group-technology inventory model, where high value-added machining processes are involved. Therefore, a mathematical model is developed for the optimal lot size considering human errors in the decision making process and the imperfect production process with focus on work-in-process inventory. Lot size is optimized based on average cost minimization by incorporating human error Type I and human error Type II. Numerical examples are used to illustrate and compare the proposed model with the previously developed models for group-technology high-tech manufacturing setups. The proposed model is considered more exible as it incorporates imperfection in process with human errors in decision making process. © 2017 Sharif University of Technology. All rights reserved.
1. Introduction
Work-In-Process (WIP) based inventory models for group-technology environment are highly recom-mended when manufacturing of production units takes a relatively longer time. Such type of conditions can be observed particularly in the eld of tool manufacturing, automobile industries, and aerospace products manu-facturing industries. Ullah and Kang [1] developed an inventory model for group-technology based manufac-turing environment focusing on work-in-process inven-tory. Their model answered several questions related to optimum lot size calculation for group-technology man-ufacturing setup. Manman-ufacturing process was assumed imperfect whereas process of inspection was considered
*. Corresponding author. Tel.: +82 1074981981;
E-mail address: [email protected] (B. Sarkar)
to be a perfect one. However, in most of the high-tech ultra-precise industries, as mentioned above, the role of decision makers regarding product qualication or rejection based on technical measurement report cannot be ignored. Decisions, taken by inspectors, play an important role as products reach decision stage after high value-added processes. Therefore, the role of hu-man errors associated with decision process regarding product qualication or rejection cannot be overlooked while developing such kind of models. The purpose of this study is to incorporate human errors in the decision making process that may aect optimum lot size in group-technology environment. Others who con-tributed to this specic direction of group-technology based inventory models include Boucher [2] and Bar-zoki et al. [3]. Boucher [2] introduced the concept of group-technology work environment and computed optimum lot size based on average cost minimization.
Barzoki et al. [3] extended his model by incorporating rework operation to rectify re-workable products. Their developed model was named group-technology order quantity model considering rework. Extensive research has been conducted in the eld of inventory manage-ment in general since the introduction of economic order quantity model in 1913 [4]. Researchers put their eorts to relax assumptions as per the realistic industry situations. One major assumption of these models is that processes are perfect and produce non-defective products. However, in reality, processes devi-ate from ideal conditions. Several internal and external factors aect the process, which result in defective products. The research carried out by Rosenblatt and Lee [5] remains among pioneers that introduced the idea of re-working defective products with certain cost. Porteus [6] pointed out that the process may go out-of-control during production process, resulting in defective products. The impact of defective products was highlighted in an Economic Order Quantity (EOQ) model. It was recommended that investment in quality improvement programs would decrease the probability of the process to go out-of-control.
Ben-Daya and Hariga [7] developed economic lot size policy by incorporating the eect of imperfect quality products and process restoration. Salameh and Jaber [8] considered imperfect quality products while using economic order quantity models. Lot size increased with increase in imperfect quality items. Later, Goyal and Cardenas-Barron [9] used a simple algebraic approach to calculate optimum lot size for Salameh and Jaber's model [8]. The results of this approach were almost similar to those obtained by Salameh and Jaber [8]. Jamal et al. [10] assumed imperfection in a single-stage manufacturing setup. It was considered that rework was performed either at the end of each cycle or at the end of N cycles. Cardenas-Barron [11] presented some modications to the model developed by Jamal et al. [10] and provided improved lot size policy through numerical examples. Biswas and Sarker [12] came with the idea that scrap products could be identied before, during, and after the rework process in a lean manufacturing system. Cardenas-Barron [13] further extended the model of Jamal et al. [10] by incorporating planned backorders to the single-stage manufacturing setup.
Maddah et al. [14] assumed that imperfect prod-ucts had their own importance in some industries and were not considered as a part of inventory. Two models were developed for optimum lot size and average cost minimization by considering that imperfect items were removed from inventory without any cost. Whereas, in the second case, imperfect items were shipped at cost with other perfect quality products. Wee and Widyadana [15] developed economic production lot size for deteriorating items. They assumed rework
operation for deteriorating items and stochastic pre-ventive maintenance policy using search technique. Sarkar and Moon [16] extended economic production order quantity model for imperfect production setup with stochastic demand distribution. It was assumed that life-time of defective products followed Weibull distribution. Sarkar [17] focused on reliability aspect of the production processes with prot maximization in an imperfect production setup. Control theory was used to develop an integrated cost function with reliability as decision variable. Recently, Pal et al. [18] developed a mathematical model by incorpo-rating stochastic demand and preventive maintenance schedule, following a known probability distribution. The model assumed that defective products were re-worked just after the regular production phase. Sarkar et al. [19] considered that imperfect items produced during processes followed either uniform, triangular, or beta distribution for the model developed by Cardenas-Barron [13]. Analytical methods were used to obtain the optimum lot size and backorder quantity at average cost minimization. Lin and Hou [20] recently developed an optimal lot size where re-workable items were stored in warehouse. They developed a new policy of overlap-ping and advance receiving in order to prevail good relationship between retailer and supplier. Taleizadeh et al. [21] used a simple approach to cycle time and backorder quantity optimization for an imperfect production setup. It was assumed that production was carried out under limited capacity of the manufacturing system.
Inspection has been considered as a process to decide about the product acceptance, rejection, and rework in comparison to the desired requirements. Salameh and Jaber [8] incorporated a screening process to extend the economic order quantity model. Their approach focused on screening at raw-material stage, i.e. before the manufacturing process. Production process was subject to random defect rate and 100% screening was performed at the end of each cycle. Ben-Daya and Rahim [22] assumed that the process might go out-of-control during the multistage production pro-cess and inspection was needed at every stage. Impact of inspection errors on lot size and total cost function was calculated. Taleizadeh et al. [23] developed pro-duction order model assuming that defective products produced either follow-normal or a uniform distribution with limited production by only one machine during the production cycle. Taleizadeh et al. [24] also developed two models for multiproduct single-machine scenario with emphasis on with or without immediate rework operation. Khan et al. [25] extended [8] the model by incorporating inspection errors in the proposed model. Inspection was considered imperfect with errors in inspection process. Hsu [26] modied few shortcomings in the mathematical model of [25]. Khan et al. [27]
introduced an idea of learning in inspection process. It was assumed that as production continued from one cycle to another one, knowledge was transferred through the learning process from one cycle to another one. Chen [28] added errors in the process of pre-ventive maintenance. It was assumed that prepre-ventive maintenance with error resulted in increased out-of-control state during the production process. Unit prot was maximized by incorporating inspection in-terval, inspection frequency, and production quantity. Taheri-Tolgari et al. [29] introduced an idea of prot maximization in addition to incorporation of Type I and Type II inspection errors. Inspection station was added at the end of processes in order to check the quality issues in reworked products. They assumed that the inspection of the last stage was error-free. All calculations were based on the present value of money. Recently, Mohammadi et al. [30] developed an integrated model by considering optimal production runtime with inspection schedule. Inspection was assumed to have errors. However, they assumed that inspection consumed a negligible time. Chang et al. [31], Sarkar and Saren [32], and Zhou et al. [33] are some, just to name few, who contributed to the same direction in the recent past.
The aforementioned models mainly focused on either economic order quantity or production order quantity model. Inspection errors were incorporated to make these models as realistic as possible in order to address industry problems. Most of these developed models helped organizations to calculate optimum lot size based on average cost minimization. However, these inventory models did not focus on the human aspect, whose role is highly signicant in making decision about the product qualication or rejection while considering WIP based inventory models. Man-ufacturing or inspection process may be imperfect due to dierent internal or external factors. This imperfect-ness aects optimum lot size calculation as observed in the literature. However, the soft side of these decision making processes (human errors) has been less concen-trated in the literature. Decisions taken by operators (humans) are aected by dierent factors, including skill level, job experience, training, job complexity, workload, mental and physical conditions, nancial status, and relationship with management. Therefore, probability of making errors during decision process exists. Consequently, the objective of this article is, as research gap exists, to incorporate human errors in decision making process for the group-technology based manufacturing organizations. A simple optimization approach has been used to calculate optimum lot size at average cost minimization. The rest of the paper is organized as follows:
The next section provides mathematical modeling including notation, assumptions, and problem
formula-tion. Numerical examples and results are discussed in Section 3. Conclusions, managerial insight, and future directions are presented in the last section.
2. Mathematical model
The mathematical model consists of notation, assump-tions, and problem formulation and modeling.
2.1. Notation
The following notation and assumptions are used in this mathematical model as used.
Parameters
D Customer demand in a cycle time (units/unit time)
CM Raw material cost per unit product
($/unit)
Cp Purchase cost per unit of cycle time
($/unit of time)
Cs Setup cost per unit of cycle time
($/unit of time)
Cmi Measurement cost per unit of cycle
time ($/unit of time)
CWIP Work-in-process holding cost per unit
of cycle time ($/unit of time)
Ch Inventory holding cost per unit of time
($/unit of time)
Ctotal Total cost per unit of cycle time
($/unit of time)
s Setup time for each lot (unit time/setup)
m1 Machining time for each product in
regular production phase (time/unit product)
mr Machining time for each re-workable
product (time/unit re-workable product)
P10 Poor quality products produced in
regular production phase (%)
P11 Perfect quality products produced in
regular production phase (%)
P21 Perfect quality products produced in
rework phase (%)
P20 Poor quality products produced in
rework phase (%)
P1r Re-workable products produced in
cycle time (%)
Pb Poor quality products in each cycle
(%)
Pg Perfect quality products produced in
Tc Cycle time
Tp Processing time
T Average manufacturing time for each product item
I Average inventory at the end of each cycle (units)
W Average monetary value of the WIP inventory ($)
i Inventory holding cost per unit of time ($/unit of time)
c Average unit value of each product cost (unit of money) ($/unit product) R Rate charged per unit of cell production
time including all overheads, moving cost, loading/unloading cost, etc. ($/unit of time)
Human error Type I (%) Human error Type II (%) Decision variable
Q Lot size per unit cycle time (units/unit
cycle time) 2.2. Assumptions
The following assumptions have been used:
1. Manufactured production units are processed through quality control section to measure fea-tures/characteristics developed during machining process;
2. Measurement is taken as a time consuming process;
3. Probability of committing human errors in decision making process is approximated and considered to be known;
4. Rework operation may produce poor quality prod-ucts;
5. Parameters including setup times, carrying charge, and machining time are xed and known;
6. Demand is known and continuous;
7. Shortage is not allowed.
2.3. Problem formulation and modeling
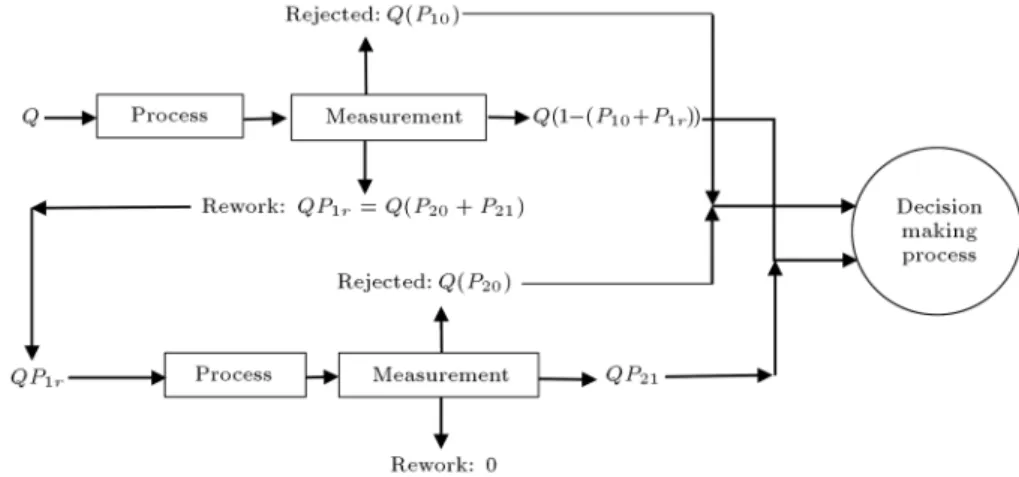
The working mechanism of a group-technology man-ufacturing setup is shown in Figure 1. In a group-technology manufacturing environment, lot size, Q, is arrived at the manufacturing cell and is processed through the manufacturing stations for similar kind of features. Manufactured production units then proceed towards measurement section of quality control to measure the features developed in products as per desired requirements. Technical measurement reports are generated (e.g., the report generated by using coordinate measurement machine, autocollimator, and prole projector) and processed for onward decision by inspectors at the decision support desk. It has been previously assumed that decisions taken based on the report are error free. However, in reality, human errors exist, which may aect lot size. Therefore, this model incorporates human errors in the developed work-in-process based inventory models.
Lot size, Q, arrives at the processing station in each cycle and stays for its onward process on the machine. Due to imperfection in machining process, QP10 percentage of products is rejected in the initial
phase and QP1r is the number of units that are
forwarded for rework operation. Q(1 (P10+ P1r))
is the number of production units considered to be qualied.
Re-workable products are processed again and QP20 units are considered defective in the second
phase of the same lot production, whereas QP21 units
are considered to be of good quality in the second phase. The paper assumes that no further re-workable products are produced in this lot manufacturing.
Measurement reports generated by the
Figure 2. Human errors impact on the lot received in the group-technology manufactured cell.
ment station are forwarded to the decision support desk. As mentioned earlier, human decision making process is aected by a number of factors. Therefore, chances of errors exist in the decision process. These associated errors are named human errors. The most common type of errors that may be committed during this process is classied under:
1. Human error Type I;
2. Human error Type II.
The impact of these human errors upon the manu-factured lot in the above-mentioned model has been highlighted in Figure 2.
During manufacturing of lot size Q, QPg = Q(1
Pb) is the proportion of production units that remain
qualied. Due to human error Type I, Q(1 Pb)() will
be the number of units that are considered defective although they are non-defective. The remaining Q(1 Pb)(1 ) are considered to be non-defective units.
Similarly, QPb is the proportion of products that
are rejected during the manufacturing process. How-ever, due to human error Type II, (QPb)(), production
units are considered non-defective although they are defective originally. On the other hand, (QPb)(1
) is the proportion of lot size that is considered to be defective products among the total defective production units.
It may be noted that customer returns those production units that have been wrongly considered as non-defective due to human error Type II. It is the responsibility of the manufacturing company to replace all such production units.
Therefore, in order to meet customer actual de-mand (D) in a production cycle, we have:
Q Q(1 Pb)() (QPb)(1 )DTc+(QPb)();
Q Q(1 Pb)() (QPb)(1 )=DTc+(QPb)();
Q Q(1 Pb)() (QPb)(1 ) (QPb)()=DTc:
After simplication:
Tc =Q(1 )(1 PD b): (1)
The total processing time (Tp) of lot size, Q, is the
sum-mation of setup time for each lot size, manufacturing time per unit item, measurement time per unit item (I), rework time, and re-measurement time for each unit. It is given by the following relation:
Tp = s + Qm1+ IQ + QmrP1r+ IQP1r: (2)
Average operation time can be obtained as follows:
T =TQp:
Machining times m1and mrare assumed to be dierent
as machining time of regular production might be dierent as compared to re-workable production units. It is known that, in a group-technology environ-ment, value is added to each product as it moves from raw material state towards the nal product. Therefore, average value added to each product during its manufacturing cycle is given by:
c=CM+R
s+Qm1+IQ+QmrP1r+IQP1r
Q
: (3) 2.3.1. Purchasing cost
Average cost associated with the raw material pur-chased for an imperfect manufacturing setup per unit cycle time is given by:
Cp= CMQ=Tc;
Cp= (1 PCMD
b)(1 ): (4)
2.3.2. Setup cost
Setup cost occurs once for lot size, Q, during each cycle and is assumed as Cs:
Cs= TA c;
Cs= Q(1 PAD
b)(1 ); (5)
where A is the setup cost. It is a product of setup time per cycle (s) and the rate charged by the production cycle (R).
2.3.3. Measurement cost
Measurement cost is of two types. In Phase 1, every production unit in lot is measured (100%) upon manufacturing. In Phase 2, re-workable products are measured. The measurement cost, Cmi, per unit of
cycle time is given by:
Cmi= IQT c +
IQP1r
Tc ;
Cmi= (1 PID
b)(1 )+
IDP1r
(1 Pb)(1 );
Cmi=
ID (1 Pb)(1 )
(1 + P1r): (6)
2.3.4. Inventory holding cost
The inventory holding cost per unit time is dened by the following equation [34]:
Ch= icI; (7)
where I is the average inventory over each cycle by the cycle period, having unit monetary value of c for each item and i as the carrying charge.
The average holding inventory is equal to the sum of nished production units that are declared to be good quality products by decision support desk and those defective products that are declared to be non-defective products due to human error:
I = 12(Q(1 Pb)(1 ) + (QPb)())Tc
Tc ;
I = 12(Q(1 Pb)(1 ) + (QPb)()): (8)
Given Eqs. (3) and (8), the inventory holding cost per unit of time will be:
Ch=12i CM+R
s+Qm1+IQ+QmrP1r+IQP1r
Q
(Q(1 Pb)(1 ) + (QPb)())
!
: (9)
2.3.5. Work-in-process holding cost
Silver et al. [34] highlighted that the work-in-process inventory holding cost could be calculated by:
CWIP= i W ; (10)
where i is the carrying charge per unit of time.
W = average work-in-process inventory.
W can be computed by summation of the following types of inventories in the workshop:
(a) Raw material (subassembly) units waiting for pro-cessing on machines;
(b) Production units that are rejected due to imper-fection of the production system;
(c) Production units rejected due to human error although they were non-defective (human error Type I);
(d) Accepted production units carried in a unit cycle;
(e) Production units considered to be qualied due to human error Type II.
Therefore, the average value of the total work-in-process inventory will be equal to:
W =
1
2QTp
Tc
CM +
1
2Q(Pb)(1 )Tp
Tc
c
+ 1
2Q(1 Pb)()Tp
Tc
c
+ 1
2Q(1 Pb)(1 )Tp
Tc
c +
1
2Q(Pb)Tp
Tc
c;
W =12QTTp
c (CM+ (Pb)(1 )c + (1 Pb)()c
+ (1 Pb)(1 )c + (Pb)()c);
W =12
D (1 Pb)(1 )
(s + Qm1+ QI
+ QP1rmr+ QP1rI)(CM + c):
Given Eq. (3), we have the average work-in-process inventory equal to:
W =12
D (1 Pb)(1 )
(s + Qm1+ QP1rmr+ QI + QIP1r)
2CM+RsQ +Rm1+RmrP1r+IR+IRP1r
: (11) Therefore, given Eqs. (10) and (11), the average car-rying charge of the work-in-process inventory will be equal to:
Cwip=12
Di
(1 Pb)(1 ) 2CM+
Rs Q+Rm1
+RmrP1r+IR+IRP1r
(s + Qm1
+ QP1rmr+ QI + QIP1r): (12)
2.3.6. Total cost per unit of time and optimum lot size Average total cost function is the sum of all related cost functions given by the following equations:
Ctotal= Cp+ Cs+ Cmi+ Ch+ Cwip; (13)
Ctotal=(1 PCMD b)(1 )
+Q(1 PAD
b)(1 )
+
ID (1 Pb)(1 )
(1 + P1r) +12i
CM
+R
s+Qm1+IQ+QmrP1r+IQP1r
Q
!
(Q(1 Pb)(1 ) + (QPb)())
!
+12
Di (1 Pb)(1 )
2CM +RsQ
+ Rm1+ RmrP1r+ IR + IRP1r
!
(s + Qm1+ QP1rmr+ QI + QIP1r):
Rearranging the above equation: Ctotal=(1 PCMD
b)(1 )
+Q(1 PAD
b)(1 )
+
ID (1 Pb)(1 )
(1 + P1r)
+2i((1 Pb)(1 ) + (Pb)())
(CM + Rm1+ IR) + (Rmr+ IR)P1r)Q
+iRs2 ((1 Pb)(1 ) + (Pb)())
+12
Di (1 Pb)(1 )
(m1+ mrP1r)
(2CM + Rm1+ RmrP1r)(I)(1 + P1r)
(2CM+2Rm1+2RmrP1r+IR+IRP1r)Q
+
Di (1 Pb)(1 )
(CMs + Rsm1
+ RsmrP1r+ IRs + IRsP1r): (14)
Factorizing the above equation, we have: Ctotal=
" i
2(1 Pb)(1 ) + (Pb)())
(CM + Rm1+ IR + (Rmr+ IR)P1r)
+1 2
Di (1 Pb)(1 )
f(m1+ mrP1r)
(2CM+ Rm1+ RmrP1r)
+ (I)(1 + P1r)(2CM+ 2Rm1+ 2RmrP1r
+ IR + IRP1rg
# Q +
"
AD (1 Pb)(1 )
+12
DiRs2
(1 Pb)(1 )
# 1 Q
+(1 PCMD
b)(1 )+
ID (1 Pb)(1 )
(1 + P1r) +
Di (1 Pb)(1 )
(CMs+Rsm1+RsmrP1r+IRs+IRsP1r)
+iRs
2 ((1 Pb)(1 ) + (Pb)()): (15) Assuming,
K1= (1 Pb)(1 );
K2= (K1+ (Pb)());
K3= fCM + Rm1+ IR + (Rmr+ IR)P1rg;
K4=f(m1+ mrP1r)(2CM + Rm1+ RmrP1r)
+ (I)(1 + P1r)(2CM + 2Rm1+ 2RmrP1r
+ IR + IRP1r)g;
K5=(CMs+Rsm1+RsmrP1r+IRs+IRsP1r):
Therefore, Eq.(14) becomes: Ctotal=
i
2K2(K3) + 1 2
Di K1
(K4)
Q
+
AD K1 +
1 2
DiRs2
K1
1 Q+
CMD
K1
+
ID K1
(1+P1r) +
Di K1
(K5)+iRs2 (K2):
Eq. (16) is of the form y(x) = a1(x) + ax2 + a3.
Therefore, algebraic optimization method can be used to obtain the optimum lot size by minimization of the total cost function (Eq. (16)).
x = r
a2
a1;
Q=
v u u u t
AD K1 +
1 2
DiRs2
K1
h
i
2K2(K3) +12
Di K1
(K4)
i: (17)
Eq. (17) gives the optimum lot size for WIP based in-ventory model considering human errors in the decision making process. The global minimum cost function is given by:
Ctotal(Q) = 2pa1a2+ a3;
Ctotal(Q) =
2 si
2K2(K3)+ 1 2
Di K1)
(K4)ADK 1 +
1 2
DiRs2
K1
+ CKMD
1 +
ID K1
(1+P1r)+
Di K1
(K5)+iRs2 (K2)
! :
(18) The following few special cases can be obtained from Eq. (17).
Special case 1: The optimum lot size obtained by Eq. (17) can be reduced to the lot size calculated by
Ullah and Kang [1], assuming that human errors do not exist.
Special case 2: The optimum lot size obtained by Eq. (17) can be reduced to the lot size of Boucher model [2] if it is assumed that the manufacturing process produces only perfect products, inspection or measurement process does not take any time, and hu-man errors do not exist in the decision making process.
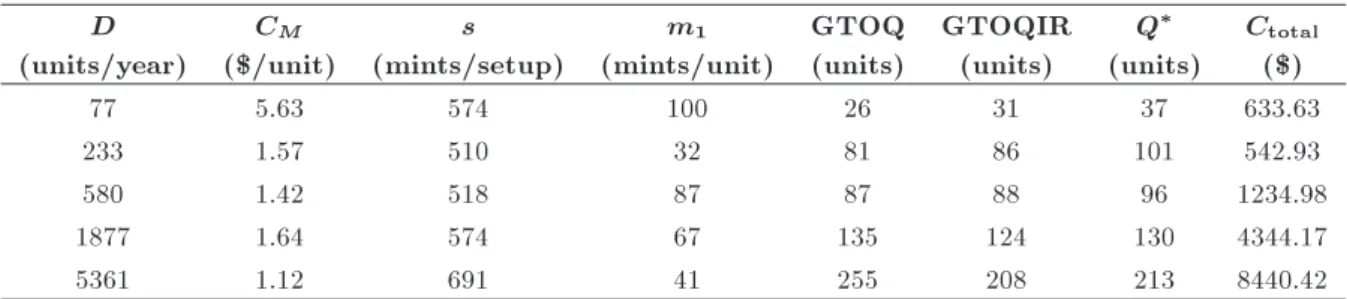
3. Illustration through numerical examples Five numerical examples have been used for numer-ical computation of the proposed model. Data has been obtained from US tool manufacturing company Barzoki et al. [3]. Models are compared based on their optimum lot size and optimum average cost. Demand rate, setup time, manufacturing time, and raw material cost are dierent for each example. However, process imperfection and measurement time have been assumed xed for all ve examples. Manufacturing process imperfection level is considered to be 20% for the rejected products, i.e. Pb = 20%, and 5% for
re-workable products. Moreover, human errors in the process of decision making are = 20% and = 5%. Optimum lot size for the GTOQ [2], GTOQIR [1], and our proposed model is shown in Table 1. Optimum total cost for the proposed model is shown in Tables 1 and 2. It can be observed that for xed values of human error in the decision making processes, the optimum lot size calculated by our proposed model is comparatively higher at lower values of demand rate. However, at higher demand rates, our proposed lot size is higher
Table 1. Comparison of models for dierent values of parameters (Example 1). D
(units/year)
CM
($/unit)
s (mints/setup)
m1
(mints/unit)
GTOQ (units)
GTOQIR (units)
Q
(units)
Ctotal
($)
77 5.63 574 100 26 31 37 633.63
233 1.57 510 32 81 86 101 542.93
580 1.42 518 87 87 88 96 1234.98
1877 1.64 574 67 135 124 130 4344.17
5361 1.12 691 41 255 208 213 8440.42
Table 2. Comparison of models for dierent values of human error Type I (Example 2).
D
(units/year)
s (mints/setup)
m1
(mints/unit)
GTOQ (units)
GTOQIR (units)
Q
(units)
Ctotal
($)
0 14000 204.00 0.12 959 1161 1154 17866.11
5 14000 204.00 0.12 959 1161 1209 18788.56
10 14000 204.00 0.12 959 1161 1269 19813.57
15 14000 204.00 0.12 959 1161 1336 20959.24
Figure 3. Lot size variation of the proposed model with increase in human error-Type I.
than that in the GTOQIR model and lower than that in the GTOQ model.
In Table 2, models are compared regarding their sensitivity against relatively higher demand rates with human error Type I. All parameters are assumed xed as in Example 2 [3]. Human error Type 1 varies from 0% to 20%, whereas human error Type II has been considered xed at 5%. Optimum lot sizes and optimum total costs are shown in Table 2. It can be observed that optimum lot sizes calculated by GTOQ and GTOQIR remain xed at dierent levels of human error in the decision making process. Variations of lot size in the proposed model with human error Type I have been shown in Figure 3. Lot size increases with increase in human error Type I. Similarly, total cost increases with increase in human error Type I.
The impact of human error Type II for Example 2 has been shown in Table 3. Human error Type II has been changed from 0 to 20% at a xed value of 10% for the human error Type I. Furthermore, percentage of rejection produced in the process is taken 20% and re-workable products are considered 5%. It can be observed that lot size decreases with increase in human error Type II. However, this change in optimum lot size in comparison to human error-Type I is relatively low. The change in optimal cost function is less signicant with change in human error Type II.
The relative signicance of the proposed lot size model under the inuence of human errors can be observed in Table 4. It can be observed that lot size increases with increase in errors during the decision making process. Sensitivity to those changes in optimal lot size by the most relevant models has also been shown. This sensitivity is higher than that in the GTOQ model, which is based on the assumption of perfect production processes without any process of decision making or inspection. Similarly, change in optimal lot size in comparison to imperfect production processes with perfect inspection (GTOQIR) is also signicant. The change in optimal cost function with human errors is highly signicant. Total system cost signicantly increases with increase in human errors
Table 3. Comparison of models for dierent values of human error Type II.
(%)
D (units/year)
s (mints/setup)
m1
(mints/unit)
GTOQ (units)
GTOQIR (units)
Q
(units)
Ctotal
($)
0 14000 204.00 0.12 959 1161 1277 19811.24
2 14000 204.00 0.12 959 1161 1274 19812.17
4 14000 204.00 0.12 959 1161 1271 19813.11
6 14000 204.00 0.12 959 1161 1268 19814.04
8 14000 204.00 0.12 959 1161 1265 19814.97
10 14000 204.00 0.12 959 1161 1262 19815.90
12 14000 204.00 0.12 959 1161 1259 19816.82
14 14000 204.00 0.12 959 1161 1255 19817.74
16 14000 204.00 0.12 959 1161 1252 19818.66
18 14000 204.00 0.12 959 1161 1249 19819.58
20 14000 204.00 0.12 959 1161 1246 19820.50
Table 4. Sensitivity analysis of models for dierent values of human errors Types I and II.
(%) (%)
GTOQ (units)
GTOQIR (units)
Q
(units) Q/GTOQ Q/GTOQIR
Ctotal
($)
0 0 959 1161 1161 1.21 1.00 17863.99
5 5 959 1161 1209 1.26 1.04 18788.56
10 10 959 1161 1262 1.32 1.09 19815.90
15 15 959 1161 1319 1.38 1.14 20964.12
20 20 959 1161 1381 1.44 1.19 22255.91
25 25 959 1161 1449 1.51 1.25 23719.98
30 30 959 1161 1524 1.59 1.31 25393.25
in the decision making process. It would be much appropriate for manufacturing engineers to consider human errors if technical personnel are involved in the decision making process as the impact is signicant.
4. Conclusions
Optimum lot size for group-technology based man-ufacturing environment, focusing on work-in-process inventory, has been developed. It was assumed, pre-viously, that process of decision regarding acceptance or rejection was perfect even in high-tech ultra-precise manufacturing setups. However, human errors exist, which aect optimal lot size. Eects of these human errors have been incorporated in this model for group-technology based manufacturing setups. An optimiza-tion approach was used to obtain the optimum lot size based on average cost minimization. Numerical examples were used to highlight the impact of hu-man errors on optimal lot size. Optimum lot sizes obtained were compared with those in the previously developed models. Sensitivity analysis highlighted the signicance of the proposed model in comparison to the existing models for group-technology manufacturing setups. Numerical examples emphasized that the eect of human error Type I on optimal lot size remained highly signicant in comparison to human error Type II. Cost has increased signicantly with increase in human error Type I. However, optimal lot size and cost were relatively less signicant for human error Type II. The paper provides an insight for manufacturing engineers working in group-technology environments to consider human errors associated with decision making process in ultra-precision manufactur-ing processes. The proposed model can be extended by incorporating shortages and machine breakdowns. An-other possible extension of the proposed model would be to consider the learning and forgetting phenomena during the rework process and decision making process, simultaneously. Moreover, the model can be extended by comparing these production order quantity models with Just In Time (JIT) approach based on total investment considering process imperfections in partic-ular.
References
1. Ullah, M. and Kang, C.W. \Eect of rework, rejects and inspection on lot size with work-in-process inven-tory", International Journal of Production Research, 52(8), pp. 2448-2460 (2014).
2. Boucher, T.O. \Lot sizing in group technology pro-duction systems", International Journal of Propro-duction Research, 22(1), pp. 85-93 (1984).
3. Barzoki, M.R., Jahanbazi, M. and Bijari, M. \Eects of imperfect products on lot sizing with work in process
inventory", Applied Mathematics and Computation, 217(21), pp. 8328-8336 (2011).
4. Harris, F.W. \How many parts to make at once", Operations Research, 38(6), pp. 947-950 (1990).
5. Rosenblatt, M.J. and Lee, H.L. \Economic production cycles with imperfect production processes", IIE trans-actions, 18(1), pp. 48-55 (1986).
6. Porteus, E.L. \Optimal lot sizing, process quality improvement and setup cost reduction", Operations Research, 34(1), pp. 137-144 (1986).
7. Ben-Daya, M. and Hariga, M. \Economic lot schedul-ing problem with imperfect production processes", Journal of the Operational Research Society, 51(7), pp. 875-881 (2000).
8. Salameh, M. and Jaber, M. \Economic production quantity model for items with imperfect quality", International Journal of Production Economics, 64(1), pp. 59-64 (2000).
9. Goyal, S.K. and Cardenas-Barron, L.E. \Note on: economic production quantity model for items with imperfect quality-a practical approach", International Journal of Production Economics, 77(1), pp. 85-87 (2002).
10. Jamal, A.M.M., Sarker, B.R. and Mondal, S. \Op-timal manufacturing batch size with rework process at a single-stage production system", Computers & Industrial Engineering, 47(1), pp. 77-89 (2004).
11. Cardenas-Barron, L.E. \On optimal manufacturing batch size with rework process at single-stage pro-duction system", Computers & Industrial Engineering, 53(1), pp. 196-198 (2007).
12. Biswas, P. and Sarker, B.R. \Optimal batch quantity models for a lean production system with in-cycle re-work and scrap", International Journal of Production Research, 46(23), pp. 6585-6610 (2008).
13. Cardenas-Barron, L.E. \Economic production quan-tity with rework process at a single-stage manufactur-ing system with planned backorders", Computers & Industrial Engineering, 57(3), pp. 1105-1113 (2009).
14. Maddah, B., Salameh, M.K. and Karame, G.M. \Lot sizing with random yield and dierent qualities", Applied Mathematical Modelling, 33(4), pp. 1997-2009 (2009).
15. Wee, H.M. and Widyadana, G.A. \Economic pro-duction quantity models for deteriorating items with rework and stochastic preventive maintenance time", International Journal of Production Research, 50(11), pp. 2940-2952 (2011).
16. Sarkar, B. and Moon, I. \An EPQ model with in-ation in an imperfect production system", Applied Mathematics and Computation, 217(13), pp. 6159-6167 (2011).
17. Sarkar, B. \An inventory model with reliability in an imperfect production process", Applied Mathematics and Computation, 218(9), pp. 4881-4891 (2012).
18. Pal, B., Sana, S.S. and Chaudhuri, K. \A mathemat-ical model on EPQ for stochastic demand in an im-perfect production system", Journal of Manufacturing Systems, 32(1), pp. 260-270 (2013).
19. Sarkar, B., Cardenas-Barron, L.E., Sarkar, M. and Singgih, M.L. \An economic production quantity model with random defective rate, rework process and backorders for a single stage production system", Journal of Manufacturing Systems, 33(3), pp. 423-435 (2014).
20. Lin, T.-Y. and Hou, K.-L. \An imperfect quality economic order quantity with advanced receiving", TOP, pp. 1-17 (2014).
21. Taleizadeh, A.A., Cardenas-Barron, L.E. and Mo-hammadi, B. \A deterministic multi product single machine EPQ model with backordering, scraped prod-ucts, rework and interruption in manufacturing pro-cess", International Journal of Production Economics, 150(0), pp. 9-27 (2014).
22. Ben-Daya, M. and Rahim, A. \Optimal lot-sizing, quality improvement and inspection errors for multi-stage production systems", International Journal of Production Research, 41(1), pp. 65-79 (2003).
23. Taleizadeh, A., Naja, A. and Akhavan Niaki, S. \Economic production quantity model with scrapped items and limited production capacity", Scientia Iran-ica Transaction E: Industrial Engineering, 17(1), pp. 58-69 (2010).
24. Taleizadeh, A.A., Sadjadi, S.J. and Niaki, S.T.A. \Multiproduct EPQ model with single machine, back-ordering and immediate rework process", European Journal of Industrial Engineering, 5(4), pp. 388-411 (2011).
25. Khan, M., Jaber, M.Y. and Bonney, M. \An Economic Order Quantity (EOQ) for items with imperfect qual-ity and inspection errors", International Journal of Production Economics, 133(1), pp. 113-118 (2011).
26. Hsu, L.-F. \Erratum to \An economic order quantity (EOQ) for items with imperfect quality and inspection errors", Int. J. Prod. Econ., 133, pp. 113-118 (2011)".
27. Khan, M., Jaber, M.Y. and Wahab, M.I.M. \Economic order quantity model for items with imperfect quality with learning in inspection", International Journal of Production Economics, 124(1), pp. 87-96 (2010).
28. Chen, Y.-C. \An optimal production and inspection strategy with preventive maintenance error and re-work", Journal of Manufacturing Systems, 32(1), pp. 99-106 (2013).
29. Taheri-Tolgari, J., Mirzazadeh, A. and Jolai, F. \An inventory model for imperfect items under inationary conditions with considering inspection errors", Com-puters & Mathematics with Applications, 63(6), pp. 1007-1019 (2012).
30. Mohammadi, B., Taleizadeh, A.A., Noorossana, R., and Samimi, H. \Optimizing integrated manufacturing and products inspection policy for deteriorating man-ufacturing system with imperfect inspection", Journal of Manufacturing Systems, 37, pp. 299-315 (2015).
31. Chang, C.T., Cheng, M.C. and Soong, P.Y. \Impacts of inspection errors and trade credits on the economic order quantity model for items with imperfect quality", International Journal of Systems Science: Operations & Logistics, 3(1), pp. 34-48 (2016).
32. Sarkar, B. and Saren, S. \Product inspection policy for an imperfect production system with inspection errors and warranty cost", European Journal of Operational Research, 248(1), pp. 263-271 (2016).
33. Zhou, Y., Chen, C., Li, C., and Zhong, Y. \A synergic economic order quantity model with trade credit, shortages, imperfect quality and inspection errors", Applied Mathematical Modelling, 40(2), pp. 1012-1028 (2016).
34. Silver, E.A., Pyke, D.F. and Peterson, R., Inventory Management and Production Planning and Scheduling, 3, Wiley New York (1998).
Biographies
Chang-Wook Kang received BS in Industrial Engi-neering from Hanyang University and PhD in Statis-tics from University of Minnesota in 1990. He has been teaching in the Department of Industrial and Management Engineering at Hanyang University since 1991. His main areas of research are SPC, project management, reliability engineering, and 6-sigma. He has written various books related to statistics and quality, such as `Probability and Statistics' and `Basic Statistical Tools for Improving Quality.' He has also published several research papers in international journals of repute. He was President of the Korean Society of Industrial and System Engineering and the Korean Society of Project Management.
Misbah Ullah is an Assistant Professor in Industrial Engineering Department, University of Engineering & Technology Peshawar, Pakistan. He received his PhD degree from Statistical Engineering for Advanced Qual-ity Laboratory, Hanyang UniversQual-ity, Republic of Korea. He received the BS degree in Mechanical Engineering in 2002 and the MS in Industrial Engineering in 2006. His area of interest includes quality control, quality management, 6-sigma, and design of experiment. He has several years of practical experience in high-tech industries. He has successfully undertaken various projects related to quality control and costing, and 6-sigma for the small- and medium-scale industries. He has published several papers in national and interna-tional journals.
Biswajit Sarkar is currently an Assistant Professor in the Department of Industrial and Management Engi-neering at Hanyang University, Korea. He was an As-sistant Professor in the Department of Applied Mathe-matics with Oceanology and Computer Programming,
Vidyasagar University, India, during 2010 to 2014. He served as an Assistant Professor in the Department of Mathematics at Darjeeling Government College, India, during 2009 to 2010. He received his BSc, MSc, and PhD degrees from Jadavpur University, India, in 2002, 2004, and 2010, respectively. He was awarded MPhil in 2008 at Annamalai University, India. His research includes optimization in inventory management, supply chain management, reliability, transportations, and production system. He has published several research
papers in international journals of repute, including European Journal of Operational Research, Inter-national Journal of Production Economics, Applied Mathematical Modelling, Applied Mathematics and Computation, Annals of Operation Research, Expert Systems with Applications, Economic Modelling, etc. Presently, he is serving as the Editorial Board Member of several journals. Recently, he became the Editor-in-Chief of the Journal of Engineering and Applied Mathematics, DJ Publications.