Preparation of Financial Statements and Audit Services Amendment No. 1
ATTACHMENT A
The following changes are hereby incorporated into the solicitation.
1. Section B.2.3 is deleted in its entirety and replaced as follows:
B.2.3 The Offeror can bid for both the financial preparation and the audit. However, the Offeror cannot perform both services. The District shall not select an Offeror to provide both the preparation and audit of the same service.
Preparation of Financial Statements and Audit Services Amendment No. 1
ATTACHMENT B
The following are responses to inquiries received.
Question 1. B.4.1 Pricing – Wanted to confirm that you do not require an estimated hours and fixed price per service as was required in past solicitations. Because of our experience we believe we would be more efficient in the performance of the requirements. We would not be able to demonstrate this benefit if a fixed price per service is not required.
Response The resultant contract will be an ID/IQ in which task orders will be issued for the requested services based on the hourly rates provided in the contract. Therefore there will be no change in the pricing schedule.
Question 2. B2.3 The Offeror shall not bid for both the financial preparation and the audit. Offerors shall submit their proposals to prepare financial statements or Audit the Statements.
a. Does this mean that the offeror must chose to bid on either the audit or the financial statement preparation and should not submit a proposal for both? This would not allow a firm who bids on and does not get the audit to bid on and get an award for the financial statement preparation.
Response See revision per Attachment A. The Contractor cannot perform both services but can bid on both. It will be up to the District to choose which services the Contractor will provide.
b. Can the offeror bid on all Components and let the District evaluate and decide what they are best qualified for?
Response Yes, the Offeror can bid on both components, but will not be chosen to perform both the preparation and the audit.
c. We are assuming this requirement only relates to Component I for Preparation of 401(a), 457 and 529 financial statements and Components 3 and 4 for the audits of those plans. In other words, if we must choose between bidding on Component I and Components III and IV that we may still bid on Component II regardless.
Response Please see the revision to the solicitation via Attachment A.
Question 3 How many hours were incurred to complete the prior year audits of the 457(b), 401(a) and 529 plans?
Preparation of Financial Statements and Audit Services Amendment No. 1
457(b) approximately 500 Hours 529 Plan approximately 700 Hours
OPEB approximately 1,000 Hours (preparation, review and schedules)
Question 4 How many audit seniors and staff auditors were utilized to complete the audits of the 457(b), 401(a) and 529 plans?
Response 401(a) Plan - 2 staff, 1 Senior, 1 Manager and 1 Partner 457(b) Plan - 2 Staff, 1 Senior, 1 Manager and 1 Partner 529 Plan - 1 staff, 2 Audit Seniors, 1 Manager and 1 Partner Question 5 Have there been any significant changes to the audits of the 457(b), 401(a) and
529 plans since the prior year audit?
Response No.
Question 6 Any major event that impacted the number of participants or the plan sponsor’s ability to fund contributions?
Response No.
Question 7 Were there changes or will there be changes to third party administrators and payroll vendors?
Response The 529 Plan would be impacted by a change to a new third party administrator in fiscal year 2017.
The OPEB Fund will have a new custodian in fiscal year 2017.
Question 8 Will SOC-1 Type 2 reports be available from the third party administrators and payroll vendors?
Response The SSAE-16 will be available from our third party administrators and payroll vendors.
Question 9 Do the plans prepare separate CAFRs?
Preparation of Financial Statements and Audit Services Amendment No. 1
Question 10 Will the prior year audited financial statements of the 457(b), 401(a) and 529 plans be made available prior to submission of proposal? If prior year audited financial statements will not be available before the proposal, can you share the list of investments for the plans?
Response Attached are the audited financial statements for all plans for fiscal year 2015. (See Attachments C,D,E )
Question 11 Did the plans adopt GASB 72 for plan year ended December 31, 2015 or will plan year December 31, 2016 be the first year of implementation?
Response The 529, 401(a) and 457(b) plans adopted GASB72 in fiscal year 2016, i.e., October 1, 2015 through September 30, 2016.
The OPEB Fund is on a September 30 fiscal year and GASB 72 was used to prepare the 2015 and 2016 financial statements.
Question 12 When are the actuarial reports expected to be available?
Response The latest actuarial report was issued in March, 2016 and it was prepared as of September 30, 2014.
Question 13 Do the actuaries perform benefit calculations or is this performed in-house?
Response Benefit calculations for our defined benefit plans are prepared in-house. Question 14 How often is an experience study performed and when was the last one
performed?
Response We completed an experience study in August 2015. We anticipate executing an experience study every five years.
Question 15 Is there an external reporting deadline that the plan are subject to, if yes, what is it?
Response See response to question #9.
Question 16 What is your expectation with respect to commencement and completion of the audits? What has it been in prior years and is there a desire to change the timelines?
Preparation of Financial Statements and Audit Services Amendment No. 1
Question 17 Can you please share who the most recent audit firm that audited the plans? Response - The 529 Plan was audited by Regis and Associates
- The 401(a) and 457(b) plans were audited by BCA WatsonRice
- The OPEB was audited by the District’s external auditors, SB & Company. Question 18 What have been the audit opinions (i.e., unmodified, modified, etc.) in the past 5
years?
Response All plans received unqualified, clean, opinions.
Question 19 Were there any internal control deficiencies noted by the auditors in the past 5 years?
Response No internal control deficiencies were noted for all plans.
Question 20 Has there been any difficulty providing information to the prior auditors?
Response The District is not aware of any difficulty in obtaining information from the prior auditors.
Question 21 Will you allow electronic exchange of information with the auditors i.e., secured email, secured FTP sites?
Response Yes.
Question 22 What was the total contract price for the audit of the plans last year?
Response 529 Audit $70,000 401(a) Audit $48,559 457(b) Audit $48,559
Question 23 What is your estimate of the level of effort required for the audits of each plan?
Response Best effort.
Question 24 Are there any Federal or state investigations focused on the plans or the way it is being administered?
Government of the District of Columbia
401(a) Defined Contribution Pension Plan
Financial Statements and
Independent Auditor’s Report
401(a) DEFINED CONTRIBUTION PENSION PLAN FINANCIAL STATEMENTS AND
INDEPENDENT AUDITOR’S REPORT YEARS ENDED SEPTEMBER 30, 2015 AND 2014
TABLE OF CONTENTS
PAGE
Independent Auditor’s Report ...1
Management’s Discussion and Analysis
(Required Supplementary Information - Unaudited) ...3
Basic Financial Statements
Statements of Fiduciary Net Position ...10
Statements of Changes in Fiduciary Net Position...11
Washington, DC 20037 www.bcawatsonrice.com
INDEPENDENT AUDITOR’S REPORT
Office of Finance and Treasury Office of the Chief Financial Officer Government of the District of Columbia
Report on the Financial Statements
We have audited the accompanying statements of fiduciary net position of the Government of the District of Columbia’s 401(a) Defined Contribution Pension Plan (the “Plan”) as of September 30, 2015 and 2014, and the related statements of changes in fiduciary net position for the years then ended and the related notes to the financial statements.
Management’s Responsibility for the Financial Statements
Management is responsible for the preparation and fair presentation of these financial statements in accordance with accounting principles generally accepted in the United States of America; this includes the design, implementation, and maintenance of internal control relevant to the preparation and fair presentation of financial statements that are free from material misstatement, whether due to fraud or error.
Auditor’s Responsibility
Our responsibility is to express an opinion on the financial statements based on our audit. We conducted our audit in accordance with auditing standards generally accepted in the United States of America. Those standards require that we plan and perform the audit to obtain reasonable assurance about whether the financial statements are free from material misstatement.
An audit involves performing procedures to obtain audit evidence about the amounts and disclosures in the financial statements. The procedures selected depend on the auditor’s judgment, including the assessment of the risks of material misstatement of the financial statements, whether due to fraud or error. In making those risk assessments, the auditor considers internal control relevant to the Plan’s preparation and fair presentation of the financial statements in order to design audit procedures that are appropriate in the circumstances, but not for the purpose of expressing an opinion on the effectiveness of the Plan’s internal control. Accordingly, we express no such opinion. An audit also includes evaluating the appropriateness of accounting policies used and the reasonableness of significant accounting estimates made by management, as well as evaluating the overall presentation of the financial statements.
Opinions
In our opinion, the financial statements referred to above present fairly, in all material respects, the respective financial position of the Plan, as of September 30, 2015 and 2014, and the respective changes in financial position for the year then ended in accordance with accounting principles generally accepted in the United States of America.
Other Matters
Accounting principles generally accepted in the United States of America require that the management’s discussion and analysis on pages 3 through 9 be presented to supplement the basic financial statements. Such information, although not a part of the basic financial statements, is required by the Governmental Accounting Standards Board who considers it to be an essential part of financial reporting for placing the basic financial statements in an appropriate operational, economic, or historical context. We have applied certain limited procedures to the required supplementary information in accordance with auditing standards generally accepted in the United States of America, which consisted of inquiries of management about the methods of preparing the information and comparing the information for consistency with management’s responses to our inquiries, the basic financial statements, and other knowledge we obtained during our audit of the basic financial statements. We do not express an opinion or provide any assurance on the information because the limited procedures do not provide us with sufficient evidence to express an opinion or provide any assurance
401(a) DEFINED CONTRIBUTION PENSION PLAN MANAGEMENT’S DISCUSSION AND ANALYSIS
YEARS ENDED SEPTEMBER 30, 2015 AND 2014
The following presents our discussion and analysis of the financial performance of the Government of District of Columbia’s 401(a) Defined Contribution Pension Plan (the “Plan”) for the fiscal years ended September 30, 2015 and 2014. This discussion and analysis should be read in conjunction with the financial statements and note disclosures.
The Plan was established under Government of the District of Columbia (the “District” or D.C.) Code 1-626.05(3). All District employees who were first hired on or after October 1, 1987 and have been employed a minimum of one year creditable service, are eligible to participate in the Plan. The District contributes 5% of eligible employees’ base salaries, except for detention officers, who receive a 5.5% contribution. Employees do not make any contributions to the Plan. The duties of the Plan Administrator are performed jointly by the District’s Office of the Chief Financial Officer, Office of Finance and Treasury, and the D.C. Department of Human Resources.
Overview of Financial Statements
The Plan’s financial statements consist of two basic financial statements: (a) Statement of Fiduciary Net Position and (b) Statement of Changes in Fiduciary Net Position. In addition to the basic financial statements are the notes to the financial statements.
Statement of Fiduciary Net Position presents the Plan’s assets and deferred outflow of resources, liabilities and deferred inflow of resources, and net position available for participant benefits.
Statement of Changes in Fiduciary Net Position presents the additions to and deductions from the Plan’s net position.
The notes to the financial statements provide a detailed discussion of key accounting policies and activities that occurred during the year. The notes provide additional information that is essential to a full understanding of the information provided in the financial statements.
2015 Financial Highlights
Investments decreased by $9,150,833 or 1.32%
Net investment loss was $26,011,561, compared to net investment income of $56,559,098 for the prior year.
District contributions increased by $680,807 or 1.35%
401(a) DEFINED CONTRIBUTION PENSION PLAN MANAGEMENT’S DISCUSSION AND ANALYSIS
YEARS ENDED SEPTEMBER 30, 2015 AND 2014
2014 Financial Highlights
Investments increased by $78,736,804 or 12.83%
Net investment income was $56,559,098, a decrease of approximately $3.0 million over the prior year.
District contributions increased by $3,435,884 or 7.32%
Benefits paid to participants increased by $934,028 or 3.43%
Financial Analysis – Fiduciary Net Position
Table 1 – Condensed Statements of Fiduciary Net Position as of September 30, 2015, 2014, and 2013
2014 2013 2015-2014 2014-2013 2015 (Restated) (Restated) $ Variance % Variance $ Variance % Variance
ASSETS
Investments $ 683,310,308 $ 692,461,141 $ 613,724,337 $ (9,150,833) -1.32% $ 78,736,804 12.83% Employer Contribution Receivables 3,032,152 3,639,187 3,441,242 (607,035) -16.68% 197,945 5.75% Due from Program Manager - 209,795 61,371 (209,795) -100.00% 148,424 241.85% Total Assets 686,342,460 696,310,123 617,226,950 (9,967,663) -1.43% 79,083,173 12.81%
LIABILITIES
Due to District Government 226,879 1,183,871 413,557 (956,992) -80.84% 770,314 186.27% Total Liabilities 226,879 1,183,871 413,557 (956,992) -80.84% 770,314 186.27%
Net Position Restricted for Pensions $ 686,115,581 $ 695,126,252 $ 616,813,393 $ (9,010,671) -1.30% $ 78,312,859 12.70%
Fiscal Year 2015
The Plan’s investments decreased by $9,150,833 or 1.32%, over the prior fiscal year. The decrease is primarily due to the net depreciation in the fair value of investments of $25.5 million during fiscal year 2015. Market conditions were less favorable during fiscal year 2015 compared to 2014, and as a result, most investment funds had negative rates of return. Effective September 18, 2015, the Plan Administrator changed Program Managers from Voya Retirement Services (Voya) to ICMA Retirement Corporation (ICMA-RC). Therefore, all investments at Voya were liquidated and new funds and portfolios were established and made available to Plan participants. As of September 30, 2015, a majority of the Plan’s investments were in the Vanguard Target Date Funds, which comprised 83.2% of the Plan’s total investments.
401(a) DEFINED CONTRIBUTION PENSION PLAN MANAGEMENT’S DISCUSSION AND ANALYSIS
YEARS ENDED SEPTEMBER 30, 2015 AND 2014
retire at set dates, and seeks to provide growth of capital and current income consistent with its current target allocation by investing in a gradually more conservative mix of Vanguard funds. Because the Plan commenced investing in the new funds on September 18, 2015, actual Plan performance for the twelve days was not available.
Table 2a - Investment by Fund with Percentage Asset Allocation as of September 30, 2015
Investment Percent Value of Total Assets
American Funds New Perspective Fund $ 24,253 -American Funds Fundamental Investors 1,543,899 0.2 Ariel Fund 8,721,717 1.3 BlackRock Liquidity Funds Federal Trust 18,802 -Brown Capital Mgmt 4,850,451 0.7 DC Plus Fixed Income Fund 7,347,022 1.1 DC Plus Large Cap Growth 9,205,027 1.3 DC Plus Large Cap Value 2,679,016 0.4 Harbor International Fund 4,423,015 0.6 Nuveen Real Estate Securities Fund 2,520,336 0.4 PIMCO Real Return Collective Trust II 270 -PIMCO All Asset Fund Institutional Class 162 -Vanguard Institutional Index Fund 18,604,454 2.7 Vanguard Small Cap Index Fund 67,975 -Vanguard Target Retirement Inc. 6,810,780 1.0 Vanguard Target Retirement 2010 15,036,313 2.2 Vanguard Target Retirement 2015 46,255,461 6.8 Vanguard Target Retirement 2020 81,563,288 11.9 Vanguard Target Retirement 2025 98,034,897 14.3 Vanguard Target Retirement 2030 101,594,879 14.9 Vanguard Target Retirement 2035 95,558,568 14.0 Vanguard Target Retirement 2040 59,795,102 8.7 Vanguard Target Retirement 2045 42,162,596 6.2 Vanguard Target Retirement 2050 17,636,857 2.6 Vanguard Target Retirement 2055 3,809,011 0.6 VantageTrust PLUS Fund 55,045,904 8.1 Virtus Emerging Markets Fund Class I 253
-683,310,308
$ 100.0
401(a) DEFINED CONTRIBUTION PENSION PLAN MANAGEMENT’S DISCUSSION AND ANALYSIS
YEARS ENDED SEPTEMBER 30, 2015 AND 2014
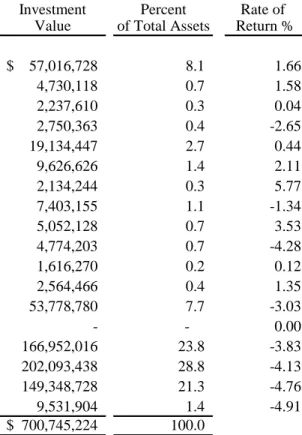
Table 2b - Investment by Fund with Rates of Return as of August 31, 2015
Investment Percent Rate of Value of Total Assets Return %
MetLife Stable Asset Fund $ 57,016,728 8.1 1.66 Western Asset Core Plus Bond Fund 4,730,118 0.7 1.58 MFS Total Return Fund 2,237,610 0.3 0.04 Invesco Growth & Income Fund 2,750,363 0.4 -2.65 SSgA S&P 500 Index Fund 19,134,447 2.7 0.44 The Growth Fund of America 9,626,626 1.4 2.11 Lazard US Mid Cap Equity Portfolio 2,134,244 0.3 5.77 Ariel Fund 7,403,155 1.1 -1.34 Ridgeworth Small Cap Growth Stock Funds 5,052,128 0.7 3.53 SSgA International Stock Selection Fund 4,774,203 0.7 -4.28 Neuberger Berman Fund 1,616,270 0.2 0.12 SSgA Clarion REIT Fund 2,564,466 0.4 1.35 SSgA Target Retirement Income Fund 53,778,780 7.7 -3.03 SSgA Target Retirement 2010 Fund - - 0.00 SSgA Target Retirement 2020 Fund 166,952,016 23.8 -3.83 SSgA Target Retirement 2030 Fund 202,093,438 28.8 -4.13 SSgA Target Retirement 2040 Fund 149,348,728 21.3 -4.76 SSgA Target Retirement 2050 Fund 9,531,904 1.4 -4.91
700,745,224
$ 100.0
Employer contribution receivables decreased by $0.61 million or -16.68% over the prior fiscal year due to a decrease in the amount due from the District at the end of the year.
The amount “Due to District Government” represents funds owed to the Plan Administrator to be used towards paying the Plan’s administrative expenses. The Program Manager provides revenue sharing funds to the Plan Administrator on a monthly basis. The funding is equal to 12 basis points (0.12%) of the Plan’s daily asset value through September 18, 2015 and 5.5 basis points (0.055%) afterwards.
Fiscal Year 2014
The Plan’s investments increased in value from 2013 by $78,736,804 or 12.83% to $692,461,141, primarily due to the Plan’s positive rate of return and required contributions from the District. Similar to fiscal year 2013, a majority of the Plan’s investments were in the SSgA Target Date Funds, which comprised 83.1% of the Plan’s total investments.
As noted on Table 2c - Investment by Fund with Rates of Return as of September 30, 2014,
401(a) DEFINED CONTRIBUTION PENSION PLAN MANAGEMENT’S DISCUSSION AND ANALYSIS
YEARS ENDED SEPTEMBER 30, 2015 AND 2014
A majority of the Plan’s investments continued to be in SSgA Target Retirement 2020 and SSgA Target Retirement 2030 funds reflecting the stability in the retirement trend of the Plan’s participants. The SSgA Target Retirement 2020 Fund had a rate of return of 9.32% and represented 24.4% of the Plan’s total investments. The SSgA Target Retirement 2030 Fund had a rate of return of 10.74% and represented 28.8% of the Plan’s total investments.
Table 2c - Investment by Fund with Rates of Return as of September 30, 2014
Investment Percent Rate of Value of Total Assets Return %
MetLife Stable Asset Fund $ 57,932,283 8.4 1.45 Western Asset Core Plus Bond Fund 5,127,255 0.7 5.68 MFS Total Return Fund 1,818,695 0.3 11.55 Van Kampen Growth & Income Fund 2,797,374 0.4 17.27 SSgA S&P 500 Index Fund 17,465,080 2.5 19.72 The Growth Fund of America 9,267,668 1.3 16.39 Lazard US Mid Cap Equity Portfolio 1,746,092 0.3 15.27 Ariel Fund 7,247,980 1.0 15.52 Ridgeworth Small Cap Growth Stock Funds 4,727,758 0.7 -3.94 SSgA International Stock Selection Fund 4,697,002 0.7 6.66 Neuberger Berman Fund 1,537,590 0.2 14.69 SSgA Tuckerman REIT Fund 2,872,957 0.4 14.22 SSgA Target Retirement Income Fund 7,861,249 1.1 5.20 SSgA Target Retirement 2010 Fund 51,138,440 7.4 5.74 SSgA Target Retirement 2020 Fund 168,831,903 24.4 9.32 SSgA Target Retirement 2030 Fund 199,371,558 28.8 10.74 SSgA Target Retirement 2040 Fund 142,594,707 20.6 11.28 SSgA Target Retirement 2050 Fund 5,425,550 0.8 11.29
692,461,141
$ 100.0
Employer contribution receivables increased by $0.20 million or 5.75% over the prior fiscal year due to an increase in the amount due from the District at the end of the year.
401(a) DEFINED CONTRIBUTION PENSION PLAN MANAGEMENT’S DISCUSSION AND ANALYSIS
YEARS ENDED SEPTEMBER 30, 2015 AND 2014
Financial Analysis – Changes in Fiduciary Net Position
Table 3 – Condensed Statements of Changes in Fiduciary Net Position for Fiscal Years Ended September 30, 2015, 2014 and 2013
2014 2013 2015-2014 2014-2013
2015 (Restated) (Restated) Variance % Variance $ Variance % Variance ADDITIONS
District Government Contributions $ 51,058,511 $ 50,377,704 $ 46,941,820 $ 680,807 1.35% $ 3,435,884 7.32% Net Investment (Loss) Income (26,011,561) 56,559,098 59,520,365 (82,570,659) -145.99% (2,961,267) -4.98% Total Additions 25,046,950 106,936,802 106,462,185 (81,889,852) -76.58% 474,617 0.45%
DEDUCTIONS
Benefits Paid to Participants 33,693,875 28,142,909 27,208,881 5,550,966 19.72% 934,028 3.43% Administrative Expenses - - 161,079 - 0.00% (161,079) -100.00% Other Deductions 363,746 481,034 436,564 (117,288) -24.38% 44,470 10.19% Total Deductions 34,057,621 28,623,943 27,806,524 5,433,678 18.98% 817,419 2.94%
Net Increase (Decrease) (9,010,671) 78,312,859 78,655,661 (87,323,530) -111.51% (342,802) -0.44%
Net Position Restricted for Pensions,
Beginning of Year 695,126,252 616,813,393 538,157,732 78,312,859 12.70% 78,655,661 14.62% Net Position Restricted for Pensions, End
of Year $ 686,115,581 $ 695,126,252 $ 616,813,393 $ (9,010,671) -1.30% $ 78,312,859 12.70%
Fiscal Year 2015
The District was required to contribute $56,132,815 to the plan during the fiscal year, which was a 8.75% increase from the prior fiscal year. However, the actual amount contributed, including receivables, by the District was $51,058,511 an increase of 1.35%. The District used the Plan’s forfeiture funds to pay $5,074,304 of the contributed amount. Under the Plan’s laws and regulations, the District can use the forfeiture funds to either reduce its contributions or to pay the Plan’s administrative expenses.
The Plan’s net investment loss was $26,011,561 in fiscal year 2015, compared to a net investment income of $56,559,098 for fiscal year 2014. The decrease in net investment income was primarily due to significantly less favorable market conditions in fiscal year 2015 compared with 2014. At August 31, 2015, eight (8) of the eighteen (18) funds of the Plan reflected negative rates of return ranging from -1.34% to -4.91%. The other ten (10) funds reflected positive rates of return ranging from 0.00% to 5.77%. The change is attributed to an increase in the Plan’s overall weighted average rate of return which was -3.24% for eleven months to August 31, 2015 compared to 9.54% for fiscal year 2014.
401(a) DEFINED CONTRIBUTION PENSION PLAN MANAGEMENT’S DISCUSSION AND ANALYSIS
YEARS ENDED SEPTEMBER 30, 2015 AND 2014
Fiscal Year 2014
The District was required to contribute $51,543,475 to the plan during the fiscal year, which was a 6.87% increase from the prior fiscal year. However, the actual amount contributed, including receivables, by the District was $50,377,704 an increase of 7.32%. The District used the Plan’s forfeiture funds to pay $1,165,772 of the contributed amount. Under the Plan’s laws and regulations, the District can use the forfeiture funds to either reduce its contributions or to pay the Plan’s administrative expenses.
The Plan’s net investment income was $56,559,098 in fiscal year 2014, a decrease of $2,961,267 or 4.98%. The change is attributed to an increase in the Plan’s overall weighted average rate of return which was 9.43% for 2014 compared to 11.25% for 2013.
Benefits paid to participants increased by $934,028. The total number of participants terminated from the Plan for fiscal year 2014 was 866 compared to 952 in fiscal year 2013.
Contact Information
401(A) DEFINED CONTRIBUTION PENSION PLAN STATEMENTS OF FIDUCIARY NET POSITION
SEPTEMBER 30, 2015 AND 2014
The accompanying notes are an integral part of these financial statements. 2014 2015 (Restated)
ASSETS
Investments:
Registered Investment Companies $ 628,264,404 $ 634,528,858
VantageTrust PLUS Stable Value Fund 55,045,904
-MetLife Stable Value Fund - 57,932,283
Total Investments 683,310,308 692,461,141
Receivables:
Employer Contribution 3,032,152 3,639,187
Due from Program Manager - 209,795
3,032,152
3,848,982
Total Assets 686,342,460 696,310,123
LIABILITIES
Due to District Government 226,879 1,183,871
Total Liabilities 226,879 1,183,871
401(A) DEFINED CONTRIBUTION PENSION PLAN STATEMENTS OF CHANGES IN FIDUCIARY NET POSITION
YEARS ENDED SEPTEMBER 30, 2015 AND 2014
The accompanying notes are an integral part of these financial statements.
2014 2015 (Restated)
ADDITIONS
District Government Contributions $ 51,058,511 $ 50,377,704
Investment Income:
Net (Depreciation) Appreciation in Fair Value of Investments (25,472,336) 58,488,293
Dividends 3,546,444 2,089,756
Less: Investment Management Fees (4,085,669) (4,018,951)
Net Investment (Loss) Income (26,011,561) 56,559,098
Total Additions 25,046,950 106,936,802
DEDUCTIONS
Benefits Paid to Participants 33,693,875 28,142,909
Administrative Expenses -
-Other Deductions 363,746 481,034
Total Deductions 34,057,621 28,623,943
Net (Decrease) Increase (9,010,671) 78,312,859
401(A) DEFINED CONTRIBUTION PENSION PLAN NOTES TO FINANCIAL STATEMENTS
SEPTEMBER 30, 2015 AND 2014 NOTE 1 DESCRIPTION OF THE PLAN
The Government of the District of Columbia (the “District”) offers a Defined Contribution Pension Plan (the “Plan”) that was established under D.C Code 1-626.05(3). All District employees who were first hired on or after October 1, 1987 and have been employed a minimum of one year are eligible to participate in the Plan. The District contributes 5% of eligible employees’ base salary for all employees, except detention officers. Detention officers receive a 5.5% contribution of their base salary. Participants do not make any contributions to the Plan.
The District’s Office of the Chief Financial Officer (OCFO), Office of Finance and Treasury, and D.C. Department of Human Resources are joint Plan Administrators. They are jointly responsible for adopting the Plan’s administration rules and regulations, investment policies, and overseeing the duties of the Plan’s Program Manager. In 2002, the OFT contracted with Voya Retirement Services (“Voya”) (formally ING) to be the Plan’s Program Manager. Effective September 18, 2015, the Plan changed Program Manager from Voya to ICMA Retirement Corporation (“ICMA-RC”). The Program Manager performs the Plan’s marketing and enrollment duties and is also the Trustee of the Plan. As the Trustee, the Program Manager has custody of the Plan’s assets and is responsible for the recordkeeping and reporting.
The Plan’s Program Manager maintains an account for each participant that is adjusted for contributions, withdrawals, investment earnings and losses, and Plan fees. Prior to December 8, 2009, a participant is 100% vested once the participant (1) attains five years of creditable service, (2) becomes disabled, or (3) dies. After that date, a participant is vested at certain percentages based on the years of creditable services, which is as follows:
Less than 2 years 0%
2 years 20%
3 years 40%
4 years 60%
5 or more years 100%
401(A) DEFINED CONTRIBUTION PENSION PLAN NOTES TO FINANCIAL STATEMENTS
SEPTEMBER 30, 2015 AND 2014 NOTE 1 DESCRIPTION OF THE PLAN (Continued)
Plan Membership
The Plan’s membership consisted of the following at September 30, 2015 and 2014:
2015 2014
Active 18,310 16,532
Inactive 5,749 7,013 Total 24,059 23,545
NOTE 2 SUMMARY OF SIGNIFICANT ACCOUNTING POLICIES
Basis of Presentation
The Plan’s financial statements are presented in accordance with Governmental Accounting Standards Board (“GASB”) which requires two basic financial statements: statement of fiduciary net position and statement of changes in fiduciary net position. For financial reporting purposes, the Plan is considered a pension trust.
Basis of Accounting
The Plan’s financial statements are prepared under the accrual basis of accounting. District contributions are recognized by the Plan when the payments become due from the District government. Investment income is recognized when earned. Deductions are recognized when due in accordance with the terms of the Plan.
Investment Valuation
401(A) DEFINED CONTRIBUTION PENSION PLAN NOTES TO FINANCIAL STATEMENTS
SEPTEMBER 30, 2015 AND 2014
NOTE 2 SUMMARY OF SIGNIFICANT ACCOUNTING POLICIES (Continued)
Purchases and sales of securities are recorded on a trade-date basis. Interest income is recorded on the accrual basis. Dividends are recorded on the ex-dividend date. Net appreciation (depreciation) includes the Plan’s gains and losses on investments bought and sold as well as held during the year.
Payment of Benefits
Benefit payments are recorded as deductions when due for payment.
District Contributions
Contributions are recognized as revenue to the Plan when payments become due from the District government on its specified payroll pay dates.
Tax Status
The Plan is an eligible employer defined Contribution Pension Plan under Section 401(a) of the Internal Revenue Code.
Reclassification
Certain prior year balances may have been reclassified to conform with the current year presentation. These reclassifications have no effect upon reported net position available for benefits.
Use of Estimates
The preparation of financial statements in conformity with accounting principles generally accepted in the United States of America requires management to make estimates and assumptions that affect the reported amounts of assets and liabilities and disclosure of contingent assets and liabilities at the date of the financial statements and the reported amounts of revenues and expenses during the reporting period. Actual results could differ from those estimates.
Accounting Pronouncements Adopted
401(A) DEFINED CONTRIBUTION PENSION PLAN NOTES TO FINANCIAL STATEMENTS
SEPTEMBER 30, 2015 AND 2014
NOTE 2 SUMMARY OF SIGNIFICANT ACCOUNTING POLICIES (Continued)
GASB has issued Statement No. 71, Pension Transition for Contributions made Subsequent to the Measurement Date – an amendment of GASB statement No. 68. This statement relates to amounts associated with contributions, if any, made by state or local government employer or non-employer contributing entity to a defined benefit pension plan after the measurement date of the government’s beginning net pension liability. This Statement is effective for fiscal years beginning after June 15, 2014. The adoption of the pronouncement did not have an impact on the Plan’s financial statements.
Accounting Pronouncements to be Adopted
GASB has issued Statement No. 72, Fair Value Measurement and Application, which defines fair value and describes how fair value should be measured, what assets and liabilities should be measured at fair value, and what information about fair value should be disclosed in the notes to the financial statements. Under the new guidance, fair value disclosures have been expanded to categorize fair value according to their relative reliability and to describe positions held in many alternative investments. This Statement is effective for fiscal years beginning after June 15, 2015. The Plan is assessing the impact on its financial statements upon adoption.
GASB Statement No. 74, Financial Reporting for Postemployment Benefit Plans Other Than Pension Plans, replaces GASB Statement No. 43, Financial Reporting for Postemployment Benefit Plans Other Than Pension Plans. Statement 74 addresses the financial reports of defined benefit OPEB plans that are administered through trusts that meet specified criteria. The Statement requires a statement of fiduciary net position, a statement of changes in fiduciary net position, more extensive note disclosures and RSI related to the measurement of the OPEB liabilities for which assets have been accumulated, including information about the annual money-weighted rate of return on plan investments. Statement 74 also sets forth note disclosure requirements for defined contribution OPEB plans. This Statement is effective for fiscal years beginning after June 15, 2016. The adoption of the pronouncement is not expected to have an impact the Plan’s financial statements.
401(A) DEFINED CONTRIBUTION PENSION PLAN NOTES TO FINANCIAL STATEMENTS
SEPTEMBER 30, 2015 AND 2014
NOTE 2 SUMMARY OF SIGNIFICANT ACCOUNTING POLICIES (Continued)
supplementary information about their OPEB liabilities. This Statement is effective for fiscal years beginning after June 15, 2017. The adoption of the pronouncement is not expected to have an impact the Plan’s financial statements.
GASB has issued Statement No. 76, The Hierarchy of Generally Accepted Accounting Principles for State and Local Governments, which reduces the GAAP hierarchy to two categories of authoritative GAAP from the four categories under GASB Statement No. 55, The Hierarchy of Generally Accepted Accounting Principles for State and Local Governments. The first category of authoritative GAAP consists of GASB Statements of Governmental Accounting Standards. The second category comprises GASB Technical Bulletins and Implementation Guides, as well as guidance from the AICPA that is cleared by the GASB. This Statement is effective for fiscal years beginning after June 15, 2015. The adoption of the pronouncement is not expected to have an impact on the Plan’s financial statements.
NOTE 3 INVESTMENTS
The Plan’s investments in Registered Investment Companies are stated at fair market value. The stable value fund is recorded at contract value, which approximates fair value. As of September 30, 2015 and 2014, the stable value funds were valued at $55,045,904 and $57,932,283, respectively.
At September 30, 2015 and 2014, the Plan’s total investments were valued at $683,310,308 and $692,461,141, respectively.
The Plan’s investments are subject to the following risks common to investments:
401(A) DEFINED CONTRIBUTION PENSION PLAN NOTES TO FINANCIAL STATEMENTS
SEPTEMBER 30, 2015 AND 2014 NOTE 3 INVESTMENTS (Continued)
Credit Risk is the risk that an issuer to an investment will not fulfill its obligations. The Plan does not invest in securities that have an overall quality less than BBB as rated by Moody’s or Standard & Poors. There were 12 out of 27 investments that had credit ratings in fiscal year 2015 and 8 out of the 18 investments that had credit ratings in fiscal year 2014. At September 30, 2015 and 2014, those investments and their related credit ratings were as follows:
Funds Credit Ratings
DCPLUS Fixed Income Portfolio AAA/BBB/A/AA Vanguard Target Retirement Income AAABBB/A/AA Vanguard Target Retirement 2010 AAA/A/BBB/AA Vanguard Target Retirement 2015 AAA/A/BBB/AA Vanguard Target Retirement 2020 AAA/A/BBB/AA Vanguard Target Retirement 2025 AAA/A/BBB/AA Vanguard Target Retirement 2030 AAA/A/BBB/AA Vanguard Target Retirement 2035 AAA/A/BBB/AA Vanguard Target Retirement 2040 AAA/A/BBB/AA Vanguard Target Retirement 2045 AAA/A/BBB/AA Vanguard Target Retirement 2050 AAA/A/BBB/AA Vanguard Target Retirement 2055 AAA/A/BBB/AA
Funds Credit Ratings
MetLife Stable Value Fund AAA/AA/A/BBB
Western Asset Core Bond Fund AAA/AA/A/BBB/Below BBB
SSgA Target Retirement Fund A1
SSgA Target Retirement 2010 Fund A1
SSgA Target Retirement 2020 Fund A1
SSgA Target Retirement 2030 Fund Aa2
SSgA Target Retirement 2040 Fund Aa1
SSgA Target Retirement 2050 Fund Aa1
2015
2014
401(A) DEFINED CONTRIBUTION PENSION PLAN NOTES TO FINANCIAL STATEMENTS
SEPTEMBER 30, 2015 AND 2014 NOTE 3 INVESTMENTS (Continued)
Foreign currency risk is the risk that changes in exchange rates will adversely affect the fair market value of an investment in a foreign financial institution. The Plan mitigates this risk by limiting its investment in any one country to no more than the greater of either 25% of the equity portion of the investment account or by the country’s weight in the Europe, Australia, Far East (EAFE) benchmark. In addition, a minimum of eight countries must be represented in each investment account. As a result, the Plan’s currency denomination varies.
At September 30, 2015 and 2014, the investments with the largest foreign currency risk are Harbor International Fund and the SSgA International Stock Selection Fund, respectively. Harbor International Fund major currency denomination is Euro and SSgA International is in British pound and Yen.
NOTE 4 FORFEITURE ACCOUNT
Participant account balances are transferred to a forfeitures account within the Plan when a participant separates from service prior to being invested and is not re-employed by the District within one year of the date of separation. The District uses the forfeited funds to reduce its contributions, to pay administrative expenses, and to adjust participant's earnings. At September 30, 2015 and 2014, the Plan's forfeiture account balance was $1,959,653 and $3,958,674 respectively. The District used $5,074,304 and $1,165,772 of forfeiture funds to pay for contributions during 2015 and 2014, respectively.
The transactions that occurred within the account during 2015 and 2014 were as follows:
2015 2014
401(A) DEFINED CONTRIBUTION PENSION PLAN NOTES TO FINANCIAL STATEMENTS
SEPTEMBER 30, 2015 AND 2014 NOTE 5 PLAN FEES
The Plan charges fees to participants' accounts for investment management services. The fees vary by investment fund and are calculated based on the fund's daily asset value. At September 30, 2015 and 2014, investment management fees totaled $4,085,669 and $4,018,951, respectively.
NOTE 6 DUE TO DISTRICT GOVERNMENT
According to the contract with the District, the Program Manager has a revenue sharing requirement whereby 12 basis points of the Plan's daily asset value are paid to the Plan Administrator through September 18, 2015 and 5.5 basis points afterwards. The revenue sharing amount is deposited by the Program Manager into an administrative account maintained in the Plan. Additions to and deductions from the administrative account are not Plan transactions reflected in the Statements of Changes in Fiduciary Net Position.
The total amount of revenue sharing earned by the Plan Administrator for fiscal years 2015 and 2014 was $760,680 and $887,841, respectively. At September 30, 2015, the amount Due from Program Manager was zero, as the Program Manager deposited all amounts due into the administrative account. At September 30, 2014, the Program Manager deposited into the administrative account all of the amounts due except $209,795. As of September 30, 2015 and 2014, the Plan's revenue sharing fund balance was $226,829 and $1,183,871, respectively, and is reported as Due to the District Government. Included in the revenue sharing fund balance is the amount due from the program manager of $0 and $209,795 for fiscal years 2015 and 2014, respectively.
NOTE 7 ADMINISTRATIVE EXPENSES
401(A) DEFINED CONTRIBUTION PENSION PLAN NOTES TO FINANCIAL STATEMENTS
SEPTEMBER 30, 2015 AND 2014 NOTE 7 ADMINISTRATIVE EXPENSES (Continued)
2015 2014
Participant Account Reimbursements $ 1,298,843 $ -Administrator Salaries 316,000 -Financial Statements Compilation 48,524 25,658 Investment Consulting Services 72,935 91,869
1,736,302
$ $ 117,527
The Plan also incurs and pays certain administrative expenses through the forfeiture account (see Note 4). These plan-paid administrative expenses are reflected in the Statements of Changes in Fiduciary Net Position. For fiscal years 2015 and 2014, there were no administrative expenses paid by the Plan from the forfeiture account.
NOTE 8 OTHER DEDUCTIONS
The Plan received contributions for some participants who were in the Plan in error. Contributions totaling $363,746 and $481,034 during fiscal years 2015 and 2014, respectively, were returned to the District to be transferred to the participants' correct pension plans.
NOTE 9 TERMINATED PARTICIPANTS
As of September 30, 2015 and 2014, the Plan had 5,746 and 6,546 terminated vested participants who had account balances in the Plan. The participants are no longer able to contribute to the Plan, but their account balances are adjusted for fees and investment earnings. The value of the account balances at year-end was approximately $99,519,768 and $106,410,282, respectively.
NOTE 10 PLAN TERMINATION
401(A) DEFINED CONTRIBUTION PENSION PLAN NOTES TO FINANCIAL STATEMENTS
SEPTEMBER 30, 2015 AND 2014 NOTE 11 RISKS AND UNCERTAINTIES
The Plan invests in investment securities that are exposed to various risks such as interest rate, market, and credit risks. Due to the level of risk associated with certain investment securities, it is at least reasonably possible, that changes in the values of the investment securities will occur in the near term and, that such changes could materially affect participant's account balances and the amounts reported in the statement of fiduciary net position.
NOTE 12 RESTATEMENT OF FINANCIAL STATEMENTS
During fiscal year 2015, management decided to reflect the District’s portion of the Plan’s contributions receivable at year end on the financial statements. For comparative purposes, the 2014 financial statements were also adjusted. Contribution receivables represent amounts which became due to the Plan based on payroll dates at the end of the year but were not paid into the Plan until after the year end. The inclusion of contributions receivable in the restated financial statements increased total assets, net position restricted for pension, total additions and change in net position as follows:
Previously
Reported Restated
2014 Adjustments 2014
ASSETS
Investments $ 692,461,141 $ - $ 692,461,141 Employer Contribution Receivables - 3,639,187 3,639,187 Due from Program Manager 209,795 - 209,795 Total Assets 692,670,936 3,639,187 696,310,123
LIABILITIES 1,183,871 - 1,183,871
Net Position Restricted for Pensions $ 691,487,065 $ 3,639,187 $ 695,126,252
ADDITIONS
District Government Contributions $ 50,179,759 $ 197,945 $ 50,377,704 Investment Income 56,559,098 - 56,559,098
106,738,857
197,945 106,936,802 DEDUCTIONS 28,623,943 - 28,623,943 Net Increase 78,114,914 197,945 78,312,859 Net Position Restricted for Pensions,
Beginning of Year 613,372,151 3,441,242 616,813,393 Net Position Restricted for Pensions,
401(A) DEFINED CONTRIBUTION PENSION PLAN NOTES TO FINANCIAL STATEMENTS
SEPTEMBER 30, 2015 AND 2014 NOTE 13 SUBSEQUENT EVENTS
Government of the District of Columbia
457(b) Deferred Compensation Plan
Financial Statements and
Independent Auditor’s Report
457(b) DEFERRED COMPENSATION PLAN FINANCIAL STATEMENTS AND
INDEPENDENT AUDITOR’S REPORT YEARS ENDED SEPTEMBER 30, 2015 AND 2014
TABLE OF CONTENTS
PAGE
Independent Auditor’s Report ...1
Management’s Discussion and Analysis (Required Supplementary Information - Unaudited) ...3
Basic Financial Statements:
Statements of Fiduciary Net Position ...10
Statements of Changes in Fiduciary Net Position...11
Washington, DC 20037 www.bcawatsonrice.com
INDEPENDENT AUDITOR’S REPORT
Office of Finance and Treasury Office of the Chief Financial Officer Government of the District of Columbia
Report on the Financial Statements
We have audited the accompanying statements of fiduciary net position of the Government of the District of Columbia’s 457(b) Deferred Compensation Plan (the “Plan”) as of September 30, 2015 and 2014, and the related statements of changes in fiduciary net position for the years then ended and the related notes to the financial statements.
Management’s Responsibility for the Financial Statements
Management is responsible for the preparation and fair presentation of these financial statements in accordance with accounting principles generally accepted in the United States of America; this includes the design, implementation, and maintenance of internal control relevant to the preparation and fair presentation of financial statements that are free from material misstatement, whether due to fraud or error.
Auditor’s Responsibility
Our responsibility is to express an opinion on the financial statements based on our audit. We conducted our audit in accordance with auditing standards generally accepted in the United States of America. Those standards require that we plan and perform the audit to obtain reasonable assurance about whether the financial statements are free from material misstatement.
An audit involves performing procedures to obtain audit evidence about the amounts and disclosures in the financial statements. The procedures selected depend on the auditor’s judgment, including the assessment of the risks of material misstatement of the financial statements, whether due to fraud or error. In making those risk assessments, the auditor considers internal control relevant to the Plan’s preparation and fair presentation of the financial statements in order to design audit procedures that are appropriate in the circumstances, but not for the purpose of expressing an opinion on the effectiveness of the Plan’s internal control. Accordingly, we express no such opinion. An audit also includes evaluating the appropriateness of accounting policies used and the reasonableness of significant accounting estimates made by management, as well as evaluating the overall presentation of the financial statements.
We believe that the audit evidence we have obtained is sufficient and appropriate to provide a basis for our audit opinion.
Opinions
In our opinion, the financial statements referred to above present fairly, in all material respects, the respective financial position of the Plan, as of September 30, 2015 and 2014, and the respective changes in financial position for the year then ended in accordance with accounting principles generally accepted in the United States of America.
Other Matters
Accounting principles generally accepted in the United States of America require that the management’s discussion and analysis on pages 3 through 9 be presented to supplement the basic financial statements. Such information, although not a part of the basic financial statements, is required by the Governmental Accounting Standards Board who considers it to be an essential part of financial reporting for placing the basic financial statements in an appropriate operational, economic, or historical context. We have applied certain limited procedures to the required supplementary information in accordance with auditing standards generally accepted in the United States of America, which consisted of inquiries of management about the methods of preparing the information and comparing the information for consistency with management’s responses to our inquiries, the basic financial statements, and other knowledge we obtained during our audit of the basic financial statements. We do not express an opinion or provide any assurance on the information because the limited procedures do not provide us with sufficient evidence to express an opinion or provide any assurance
457(b) DEFERRED COMPENSATION PLAN MANAGEMENT’S DISCUSSION AND ANALYSIS
YEARS ENDED SEPTEMBER 30, 2015 AND 2014
The following presents our discussion and analysis of the financial performance of the Government of the District of Columbia’s 457(b) Deferred Compensation Plan (the Plan) for the fiscal years ended September 30, 2015 and 2014. This discussion and analysis should be read in conjunction with the financial statements and note disclosures.
Under the District’s Deferred Compensation Act of 1984, D.C. Law 5-118, and D.C. Code Section 47-3601, the Government of the District of Columbia (the “District”) offers for eligible employees a qualified employee deferred compensation plan. The Plan enables eligible employees to make tax deferred contributions towards their retirement. The duties of the Plan’s Administrator are performed jointly by the District’s Office of the Chief Financial Officer, Office of Finance and Treasury and the D.C. Department of Human Resources.
Overview of Financial Statements
The Plan financial statements consist of two basic financial statements: (a) Statement of Fiduciary Net Position and (b) Statement of Changes in Fiduciary Net Position. In addition to the basic financial statements are the notes to the financial statements.
Statement of Fiduciary Net Position presents the Plan’s assets and deferred outflow of resources, liabilities and deferred inflow of resources, and net position restricted for participant benefits.
Statement of Changes in Fiduciary Net Position presents the additions to and deductions from the Plan’s net position.
The notes to the financial statements provide a detailed discussion of key accounting policies and activities that occurred during the year. The notes provide additional information that is essential to a full understanding of the information provided in the financial statements.
2015 Financial Highlights
Investments increased by $2,081,748 or 0.37%.
Receivables increased by $1,308,473 or 6.96%.
Net investment loss was $7,192,662, a decrease of $52,299,004 or 115.95%
Benefits paid to participants increased by $9,451,302 or 26.36%.
2014 Financial Highlights
Investments increased by $54,064,629 or 10.49%.
Receivables increased by $2,292,800 or 13.90%.
Net investment income was $45,106,342, a decrease of $9,339,906 or 17.15%.
457(b) DEFERRED COMPENSATION PLAN MANAGEMENT’S DISCUSSION AND ANALYSIS
YEARS ENDED SEPTEMBER 30, 2015 AND 2014
Financial Analysis – Fiduciary Net Position
Table 1 – Condensed Statements of Fiduciary Net Position as of September 30, 2015, 2014 and 2013
2014 2013 2015-2014 2014-2013 2015 (Restated) (Restated) Variance % Variance Variance % Variance
ASSETS
Investments $ 571,491,192 $ 569,409,444 $ 515,344,815 $ 2,081,748 0.37% $ 54,064,629 10.49% Receivables 20,101,629 18,793,156 16,500,356 1,308,473 6.96% 2,292,800 13.90% Total Assets 591,592,821 588,202,600 531,845,171 3,390,221 0.58% 56,357,429 10.60%
LIABILITIES
Due to District Government 375,822 243,824 129,600 131,998 54.14% 114,224 88.14% Total Liabilities 375,822 243,824 129,600 131,998 54.14% 114,224 88.14%
Net Position Restriced for Pensions $ 591,216,999 $ 587,958,776 $ 531,715,571 $3,258,223 0.55% $ 56,243,205 10.58%
Fiscal Year 2015
The Plan’s investments increased by $2,081,748 or 0.37%, over the prior fiscal year. The increase is primarily due to the excess of contributions over benefit payments. For fiscal year 2015, there was a net depreciation in the fair value of investments due to less favorable market conditions as most investment funds had negative rates of return. Effective September 18, 2015, the Plan Administrator changed the Program Manager from Voya Retirement Services (“Voya”) to ICMA Retirement Corporation (“ICMA-RC”). Therefore, all investments at Voya were liquidated and new funds and portfolios were established and made available to Plan participants.
As shown in Table 2a - Investment by Fund with Percentage Asset Allocations as of September 30, 2015 (which shows the new funds and portfolios effective September 18, 2015), a significant portion of the Plan’s investments were in VantageTrust PLUS Fund (40.5%), DCPLUS Large Cap Value Portfolio (12.6%) and the Ariel Fund (10.5%). The VantageTrust PLUS Fund invest primarily in a diversified portfolio of stable value insurance contracts and fixed income securities that back certain stable value investment contracts, and seeks to provide preservation of principal and maximize current yield. The DCPLUS Large Cap Value Portfolio invests primarily in common and large capitalization stocks, and seeks growth in capital. The Ariel Fund invests primarily in equity securities of U.S. companies in the financial services and consumer discretionary sectors, and seeks to provide long-term capital appreciation. Because the Plan commenced investing in the new funds on September 18, 2015, actual Plan performance for the twelve days was not available.
457(b) DEFERRED COMPENSATION PLAN MANAGEMENT’S DISCUSSION AND ANALYSIS
YEARS ENDED SEPTEMBER 30, 2015 AND 2014
collective investment trust that seeks to provide preservation of principal and maximize current yield while closely tracking intermediate term interest rates. The DCPLUS Large Cap Value Portfolio invests primarily in common and large capitalization stocks and seeks growth in capital. At August 31, 2015, the DCPLUS Stable Value Portfolio and DCPLUS Large Cap Value Portfolios had a rate of return of 2.76% and -7.12%, respectively.
Receivables comprised of note receivable from participants and contributions receivable. For the fiscal year 2015, receivables increased by $1.31 million or 6.96% due to an increase in participant loans at the end of the year.
The amount “Due to District Government” represents funds owed to the District as Plan Administrator which is used towards paying the Plan’s administrative expenses. The Program Manager provides revenue sharing funds to the Plan Administrator on a monthly basis. The funding is equal to 5 basis points (0.05%) of the Plan’s daily asset value through September 18, 2015 and 5.5 basis points (0.055%) afterwards.
Table 2a - Investment by Fund with Percentage Asset Allocation as of September 30, 2015 Investment Percent
Value of Total Assets
American Funds New Perspective Fund $ 97,369 -American Funds Fundaments Investors 11,328,828 2.0 Ariel Funds 60,367,946 10.5 BlackRock Liquidity Federal Trust Fund 2,413,197 0.4 Brown Capital Management Small 11,840,962 2.1 DC Plus Fixed Income Fund 18,988,581 3.3 DC Plus Large Cap Growth 19,008,865 3.3 DC Plus Large Cap Value 72,095,837 12.6 DFA US Core Equity Portfolio 2,774 -Harbor International Fund 19,259,086 3.4 Nuveen Real Estate Securities Fund 6,111,422 1.1 PIMCO Real Return Collective Trust II 45,154 -PIMCO All Asset Fund I 2,390 -Vanguard Institutional Index Fund 54,200,014 9.5 Vanguard Small Cap Index Fund 7,883,108 1.4 Vanguard Target Retirement Inc. 1,226,972 0.2 Vanguard Target Retirement 2010 Fund 4,946,409 0.9 Vanguard Target Retirement 2015 Fund 6,662,656 1.2 Vanguard Target Retirement 2020 Fund 7,179,092 1.2 Vanguard Target Retirement 2025 Fund 9,572,910 1.7 Vanguard Target Retirement 2030 Fund 7,579,145 1.3 Vanguard Target Retirement 2035 Fund 7,817,684 1.4 Vanguard Target Retirement 2040 Fund 4,947,816 0.9 Vanguard Target Retirement 2045 Fund 4,104,912 0.7 Vanguard Target Retirement 2050 Fund 1,571,249 0.3 Vanguard Target Retirement 2055 Fund 162,871 -VantageTrust PLUS Fund 231,665,888 40.5 Vantage Self Directed Brokerage Account 401,888 0.1 Virtus Emerging Markets Fund Class 1 6,167
-571,491,192
457(b) DEFERRED COMPENSATION PLAN MANAGEMENT’S DISCUSSION AND ANALYSIS
YEARS ENDED SEPTEMBER 30, 2015 AND 2014
Table 2b - Investment by Fund with Rates of Returns as of August 31, 2015
Investment Percent Rate of Value of Total Assets Return %
DCPLUS Stable Value Portfolio $ 231,094,594 39.6 2.76
BlackRock Liquidity Federal Trust Fund 2,224,418 0.4 0.01
DCPLUS Fixed Income Portfolio 8,205,815 1.4 1.08
PIMCO Total Return Fund 6,354,823 1.1 0.88
ING GNMA Income Fund 4,038,812 0.7 2.96
Vanguard Target Retirement Income Fund 1,962,687 0.3 -0.76
Vanguard Target Retirement 2015 Fund 2,597,008 0.4 -1.38
Vanguard Target Retirement 2025 Fund 8,440,967 1.4 -2.08
Vanguard Target Retirement 2035 Fund 8,447,007 1.5 -2.99
Vanguard Target Retirement 2045 Fund 4,788,426 0.8 -3.53
Pax World Balanced Fund 19,481,479 3.3 -1.30
ING T. Rowe Price Capital Appreciation Portfolio 11,432,358 2.0 6.20
DCPLUS Large Cap Value Portfolio 75,066,817 12.9 -7.12
Vanguard Institutional Index Fund 56,234,137 9.6 0.47
ING Growth & Income Portfolio 11,502,236 1.9 -3.75
DCPLUS Large Cap Growth Portfolio 19,703,843 3.4 0.45
Fidelity VIP Mid Cap Portfolio 25,017,650 4.3 -0.35
Ariel Fund 40,442,088 6.9 -1.35
Vanguard Small-Cap Index Fund 8,233,281 1.4 -1.00
The Brown Capital Management Small Company Fund 12,051,142 2.1 7.27
American Funds EuroPacific Growth Fund 20,515,289 3.5 -4.40
ING Clarion Real Estate Portfolio 6,455,933 1.1 -0.22
584,290,810
$ 100.0
Fiscal Year 2014
The Plan’s investments increased from 2013 by $54,064,629 or 10.49%. The increase is attributed to the investments performance in the overall market. All investment funds had positive rates of return.
457(b) DEFERRED COMPENSATION PLAN MANAGEMENT’S DISCUSSION AND ANALYSIS
YEARS ENDED SEPTEMBER 30, 2015 AND 2014
Receivables comprised of note receivable from participants and contributions receivable. For the fiscal year 2014, receivables increased by $2.29 million or 13.90% due to an increase in participant contributions and loans receivable at the end of the year.
The amount “Due to District Government” represents funds owed to the District as Plan Administrator which is used towards paying the Plan’s administrative expenses. The Program Manager provides revenue sharing funds to the Plan Administrator on a monthly basis. The funding is equal to 5 basis points (0.05%) of the Plan’s daily asset value.
Table 2c - Investment by Fund with Rates of Returns as of September 30, 2014
Investment Percent Rate of Value of Total Assets Return %
DCPLUS Fixed Income Portfolio $ 7,901,736 1.4 4.11 DCPLUS Stable Value Portfolio 225,744,976 39.6 2.50 Vanguard Target Retirement Income Fund 1,973,571 0.4 6.25 PIMCO Total Return Fund 6,782,175 1.2 3.09 BlackRock Liquidity Federal Trust Fund 1,807,370 0.3 0.01 Vanguard Target Retirement 2015 Fund 2,791,326 0.5 8.86 Vanguard Target Retirement 2025 Fund 7,617,917 1.3 10.58 Vanguard Target Retirement 2035 Fund 7,484,346 1.3 11.97 Vanguard Target Retirement 2045 Fund 3,651,959 0.6 12.51 Ariel Fund 39,787,179 7.0 21.51 Fidelity VIP Mid Cap Portfolio 23,093,028 4.1 12.23 DCPLUS Large Cap Value Portfolio 84,022,685 14.8 14.50 DCPLUS Large Cap Growth Portfolio 17,780,142 3.1 17.54 Vanguard Institutional Index fund 52,856,243 9.3 19.69 Pax World Balanced Fund 19,696,713 3.5 10.80 Voya Growth & Income Portfolio 10,990,866 1.9 17.81 Vanguard Small-Cap Index Fund 7,563,014 1.3 9.54 Voya GNMA Income Fund 3,988,291 0.7 3.53 The Brown Capital Management Small Company Fund 9,529,433 1.7 1.22 Voya T. Rowe Price Capital Appreciation Portfolio 9,326,897 1.6 14.10 Voya Clarion Real Estate Portfolio 5,807,300 1.0 14.45 American Funds EuroPacific Growth Fund 19,212,277 3.4 6.93
569,409,444
457(b) DEFERRED COMPENSATION PLAN MANAGEMENT’S DISCUSSION AND ANALYSIS
YEARS ENDED SEPTEMBER 30, 2015 AND 2014
Financial Analysis – Changes in Fiduciary Net Position
Table 3 – Condensed Statements of Changes in Fiduciary Net Position for the Years Ended September 30, 2015, 2014 and 2013
` 2014 2013 2015-2014 2014-2013
2015 (Restated) (Restated) Variance % Variance Variance % Variance ADDITIONS
Employee Contributions $ 55,664,492 $ 46,927,406 $ 43,361,614 $ 8,737,086 18.62% $ 3,565,792 8.22% Net Investment (Loss) Income (7,192,662) 45,106,342 54,446,248 (52,299,004) -115.95% (9,339,906) -17.15% Interest Income on Notes Receivable 486,199 460,310 362,780 25,889 5.62% 97,530 26.88% Total additons 48,958,029 92,494,058 98,170,642 (43,536,029) -47.07% (5,676,584) -5.78%
DEDUCTIONS
Benefits Paid to Participants 45,307,443 35,856,141 34,708,308 9,451,302 26.36% 1,147,833 3.31% Administrative Expenses 277,933 279,513 240,191 (1,580) -0.57% 39,322 16.37% Loan Fees 114,430 115,199 122,689 (769) -0.67% (7,490) -6.10% Total deductions 45,699,806 36,250,853 35,071,188 9,448,953 26.07% 1,179,665 3.36%
Net Increase 3,258,223 56,243,205 63,099,454 (52,984,982) -94.21% (6,856,249) -10.87%
Net Position Restricted for Pensions,
Beginning of Year 587,958,776 531,715,571 468,616,117 56,243,205 10.58% 63,099,454 13.47% Net Position Restricted for Pensions, End of
Year $ 591,216,999 $ 587,958,776 $ 531,715,571 $ 3,258,223 0.55% $ 56,243,205 10.58%
Fiscal Year 2015
Employee contributions increased by $8,737,086 or 18.62%. There was an overall increase in the average number of Plan participants making contributions to the Plan. The number of Plan participants increased from 9,897 in 2014 to 10,706 in 2015. In addition, the average monthly contributions increased from $402.61 in 2014 to $429.53 in 2015.
The Plan’s net investment loss was $7,192,661 in 2015 compared to net investment income of $45,106,342 in fiscal year 2014. The decrease in net investment income was primarily due to significantly less favorable market conditions in fiscal year 2015 compared with 2014. Thirteen (13) of the twenty-two (22) funds of the Plan reflected negative rates of return ranging from -0.22% to -7.12%. The other nine (9) funds reflected positive rates of return ranging from 0.01% to 7.27%. The Plan’s investments collectively had an overall weighted average rate of return in 2015 of 0.05% compared to 9.54% in 2014.
Benefits paid to participants increased by $9,451,302 or 26.36%. The increase was due to more participants requesting payouts in 2015 compared to 2014.