Development and validation of the Dutch
Stroke Score for predicting disability and
functional outcome after ischemic
stroke: A tool to support efficient
discharge planning
Inger R de Ridder
1, Simone A Dijkland
2, Maaike Scheele
1,
Heleen M den Hertog
3, Maaike Dirks
1,4,
Willeke F Westendorp
5, Paul J Nederkoorn
5,
Diederik van de Beek
5, Gerard M Ribbers
6,
Ewout W Steyerberg
2,7, Hester F Lingsma
2and
Diederik WJ Dippel
1Abstract
Introduction:We aimed to develop and validate a prognostic score for disability at discharge and functional outcome at three months in patients with acute ischemic stroke based on clinical information available on admission.
Patients and methods:The Dutch Stroke Score (DSS) was developed in 1227 patients with ischemic stroke included in the Paracetamol (Acetaminophen) In Stroke study. Predictors for Barthel Index (BI) at discharge (‘DSS-discharge’) and modified Rankin Scale (mRS) at three months (‘DSS-3 months’) were identified in multivariable ordinal regression. The models were internally validated with bootstrapping techniques. The DSS-3 months was externally validated in the PRomoting ACute Thrombolysis in Ischemic StrokE study (1589 patients) and the Preventive Antibiotics in Stroke Study (2107 patients). Model performance was assessed in terms of discrimination, expressed by the area under the receiver operating characteristic curve (AUC), and calibration.
Results:At model development, the strongest predictors of Barthel Index at discharge were age per decade over 60 (odds ratio¼1.55, 95% confidence interval (CI) 1.41–1.68), National Institutes of Health Stroke Scale (odds ratio¼1.24 per point, 95% CI 1.22–1.26) and diabetes (odds ratio¼1.62, 95% CI 1.32–1.91). The internally validated AUC was 0.76 (95% CI 0.75–0.79). The DSS-3 months, additionally consisting of previous stroke and atrial fibrillation, performed similarly at internal (AUC 0.75, 95% CI 0.74–0.77) and external validation (AUC 0.74 in PRomoting ACute Thrombolysis in Ischemic StrokE (95% CI 0.72–0.76) and 0.69 in Preventive Antibiotics in Stroke Study (95% CI 0.69–0.72)). Observed outcome was slightly better than predicted.
Discussion:The DSS had satisfactory performance in predicting BI at discharge and mRS at three months in ischemic stroke patients.
Conclusion:If further validated, the DSS may contribute to efficient stroke unit discharge planning alongside patients’ contextual factors and therapeutic needs.
1
Department of Neurology, Erasmus MC-University Medical Center Rotterdam, Rotterdam, Netherlands
2
Department of Public Health, Center for Medical Decision Making, Erasmus MC-University Medical Center Rotterdam, Rotterdam, Netherlands
3
Department of Neurology, Medical Spectrum Twente, Enschede, Netherlands
4
Department of Neurology, University Medical Center Utrecht, Utrecht, Netherlands
5
Department of Neurology, Academic Medical Center, University of Amsterdam, Amsterdam Neuroscience, Amsterdam, Netherlands 6
Department of Rehabilitation Medicine, Erasmus MC-University Medical Center Rotterdam, Rotterdam, Netherlands
7
Department of Medical Statistics and Bioinformatics, Leiden University Medical Center, Leiden, Netherlands
The first two authors contributed equally to this manuscript.
Corresponding author:
Simone A Dijkland, Department of Public Health, Erasmus MC-University Medical Center, Room Na2424, PO Box 2040, Rotterdam 3000 CA, Netherlands.
Email: [email protected]
European Stroke Journal 2018, Vol. 3(2) 165–173
!European Stroke Organisation 2018
Reprints and permissions:
Keywords
Stroke, clinical prediction model, prognosis, hospital discharge, rehabilitation, discharge planning
Date received: 28 September 2017; accepted: 23 December 2017
Introduction
In 2015, over 26,000 patients were admitted to hospi-tals because of ischemic stroke in the Netherlands.1 Most of these patients need rehabilitation to achieve better recovery in the first months after stroke and reduce long-term disability. In the Netherlands, around 8% of all stroke patients is referred to an inpa-tient rehabilitation centre.2Typically, these patients are too disabled to be discharged home, but they are cog-nitively and physically fit enough to participate in intensive therapy sessions and have sufficient social support to return home within two to four months. Alternatively, patients may be referred to skilled nurs-ing and geriatric rehabilitation facilities. These patients are often elderly, suffer from comorbidities and have a poorer functional prognosis. Still, the majority of stroke patients (60%) is discharged home, mostly with community rehabilitation.2 Discharge planning may depend on multiple factors such as comorbidities and contextual factors (e.g. the presence of a healthy caregiver and premorbid level of functioning). The importance of the contextual factors increases as the functional prognosis of the stroke decreases. Therefore, early prediction of functional outcome may contribute to efficient discharge planning.
The most widely used functional outcome measure in acute stroke is the modified Rankin Scale (mRS). The mRS measures the degree of disability in daily activities. It is scored on an ordinal scale ranging from 0 (no symptoms) to 6 (death).3Another frequent-ly used outcome measure in rehabilitation is the Barthel Index (BI), measuring performance in 10 basic activi-ties of daily living (ADL).4BI is associated with dura-tion of hospital stay.5
Previous studies identified many prognostic factors for outcome (measured by BI or mRS) after acute stroke.6 Prognostic factors can be combined in a model to identify patients at risk for poor outcome.7 Although several prognostic models exist to predict outcome in stroke, very few are adequately validated for use in daily clinical practice.8We aimed to develop and validate a prognostic score for disability (BI) at discharge and functional outcome (mRS) at three months after acute ischemic stroke based on clinical information available on admission.
Methods
Derivation cohort
Data from the Paracetamol (Acetaminophen) In Stroke (PAIS) study were used for model development.9PAIS was a multicentre, randomised placebo-controlled phase III trial assessing the effect of high dose paracet-amol on the functional outcome in patients with acute stroke. In short, patients were eligible for inclusion if they were diagnosed with acute ischemic stroke or intracerebral hemorrhage, had a prestroke mRS<2 and study treatment could be started within 12 h after onset of symptoms. We used data of all patients with ischemic stroke included in PAIS.
Outcome measures
We used the BI at discharge as the outcome measure for short-term disability. The BI is an ordinal scale used to measure performance in ADL. The scale ranges from 0 to 20, with higher scores indicating a greater likelihood of being able to carry out ADL inde-pendently.4 In PAIS, the BI was measured at 14 days after enrolment or at hospital discharge if this occurred earlier (70% of the patients stayed for 3 days).9 However, choice of the optimal rehabilitation route mostly depends on more than just discharge outcome.10 Therefore, we additionally evaluated functional out-come at three months with the mRS. The mRS is an ordinal scale used to measure the degree of disability in daily activities and ranges from 0 (no symptoms) to 6, with mRS 5 indicating severe disability and mRS 6 indicating death.3
Model development
associations were presented as a set of odds ratios (ORs) and 95% confidence intervals (CIs) to indicate the individual predictor effects. ORs from an ordinal logistic regression model can be interpreted as a common OR for shifting over the full outcome range.11 The resulting models, the Dutch Stroke Score (DSS) for BI at discharge (‘DSS-discharge’) and mRS at three months (‘DSS-3 months’), were internally validated using standard bootstrapping procedures to avoid an optimistic estimate of the model performance, which often occurs when model performance is only evaluated directly in the derivation cohort (apparent validation). In the bootstrap procedure, random samples are drawn from the original sample, each with the same number of patients as the original sample. In each of these samples the modeling steps are repeated and the result-ing models are subsequently evaluated on the original sample. The mean model performance in all 500 boot-strap models represents the expected performance of the models in future, similar patients.12
Validation cohorts
For external validation, we used data from the PRomoting ACute Thrombolysis in Ischemic StrokE (PRACTISE) study and Preventive Antibiotics in Stroke Study (PASS). PRACTISE was a cluster-randomised trial designed to evaluate an implementa-tion strategy to increase the proporimplementa-tion of patients treated with intravenous thrombolysis.13 PRACTISE registered adult patients with acute stroke admitted within 24 h after onset of symptoms and had no age restrictions. We used data from ischemic stroke patients admitted within 4 h as in these patients detailed clinical data were available.
PASS was a multicentre, randomised, open-label trial designed to assess whether or not preventive anti-microbial therapy with ceftriaxone improves functional outcome in patients with acute stroke.14PASS included adult patients with clinical symptoms of a stroke (ische-mic or hemorrhagic) admitted within 24 h after symp-tom onset. We used data of all patients with ischemic stroke included in PASS.
Model validation
The validity of the DSS-3 months was assessed in terms of discrimination and calibration. The external valida-tion cohorts did not have data on BI at discharge. Discrimination refers to how well the model distin-guishes between those who have good outcome (mRS 0–2) vs. those who have poor outcome (mRS 3–6) at three months. Discrimination was assessed by calculat-ing the ordinal area under the curve (AUC) of the receiver operating characteristic (ROC) curve.15
The AUC ranges from 0.5 for non-informative models to 1.0 for perfect models.12 Calibration indi-cates the agreement between predicted and observed probabilities. Calibration was assessed graphically in a calibration graph, and expressed as the calibration slope and an intercept. The calibration slope is ideally equal to 1 and describes the effect of the predictors in the validation cohort versus in the derivation cohort. The intercept indicates whether predictions are system-atically too high or too low, and should ideally be zero.12
At external validation, the discriminative power of a model may be influenced by differences in predictor effects, but also by differences in distribution of patient characteristics (case-mix) between the derivation and validation cohort.16 In a more homogeneous popula-tion, discrimination between patients with good vs. poor outcome is more difficult than in a heterogeneous population. To take this into account, we calculated the case-mix-corrected AUC. The case-mix-corrected AUC reflects the discriminative power of a model, assuming that the regression coefficients are correct for the validation population. It was calculated by sim-ulating new outcome values for all patients in the val-idation dataset, based on the predicted risks for each patient.16
After external validation, we fitted the DSS-3 months on the combined data of all three trials to get the best estimates for the regression coefficients.17The DSS-discharge and DSS-3 months were presented in a score chart, as a score plot simplified to five BI and mRS outcome classes (based on clinically relevant cut-offs), and as formulas to calculate the predicted outcomes.
All statistical analyses were performed using R soft-ware, version 3.3.2 (R foundation for statistical com-puting, Vienna, Austria). The calibration plots were created with an updated version of the val.prob func-tion (rms library in R). Missing values in the develop-ment and validation cohorts were statistically imputed using a multiple imputation method exploiting correla-tions between predictor variables and between predic-tor variables and the outcome variables (micefunction in R). Complete case analyses were done for compari-son with the imputed analyses.
Results
Study population
predicting mRS at three months, we included, 1657 ischemic stroke patients from the PRACTISE study. Sixty-eight patients with missing data on mRS at three months were excluded, resulting in an external validation sample of 1589 patients. Other missing data (0.6%) were statistically imputed. Additionally, we externally validated the model for functional out-come at three months in, 2125 ischemic stroke patients from the PASS study. Eighteen patients with missing data on the mRS at three months were excluded, result-ing in an external validation sample of 2107 patients. Other missing data (0.4%) were statistically imputed.
In all three studies, most patients (55–58%) were male and the mean age was around 70 years (Table 1). The three populations are comparable con-cerning baseline characteristics, except for time from
stroke onset to inclusion (PAIS and PRACTISE had a smaller time window compared to PASS), previous stroke (33% in PASS vs. 20% in the other trials) and diabetes (20% in PASS vs. 15–17% in PAIS and PRACTISE). The number of patients with poor out-come (mRS 3–6) was lower in PASS compared to PAIS and PRACTISE (online supplemental Figure 1(a)). In PAIS, this is reflected in the substantial proportion of patients with favorable outcome on the BI at discharge (online supplemental Figure 1(b)).
Model development in PAIS
The relation between age as a continuous variable and the log odds of disability (BI) in the development data was non-linear and intensified when age was above 60
Figure 1. Calibration plots of the DSS-3 months in (a) PRACTISE and (b) PASS.
DSS: Dutch Stroke Score; PRACTISE: PRomoting ACute Thrombolysis in Ischemic StrokE; PASS: Preventive Antibiotics in Stroke Study.
Table 1. Baseline characteristics of the included patients from the PAIS, PRACTISE and PASS studies.
PAIS (n¼1227) PRACTISE (n¼1589) PASS (n¼2107)
Male sex 675 (55%) 872 (55%) 1212 (58%)
Age in years (mean, sd) 70.1 (13.4) 70.6 (13.4) 71.9 (12.5)
Time from onset to CT in hours (median, IQR) 3.0 (1.8–5.9) 2.0 (1.4–3.0) NA
NIHSS (median, IQR) 6.0 (3.0–11.0) 5.0 (3.0–12.0) 5.0 (3.0–9.0)
Diabetes mellitus 181 (15%) 266 (17%) 423 (20%)
Previous ischemic stroke 245 (20%) 318 (20%) 698 (33%)
Atrial fibrillation 190 (16%) 290 (18%) 326 (16%)
Hypertension 601 (49%)a 811 (51%) 1154 (55%)
Current smoking 380 (31%) 374 (24%) 524 (25%)
NIHSS: National Institutes of Health Stroke Scale; IQR: interquartile range; NA: not available; PRACTISE: PRomoting ACute Thrombolysis in Ischemic StrokE; PASS: Preventive Antibiotics in Stroke Study; PAIS: Paracetamol (Acetaminophen) In Stroke.
years (online supplemental Figure 2). Because of this non-linearity, we considered different age effects for patients older vs. younger than 60 years.
Of the variables considered, age per decade above 60, NIHSS per point and diabetes were the strongest predictors of BI at discharge, both in univariable (data not shown) and multivariable analysis (Table 2) and were included in the model for disability at discharge. The internally validated ordinal AUC was 0.76 (95%CI 0.75–0.79). Age per decade above 60, NIHSS per point,
diabetes, previous stroke and atrial fibrillation were the strongest predictors of mRS at three months, both in univariable (data not shown) and multivariable analy-sis (Table 2) and were included in the final model for mRS at three months. The internally validated ordinal AUC was 0.75 (95%CI 0.74–0.77).
External validation in PRACTISE and PASS
In PRACTISE, the DSS-3 months had an ordinal AUC of 0.74 and an AUC for the cutoff mRS3 of
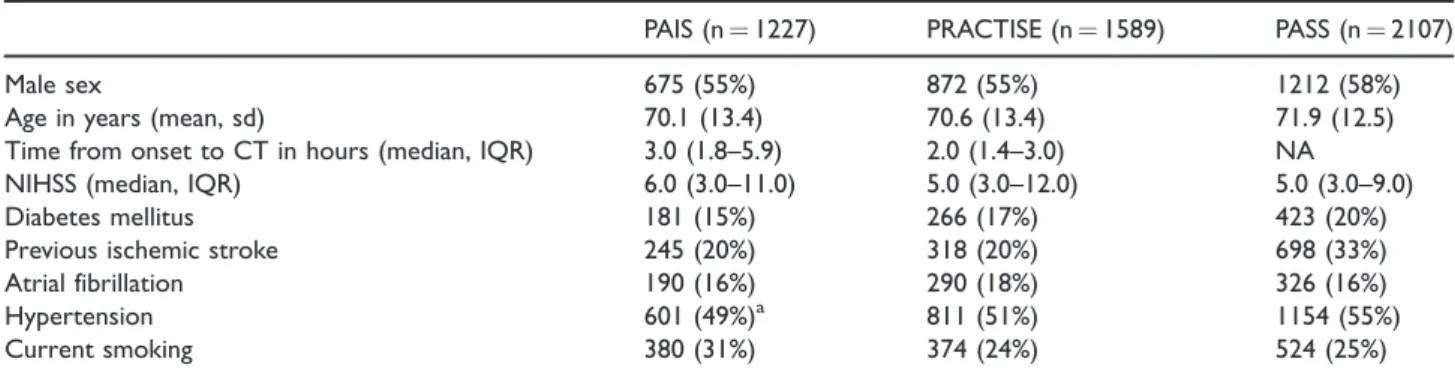
Figure 2. DSS score charts simplified to five outcome classes of the (a) BI at discharge and (b) mRS at three months. Legend of (a): Dark red¼0, Red¼1–9, Orange¼10–14, Yellow¼15–18, Green¼19–20 and legend of (b): Dark red¼6, Red¼4–5, Orange¼3, Yellow¼2, Green¼0–1.
DSS: Dutch Stroke Score; BI: Barthel Index; mRS: modified Rankin Scale.
Table 2. Associations of predictors in multivariable ordinal regression with lower BI at discharge in PAIS and higher mRS at three months in in PAIS, PRACTISE and PASS.
PAIS (n¼1227) BI at discharge
PAIS (n¼1227) mRS at three months
PRACTISE (n¼1589) mRS at three months
PASS (n¼2107) mRS at three months
Variable OR (95%CI) Pvalue OR (95%CI) Pvalue OR (95%CI) P value OR (95%CI) P value
Male sex 1.01 (0.79–1.23) 0.923 0.87 (0.71–1.07) 0.189 0.81 (0.67–0.97) 0.022 0.77 (0.61–0.93) 0.002 Age per decade
if over 60a,b
1.55 (1.41–1.68) <0.001 1.86 (1.64–2.12) <0.001 1.80 (1.61–2.01) <0.001 1.55 (1.41–1.70) <0.001
Age per decade if under 60
1.07 (0.83–1.30) 0.589 0.93 (0.76–1.15) 0.514 0.89 (0.74–1.07) 0.211 0.70 (0.56–0.86) <0.001
NIHSS per pointa,b 1.24 (1.22–1.26) <0.001 1.19 (1.17–1.22) <0.001 1.19 (1.17–1.21) <0.001 1.21 (1.19–1.23) <0.001 Diabetesa 1.62 (1.32–1.91) 0.002 1.87 (1.40–2.51) <0.001 1.70 (1.34–2.17) <0.001 1.31 (1.11–1.51) 0.007 Previous strokeb 1.18 (0.91–1.45) 0.225 1.67 (1.29–2.16) <0.001 1.59 (1.27–1.99) <0.001 1.14 (0.98–1.31) 0.111 Atrial fibrillationb 1.09 (0.78–1.39) 0.592 1.41 (1.05–1.89) 0.022 1.24 (0.98–1.57) 0.076 1.14 (0.91–1.36) 0.264 Hypertension 1.06 (0.84–1.28) 0.594 1.02 (0.83–1.26) 0.844 1.08 (0.90–1.30) 0.384 0.91 (0.75–1.07) 0.246
BI: Barthel Index; mRS: modified Rankin Scale; OR: odds ratio; CI: confidence interval; NIHSS: National Institutes of Health Stroke Scale; PRACTISE: PRomoting ACute Thrombolysis in Ischemic StrokE; PASS: Preventive Antibiotics in Stroke Study; PAIS: Paracetamol (Acetaminophen) In Stroke. aParameter included in final model on BI at discharge.
0.81 (95%CI 0.81–0.84) (online Supplemental Table 1). The model predicted 49.4% poor outcome (mRS3); whereas the observed probability of poor functional outcome was 45.2%. The calibration slope was 1.022 and the intercept was 0.238, indicating that the model’s predictions of poor outcome were systemati-cally higher than the observed probability of poor out-come (Figure 1(a)).
In PASS, the DSS-3 months had an ordinal AUC of 0.69 and an AUC for the cutoff mRS3 of 0.81 (95% CI 0.81–0.83) (online Supplemental Table 1). The predicted probability of poor outcome was 48.6%, compared to an observed probability of poor functional outcome of 38.5%. The calibration slope was 1.058 and the intercept was 0.555, indicating that the model’s predictions of poor outcome were sys-tematically too high (Figure 1(b)). This overestimation was higher than in PRACTISE.
The internal and external validation in the complete cases (PAIS n¼1227, PRACTISE n¼1581, PASS n¼2098) yielded similar results (not shown).
The lower discriminative ability of the DSS-3 months in the external validation cohorts was largely explained by a less heterogeneous case-mix compared to the development cohort. This is illustrated by small differences between the development AUC and case-mix-corrected AUCs (online Supplemental Table 1). The lower discriminative ability in PASS compared to PAIS and PRACTISE was due to both case-mix and differences in predictor effects (relatively large difference between AUC in external validation and case-mix-corrected AUC in PASS).
The final DSS-3 months was developed on the com-bined data of all three cohorts (n¼4923). The model had an ordinal AUC of 0.73 and an AUC for the cutoff mRS 3 of 0.81 (95%CI 0.81–0.83) (online Supplemental Table 1).
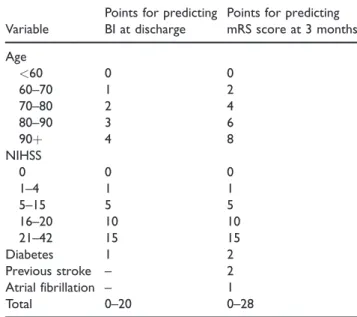
The final models are presented as the DSS score chart (Table 3, and simplified to five outcome classes in Figure 2), with higher scores indicating worse outcome. For example, a patient of 70 years with an NIHSS of 13 and a history of previous stroke and diabetes has a DSS-discharge score of 8 and a predicted probability of 17% for BI 19–20 at discharge and a DSS-3 months score of 13 and a predicted probability of 76% for mRS3 at three months (online Appendix 1).
Discussion
We propose the DSS, consisting of two simple predic-tion models for disability (BI) at discharge and func-tional outcome (mRS) at three months after acute ischemic stroke based on clinical information available on admission. The DSS-discharge consists of three var-iables: age per decade above 60 years, NIHSS per point
and diabetes. The DSS-3 months additionally includes previous stroke and atrial fibrillation. Both models showed reasonable performance in internal and exter-nal validation.
Relation with previous literature
Previously, several models to estimate the probability of unfavourable outcome after stroke have been devel-oped, with a high variability in endpoints, time between symptom onset and assessment of the variables, and patient populations. Literature reviews have shown that many of these prediction models have methodo-logical shortcomings that limit their use for early dis-charge planning. For instance, assessment of predictors multiple days after stroke onset18,19 and the use of a dichotomous outcome such as mortality.20–26 In addi-tion, previously developed models were not validated, and hence their use in clinical practice is limited.8,27
One tool has been developed specifically to predict unfavorable discharge destination from the hospital stroke unit. Functional disability, poor sitting balance, depression, cognitive disability and old age were iden-tified as predictors of poor discharge outcome.10 However, this model was only applicable for decision-making at 7–10 days post stroke. Moreover, this study had some methodological shortcomings, including dichotomisation of predictors, a small sample size and dichotomisation of the outcome.
Table 3. DSS score chart based on ordinal analysis of the BI and mRS. A higher score indicates a worse outcome (lower predicted BI and higher mRS).
Variable
Points for predicting BI at discharge
Points for predicting mRS score at 3 months
Age
<60 0 0
60–70 1 2
70–80 2 4
80–90 3 6
90þ 4 8
NIHSS
0 0 0
1–4 1 1
5–15 5 5
16–20 10 10
21–42 15 15
Diabetes 1 2
Previous stroke – 2
Atrial fibrillation – 1
Total 0–20 0–28
Implications of study findings
Prediction models in acute stroke are useful to inform patients and relatives on prognosis and identify patients at risk for poor outcome before treatment decisions are made.7 On population level, prediction models can be used for adjustment when comparing quality of care for stroke patients across institutions. Additionally, prediction models could be relevant in design and analysis of randomised controlled trials, e.g. for covariate adjustment.28,29 Further, prediction of functional outcome may contribute to discharge planning. If functional outcome is expected to be poor, contextual factors, such as housing circumstan-ces, financial problems and whether or not a patient is living alone, become more important.
We developed the DSS to be used by stroke unit nurses during the first day after admission. In clinical practice, the NIHSS is mostly scored shortly after the administration of alteplase. Therefore, we did not add treatment with alteplase as a covariable to our analysis. Recently, intra-arterial treatment administered within six hours after stroke onset has been shown beneficial in patients with a proximal intracranial arterial occlu-sion.30However, the majority (90%) of acutely admit-ted ischemic stroke patients still receives intravenous alteplase as only treatment. Therefore, the DSS is potentially suitable for use in present neurovascular practice. To facilitate discharge planning in endovascular-treated patients, a next step could be to update the models by including treatment (thromboly-sis, thrombectomy or both) as a predictor. Moreover, no imaging or laboratory tests are required for clini-cians to be able to use the DSS, which allows bedside use of the models early after admission. The DSS score chart can be easily incorporated in clinical practice since it consists of a few readily obtainable clinical var-iables at admission. Stroke unit nurses will be able to score all variables, including the NIHSS, provided that they are well trained and certified.
The DSS-discharge still needs to be externally vali-dated to give reliable estimates on model performance and study generalisability.
At external validation, the discriminative ability of the DSS-3 months was generally lower than in the development sample. Discrimination was better in PRACTISE compared to PASS, both for the ordinal analysis of the mRS and for three different cutoffs of the mRS (online Supplemental Table 1). These higher AUCs were partly explained by differences in case-mix, as reflected in the case-mix-corrected AUCs. In addi-tion, the predictor effects were slightly stronger in PRACTISE than in PASS. These differences in regres-sion coefficients were most evident for diabetes and previous stroke, and could be explained by
discrepancies in predictor definitions. For instance, in PASS, previous stroke comprised both Transient Ischemic Attack (TIA) and ischemic stroke, while in PRACTISE only ischemic stroke was considered. This implicates that the DSS-3 months is valid, but the definitions of the predictors should be identical to those in the development cohort.
The reasonable discriminative ability of the DSS-3 months was associated with an overall overestimation of the probability of poor outcome. This overestima-tion was higher in PASS compared to PRACTISE, which might be due to the difference in outcome dis-tribution between these cohorts (lower proportion of patients with poor outcome in PASS). This difference is most likely caused by the exclusion of patients with imminent death and neurological deterioration in PASS. The overestimation of the probability of poor outcome implies that the DSS-3 months needs updating (e.g. adjustment of the intercept (recalibration)) before it is suitable for individualised predictions in clinical practice.
Strengths and limitations
Strengths of this study are the internal and (partial) external validation of the DSS, and the large size of the development and two independent validation cohorts. Even though many models have been devel-oped for prediction of outcome after stroke, the large sample size and the aim of contributing to efficient dis-charge planning makes that our study has added value compared to already existing evidence. Also, we pre-dicted outcomes over the whole range from no symp-toms to death. Furthermore, we used two well-known and widely implemented outcome measures for func-tional outcome in our models. The BI is a reliable and valid scale to measure ADL.31Since discharge destina-tion (partially) depends on the patient’s ability to carry out ADL, the BI is a suitable outcome for our model. Additionally, we selected potential predictors based on the literature and clinical knowledge. This is preferred over selection based on the data as the latter may result in overfitting (model perfect for the development data but performing poor in new patients).12The robustness of our approach is represented in the reasonable per-formance of the models in internal and external validation.
performance of the models beyond the Dutch setting, external validation in observational data from settings with a different healthcare system configuration is nec-essary. However, the Dutch stroke population is repre-sentative for stroke populations in developed countries. Moreover, our external validation cohorts consist of unselected, prospectively included patients, originating from hospitals representative in size, geographic distri-bution and frequency of stroke treatment procedures. We were able to externally validate the DSS-3 months, but not the DSS-discharge as no data on BI at dis-charge were available. Also, disdis-charge policy is variable between and within different healthcare systems, which makes it a difficult outcome for prediction purposes. However, these differences in discharge timing resem-ble the variation in clinical practice. Additionally, in the field of rehabilitation, predicting functional out-come in terms of the mRS has limitations. Important aspects that can contribute to the level of disability and the need for rehabilitation (e.g. pain, communication, cognition) are not entirely covered by the mRS.32 However, the mRS is a widely used outcome measure in stroke management.
The prognostic performance of the DSS after vali-dation could be classified as satisfactory. This does not disqualify the usefulness of the models for clinical prac-tice, because in general, multivariable prediction models are able to incorporate and accurately weigh more factors than a human mind.33 Nevertheless, the results should always be regarded as a mere recommen-dation and should be placed in the context of the per-sonal circumstances, needs and wishes of the patient. Other factors that are worth considering when plan-ning patients’ discharge are the presence of social sup-port, cognitive disability, the therapeutic needs of the patient and the expected future residence destination (e.g. home or nursing facility).
Conclusion
The DSS has satisfactory performance in predicting BI at discharge and mRS at three months in ischemic stroke patients. If further validated, the DSS may con-tribute to efficient stroke unit discharge planning alongside patients’ contextual factors (e.g. social sup-port, housing circumstances and cognitive disability) and therapeutic needs.
Declaration of Conflicting Interests
The author(s) declared the following potential conflicts of interest with respect to the research, authorship, and/or pub-lication of this article: SD receives revenue from the Collaborative European NeuroTrauma Effectiveness Research in Traumatic Brain Injury (CENTER-TBI).
Funding
The author(s) disclosed receipt of the following financial sup-port for the research, authorship, and/or publication of this article: This study is funded by the Foundation for Neurovascular Research Rotterdam (SNOR, Stichting Neurovasculair Onderzoek Rotterdam). The PAIS study was funded by the Dutch Heart Foundation (grant number 2002B148). The PRACTISE study was funded by the Netherlands Organization for Health Research and Development (ZON-MW, grant number 945–14-217). The PASS study was funded by the Netherlands Organization for Health Research and Development (ZON-MW, grant numbers 171002302 and 016116358), the Netherlands Heart Foundation (grant number 2009B095), and the European Research Council (ERC Starting Grant).
Informed consent Not applicable.
Ethical approval
All trial protocols were approved by the local ethics commit-tees of the corresponding centres.
Guarantor DD.
Contributorship
DD, ES and HF conceived and supervised the study. IR, SD and HF were involved in data analysis. IR and SD wrote the manuscript. MS, HH, MD, WW, PN, DB and GR provided critical revision of the manuscript for intellectual content. All authors approved the final version of the manuscript. IR and SD contributed equally to this article.
Trial registration
PAIS study – Netherlands Trial Register: NTR2365. PRACTISE study – ISRCTN registry: ISRCTN20405426. PASS study – ISRCTN registry: ISRCTN66140176.
Acknowledgements
The Dutch Stroke Score was developed by researchers from the Erasmus MC Rotterdam and validated in data provided by researchers from the Erasmus MC Rotterdam and AMC Amsterdam. The authors wish to thank the investigators and patients participating in the PAIS, PRACTISE and PASS trials.
References
2. Kennisnetwerk CVA Nederland. Benchmarkindicatoren. In:Benchmarkresultaten 2014, rapportage en achtergron-dinformatie(2016, accessed 26 June 2017).
3. van Swieten JC, Koudstaal PJ, Visser MC, et al. Interobserver agreement for the assessment of handicap in stroke patients.Stroke1988; 19: 604–607.
4. Mahoney FI and Barthel DW. Functional evaluation: the Barthel Index.Md State Med J1965; 14: 61–65. 5. Lees KR, Bath PM, Schellinger PD, et al. Contemporary
outcome measures in acute stroke research: choice of pri-mary outcome measure.Stroke2012; 43: 1163–1170. 6. Veerbeek JM, Kwakkel G, van Wegen EE, et al. Early
prediction of outcome of activities of daily living after stroke: a systematic review.Stroke2011; 42: 1482–1488. 7. Steyerberg EW, Moons KG, van der Windt DA, et al. Prognosis Research Strategy (PROGRESS) 3: prognostic model research.PLoS Med2013; 10: e1001381.
8. Counsell C and Dennis M. Systematic review of prognos-tic models in patients with acute stroke.Cerebrovasc Dis
2001; 12: 159–170.
9. den Hertog HM, van der Worp HB, van Gemert HM, et al. The Paracetamol (Acetaminophen) In Stroke (PAIS) trial: a multicentre, randomised, placebo-controlled, phase III trial. Lancet Neurol 2009; 8: 434–440.
10. Meijer R, van Limbeek J, Peusens G, et al. The Stroke Unit Discharge Guideline, a prognostic framework for the discharge outcome from the hospital stroke unit. A prospective cohort study.Clin Rehabil2005; 19: 770–778. 11. Senn S and Julious S. Measurement in clinical trials: a neglected issue for statisticians? Stat Med 2009; 28: 3189–3209.
12. Steyerberg EW. Validation of prediction models. In:
Clinical prediction models: a practical approach to devel-opment, validation and updating. New York: Springer, 2009, pp.299–310.
13. Dirks M, Niessen LW, van Wijngaarden JD, et al. Promoting thrombolysis in acute ischemic stroke.
Stroke2011; 42: 1325–1330.
14. Westendorp WF, Vermeij JD, Zock E, et al. The Preventive Antibiotics in Stroke Study (PASS): a prag-matic randomised open-label masked endpoint clinical trial.Lancet2015; 385: 1519–1526.
15. Van Calster B, Van Belle V, Vergouwe Y, et al. Discrimination ability of prediction models for ordinal outcomes: relationships between existing measures and a new measure.Biom J2012; 54: 674–685.
16. Vergouwe Y, Moons KG and Steyerberg EW. External validity of risk models: Use of benchmark values to dis-entangle a case-mix effect from incorrect coefficients.Am J Epidemiol2010; 172: 971–980.
17. Steyerberg EW and Harrell FE Jr. Prediction models need appropriate internal, internal-external, and external validation.J Clin Epidemiol2016; 69: 245–247.
18. Counsell C, Dennis M and McDowall M. Predicting functional outcome in acute stroke: comparison of a simple six variable model with other predictive systems and informal clinical prediction. J Neurol Neurosurg Psychiatry2004; 75: 401–405.
19. Counsell C, Dennis M, McDowall M, et al. Predicting outcome after acute and subacute stroke: development and validation of new prognostic models. Stroke 2002; 33: 1041–1047.
20. Ntaios G, Faouzi M, Ferrari J, et al. An integer-based score to predict functional outcome in acute ischemic stroke: the ASTRAL score. Neurology 2012; 78: 1916–1922.
21. Weimar C, Konig IR, Kraywinkel K, et al. Age and National Institutes of Health Stroke Scale Score within 6 hours after onset are accurate predictors of outcome after cerebral ischemia: development and external valida-tion of prognostic models.Stroke2004; 35: 158–162. 22. Myint PK, Clark AB, Kwok CS, et al. The SOAR
(Stroke subtype, Oxford Community Stroke Project clas-sification, Age, prestroke modified Rankin) score strong-ly predicts earstrong-ly outcomes in acute stroke. Int J Stroke
2014; 9: 278–283.
23. Ayis SA, Coker B, Rudd AG, et al. Predicting indepen-dent survival after stroke: a European study for the devel-opment and validation of standardised stroke scales and prediction models of outcome. J Neurol Neurosurg Psychiatry2013; 84: 288–296.
24. O’Donnell MJ, Fang J, D’uva C, et al. The PLAN score: a bedside prediction rule for death and severe disability following acute ischemic stroke. Arch Intern Med2012; 172: 1548–1556.
25. Saposnik G, Kapral MK, Liu Y, et al. IScore: a risk score to predict death early after hospitalization for an acute ischemic stroke.Circulation2011; 123: 739–749.
26. Smith EE, Shobha N, Dai D, et al. Risk score for in-hospital ischemic stroke mortality derived and validated within the Get With the Guidelines-Stroke Program.
Circulation2010; 122: 1496–1504.
27. Kwakkel G, Wagenaar RC, Kollen BJ, et al. Predicting disability in stroke–a critical review of the literature.Age Ageing1996; 25: 479–489.
28. Pocock SJ, Assmann SE, Enos LE, et al. Subgroup anal-ysis, covariate adjustment and baseline comparisons in clinical trial reporting: current practice and problems.
Statist Med2002; 21: 2917–2930.
29. Roozenbeek B, Lingsma HF and Maas AI. New consid-erations in the design of clinical trials for traumatic brain injury.Clin Investig Lond2012; 2: 153–162.
30. Goyal M, Menon BK, van Zwam WH, et al. Endovascular thrombectomy after large-vessel ischaemic stroke: a meta-analysis of individual patient data from five randomised trials.Lancet2016; 387: 1723–1731. 31. Duffy L, Gajree S, Langhorne P, et al. Reliability
(inter-rater agreement) of the Barthel Index for assessment of stroke survivors: systematic review and meta-analysis.
Stroke2013; 44: 462–468.
32. Berzina G, Sveen U, Paanalahti M, et al. Analyzing the modified Rankin scale using concepts of the international classification of functioning, disability and health.Eur J Phys Rehabil Med2016; 52: 203–213.