Dissociation of CHD3 on Cu(111), Cu(211), and single atom alloys of Cu(111)
Nick Gerrits, Davide Migliorini, and Geert-Jan Kroes
Citation: J. Chem. Phys. 149, 224701 (2018); doi: 10.1063/1.5053990
View online: https://doi.org/10.1063/1.5053990
View Table of Contents: http://aip.scitation.org/toc/jcp/149/22
Published by the American Institute of Physics
Articles you may be interested in
CHD3 dissociation on Pt(111): A comparison of the reaction dynamics based on the PBE functional and on a specific reaction parameter functional
The Journal of Chemical Physics 149, 044701 (2018); 10.1063/1.5039458
Methane on a stepped surface: Dynamical insights on the dissociation of CHD3 on Pt(111) and Pt(211) The Journal of Chemical Physics 149, 094701 (2018); 10.1063/1.5046065
Vibrational enhancement in the dynamics of ammonia dissociative chemisorption on Ru(0001) The Journal of Chemical Physics 149, 044703 (2018); 10.1063/1.5043517
Methane dissociation on Pt(111): Searching for a specific reaction parameter density functional The Journal of Chemical Physics 144, 044702 (2016); 10.1063/1.4939520
Application of van der Waals functionals to the calculation of dissociative adsorption of N2 on W(110) for static and dynamic systems
The Journal of Chemical Physics 144, 084702 (2016); 10.1063/1.4942198
Dissociation of CHD
3on Cu(111), Cu(211), and single atom
alloys of Cu(111)
Nick Gerrits,a)Davide Migliorini, and Geert-Jan Kroesb)
Leiden Institute of Chemistry, Gorlaeus Laboratories, Leiden University, P.O. Box 9502, 2300 RA Leiden, The Netherlands
(Received 28 August 2018; accepted 20 November 2018; published online 11 December 2018)
In order to model accurately reactions of polyatomic molecules with metal surfaces important for heterogeneous catalysis in industry, the Specific Reaction Parameter (SRP) approach to density func-tional theory has been developed. This approach has been shown to describe the dissociation of CHD3on Ni(111), Pt(111), and Pt(211) with chemical accuracy. In this work, predictions have been
made for the reaction of CHD3 on Cu(111) and Cu(211) using barriers, elbow plots, andab initio
molecular dynamics. Future experiments could hopefully prove the transferability of the SRP func-tional to systems in which methane reacts with flat and stepped surfaces of adjacent groups of the periodic table, by comparison with our predictions. Moreover, the effect of a so-called single atom alloy on the reactivity of methane is investigated by making predictions for CHD3on Pt–Cu(111) and
Pd–Cu(111). It is found that the reactivity is only increased for Pt–Cu(111) near the alloyed atom, which is not only caused by the lowering of the barrier height but also by changes in the dynamical pathway and reduction of energy transfer from methane to the surface.Published by AIP Publishing.
https://doi.org/10.1063/1.5053990
I. INTRODUCTION
For heterogeneous catalysis, one of the most important processes is steam reforming, where methane and steam react over a metal catalyst and form molecular CO and hydro-gen. At high temperatures, the dissociation of methane is a rate controlling step on a wide variety of metals1,2 and thus warrants detailed study of the breaking of the CH bond on metal surfaces. Moreover, methane dissociation on cop-per is a much investigated method for creating high quality graphene.3–9 However, due to the complexity of the interac-tion between metals and molecules and of describing both metals and molecules accurately, this reaction remains dif-ficult for theoretical studies.10–14Recently, it has been shown that chemically accurate results can be obtained for molecule-surface reactions by using a so-called Specific Reaction Param-eter (SRP) approach.15–17Furthermore, the recently developed
SRP32-vdW functional not only gives chemically accurate results for the reaction for which it is developed [CHD3
+ Ni(111)16], but it is also transferable to metals from the
same periodic table group [CHD3+ Pt(111)17] and to stepped
surfaces [CHD3+ Pt(211)17]. Here we perform predictive
cal-culations for the reaction of methane on surfaces of a metal belonging to a neighbouring group of the periodic table. We hope that our predictive calculations will be followed by exper-iments that can test the transferability of the SRP32-vdW functional to a flat and stepped Cu surface, i.e., Cu(111) and Cu(211).
Moreover, a way to improve catalysts is to introduce alloys,18 which can be used to both increase reactivity and
a)Electronic mail: n.gerrits@lic.leidenuniv.nl b)Electronic mail: g.j.kroes@chem.leidenuniv.nl
selectivity.19For example, methane dissociation is so highly
activated on Pt and Ni that the methane will completely dehy-drogenate and thus poison the catalyst.20–22However, by
com-bining Pt or Ni with a less reactive metal like Cu, a highly active catalyst that does not poison itself can be produced.22In order
to be able to clearly identify the effect of the different met-als, we will look at the so-called Single Atom Alloys (SAAs), where a small portion (5%) of the top surface atoms is replaced with a different metal. These alloyed metal atoms do not clus-ter and thus can be viewed as single isolated atoms.23–25 So far, only a limited amount of information is available for the reaction of methane on alloys.22,26–30 As such, the SRP32-vdW functional will not only be used to make a prediction for Cu(111) and Cu(211), but it will also be applied to SAAs of Cu(111) that incorporate metals for which the functional either gives chemically accurate results (Pt) or is expected to (Pd).
In short, this work makes a prediction for the reactivity of methane on Cu(111), Cu(211), Pd–Cu(111), and Pt–Cu(111). Furthermore, a detailed analysis of the dynamical behavior is provided. The paper is structured as follows: a short summary of the technical details is given in Sec. II, and the barriers are discussed in Sec.III Afollowed by the minimum energy path in Sec.III B. In Sec.III C, the sticking probabilities are presented, while Sec.III Dconcerns the impact site associated with reactive collisions. Finally, a short summary is given in Sec.IV.
II. METHOD
All theab initiomolecular dynamics (AIMD) and elec-tronic structure (Density Functional Theory, DFT) calculations have been performed with the Vienna Ab initio Simulation
224701-2 Gerrits, Migliorini, and Kroes J. Chem. Phys.149, 224701 (2018)
Package (VASP version 5.3.5).31–35 A kinetic energy cutoff of 350 eV and aΓ-centered 6×6×1 k-point grid are used. Furthermore, core electrons have been represented with the Projector Augmented Wave (PAW) method35,36 using an Ar
core PAW pseudo-potential for Cu. The (111) surfaces are modeled using a 5 layer (3× 3) supercell, while the (211) surface is modeled using a 4 layer (1 ×3) supercell. Fur-thermore, the vacuum distance between the slabs is 13 Å. In order to speed up convergence, first order Methfessel-Paxton smearing37with a width parameter of 0.2 eV has been applied. Calculations have been performed without spin polar-ization, which is not required for a diamagnetic material as Cu. This computational setup is confirmed to be converged to within chemical accuracy (1 kcal/mol), and results with respect to this convergence are given in the supplementary material.
For the alloys, a single surface layer atom in the supercell is replaced with a Pt or Pd atom, which is similar to what is observed in experiment,22,24and results in a coverage of 1/9th
of a monolayer. The alloyed atom is confirmed to remain at its position; i.e., it does not travel over the surface.
Transition states are obtained with the dimer method38–41
as implemented in the VASP Transition State Tools (VTST) package, with the forces on the degrees of freedom converged within 5 meV/Å, and are confirmed to be first order saddle points by doing frequency analysis, i.e., by checking if only one imaginary frequency was found. An ideal slab is used, where the top three layers have been relaxed in the z direction. For the AIMD simulations, a surface temperature of 550 K is used, where the atoms in the top three layers are allowed to move in all three directions and the ideal lattice constant is expanded by a factor of 1.0078 in order to reflect the expan-sion of the bulk due to the surface temperature.42For every
AIMD data point, 1000 trajectories were done, unless noted otherwise, with a time step of 0.4 fs. The rest of the techni-cal details for the AIMD techni-calculations can be found in recent work16,17,43 and in the supplementary material. We use the
SRP32-vdW functional previously used for CHD3+ Ni(111),
Pt(111), and Pt(211),16,17of which the exchange part is defined as
Ex=x·ExRPBE+ (1−x)·ExPBE, (1)
whereERPBEx andExPBE are the exchange parts of the RPBE (revised Perdew, Burke and Ernzerhof)44 and PBE (Perdew, Burke and Ernzerhof)45 exchange-correlation functionals, respectively, andx= 0.32. Moreover, the van der Waals (vdW) correlation functional of Dion and coworkers (vdW-DF1)46is used. Earlier work by our group has shown that using a van der Waals correlation functional may be important to a correct description of the energy dependence of the reaction proba-bility,47signifying that the variation of the barrier height with
molecular orientation and impact site is correctly described47
and that this is also true for methane interacting with met-als.16,17,48With the use of an appropriate correlation functional and an appropriate weighted average of exchange functionals, SRP-DFT has been shown to be capable of accurately describ-ing the minimum barrier height, the anisotropy and corrugation of the barrier height, and the position of the barrier, which determines how efficiently pre-exciting stretch vibrations
may enhance the reactivity (see Ref.15and the supplemen-tary material of Refs. 16 and 49). Finally, CHD3 is used
instead of CH4in order to avoid artificial intramolecular
vibra-tional energy redistribution (IVR) in the dynamics when the CH stretch mode is vibrationally excited.43,50For arguments
regarding the reliability of the quasi-classical trajectory (QCT) approach implicit in the AIMD, we refer the reader to the sup-plementary material of Refs.16and43. Here, we were able to argue that the approach should not suffer much from prob-lems like zero-point energy violation and be accurate already for the reaction of molecules in their ground vibrational state just above the reaction threshold, with reaction probabilities of the order of a percent. We were able to establish this on the basis of the quality of the comparison of QCT calculations with quantum dynamics calculations for D2 + Cu(111),51 as
D2 has a similar vibrational frequency and reduced mass as
the CH stretch vibration in CHD3, and of actual AIMD
cal-culations for CHD3+ Pt(111) which showed that the reaction
near the threshold only involved zero-point energy violation in only 1 out of 144 reactive trajectories.43
III. RESULTS
A. Barriers
The transition state geometries for the dissociation of methane on several surfaces are summarized in TableI and in Fig.1, where the naming convention from Ref.52is used for the transition states on (111) surfaces. Figure 2 depicts the angles that are used to characterize the transition states. θ is the angle between the surface normal and the dissociat-ing CH bond and βis the angle between the surface normal and the umbrella axis, which is defined as the vector going through the geometric center of the three H-atoms and the car-bon. Finally,γis the angle between the dissociating CH bond and the umbrella axis.
The transition state geometry on Cu(111) is similar to those on Ni(111) and Pt(111), except the CH-bond and umbrella axis of the methane have a slightly smaller tilt with respect to the surface normal (i.e., θ and βare larger) and the bond distance (r‡) of the dissociating hydrogen is much larger; i.e., the location of the barrier is later compared to Ni(111) and Pt(111). Moreover, the barrier height is 166.6 kJ/mol, which is 68.7 kJ/mol higher than for Ni(111). Since the barrier on Cu(111) is later and higher than on Ni(111) and Pt(111), less reactivity is expected. The barrier geometry does not change considerably when PBE-vdW is used instead of SRP32-vdW, but the barrier is 9.4 kJ/mol lower. This is to be expected since PBE is more reactive than SRP32-vdW, as PBE is less repulsive than a mixture of PBE and RPBE.15
TABLE I. The barrier geometries for Cu(100), Cu(111), Cu(211), Pt–Cu(111), Pd–Cu(111), Pd(111), Ni(111), and Pt(111). The naming convention from Ref.52is used for the (100) and (111) surfaces. Geometry names for Cu(211) indicate first the location of the methane and then the direction of the dissociating hydrogen. The height of the carbon of the EtoE and E/BtoB geometries on Cu(211) is taken with respect to the top step edge, while the height for the TtoB geometry is with respect to the atom in the middle of the (111) terrace. Forθ,β, andγon Cu(211), the surface normal is the macroscopic surface normal; i.e., the orientation of the terraces and steps are not taken into account. The zero-point energy corrected barriers are given in the brackets.
Surface Site ZC‡(Å) r‡(Å) θ‡(deg) β‡(deg) γ‡(deg) E
b(kJ/mol)
Cu(100) G2 geometry 2.19 1.84 129.4 165.3 35.9 166.1 (152.1)
Cu(111) C2 geometry 2.25 1.79 136.4 169.4 33.0 166.6 (151.8)
Cu(111) C2 geometry (550 K) 2.25 1.80 136.6 168.4 31.9 167.9 (153.4) Cu(111) C2 geometry (PBE-vdW) 2.24 1.77 136.3 168.3 32.0 157.2 (143.1) Cu(111) C2 geometry (optB86b-vdW) 2.19 1.74 134.1 167.5 33.4 136.2 (122.4) Cu(111) C2 geometry (optB86b-vdW)22 . . . . . . . . . . . . . . . 129.3
Cu(111) C2 geometry (SRP32-DF2) 2.28 1.79 137.1 168.8 31.7 182.3 (167.8)
Cu(111) Fcc 2.25 1.80 133.4 162.5 29.2 187.4 (171.7)
Cu(111) Bridge 2.26 1.84 129.8 160.8 31.0 193.9 (178.2)
Cu(211) EtoE geometry 2.08 1.86 125.1 157.4 34.4 137.8 (128.4)
Cu(211) E/BtoB geometry 1.90 1.81 158.3 168.3 33.4 152.9 (138.8)
Cu(211) TtoB geometry 1.39 1.81 143.1 163.2 33.3 174.3 (159.8)
Pt–Cu(111) Atop Pt 2.36 1.66 133.2 165.3 32.1 134.1 (121.8)
Pt–Cu(111) Atop Pt (PBE-vdW) 2.35 1.65 132.7 164.9 32.2 124.8 (112.6) Pt–Cu(111) Atop Pt (optB86b-vdW) 2.32 1.62 131.4 164.2 32.9 100.3 (88.1) Pt–Cu(111) Atop Pt (optB86b-vdW)22 . . . . . . . . . . . . . . . 84.9
Pt–Cu(111) Nearest neighbour 2.26 1.83 137.5 170.3 32.8 173.4 (159.2) Pt–Cu(111) Next nearest neighbour 2.26 1.80 136.3 168.7 32.5 165.7 (151.8) Pt–Cu(111) Next nearest neighbour (PBE-vdW) 2.21 1.79 135.7 168.2 32.5 156.4 (143.3) Pt–Cu(111) Next nearest neighbour (optB86b-vdW) 2.16 1.76 133.4 167.4 34.0 135.6 (122.4)
Pd–Cu(111) Atop Pd 2.32 1.76 136.9 167.9 32.0 142.5 (129.2)
Pd–Cu(111) Nearest neighbour 2.26 1.81 136.7 169.0 32.4 172.3 (158.0) Pd–Cu(111) Next nearest neighbour 2.25 1.80 136.2 168.7 32.5 167.6 (153.5)
Ni(111)16 C2 geometry 2.18 1.61 135.7 164.7 29.1 97.9 (85.3)
Pd(111) A2 geometry 2.23 1.61 135.9 165.0 29.1 84.6 (70.7)
Pt(111)17 D1 geometry 2.28 1.56 133 168 35 78.7 (66.5)
Pt(111)48 D1 geometry (PBE-vdW) 2.29 1.54 133.9 168.4 . . . 73.9 (61.7)
optB86b-vdW is in good agreement with previous work,22
being 6 kJ/mol higher when the barrier is adjusted for an adsorption well of 13 kJ/mol (the barriers in previous work were reported with respect to the physisorbed state).
The barriers on the fcc and bridge sites are found by fix-ing the x and y coordinates of the carbon at these sites. While these barriers are second order saddle points, they do provide additional insight on the reactivity across the surface. The
224701-4 Gerrits, Migliorini, and Kroes J. Chem. Phys.149, 224701 (2018)
FIG. 2. Methane on Cu(211) with the E/BtoB geometry, indicating the geom-etry angles as used in TableI.θis the angle between the CH-bond and the surface normal,βis the angle between the umbrella axis and the surface normal, andγis the angle betweenθandβ.
CH-bond length is longer and the methane is tilted more compared to the top site, and the barrier is 20.8 and 27.3 kJ/mol higher for the fcc and bridge sites, respectively. The barrier height on Cu(100) is similar to the barrier height on Cu(111), which has been observed previously.5Furthermore, the methane has a larger tilt and is closer to the surface, while the barrier is slightly later. These differences between the (100) and (111) surfaces are observed for Ni as well,55except that the barrier height is 15 kJ/mol lower on Ni(100) than on Ni(111).
For Cu(211), three distinctly different barriers are found: above the top step edge atom, between the top and bottom step edge, and on the terrace, which are referred to as the EtoE, E/BtoB, and TtoB geometries, respectively. In general, the bond length of the dissociating CH bond is larger than on Cu(111); i.e., the barriers for Cu(211) are even later than for Cu(111). Furthermore, the barrier on the terrace (TtoB geometry) is 7.7 kJ/mol higher than on Cu(111), while the barriers at the step (EtoE and E/BtoB geometries) are 28.8 and 13.7 kJ/mol lower, respectively. Finally, for the EtoE geometry, the hydrogen dissociates towards the bridge site, which is at odds with the other transition state geometries obtained on Cu(211) for which the hydrogen atom moves towards a hollow site.
For alloys, above the next nearest neighbour Cu atom, almost no changes are observed compared to Cu(111). The nearest neighbour Cu atom shows an almost identical bar-rier geometry, but above these Cu atoms, the barbar-riers for Pt–Cu(111) and Pd–Cu(111) are 7 and 6 kJ/mol higher than on Cu(111), respectively. However, above the alloyed top atoms, the barrier changes considerably. The barrier above Pt is further away from the surface and the dissociating CH bond distance is smaller than for Cu(111) although the barrier is later than on Pt(111). Moreover, the barrier height is reduced with 32.7 kJ/mol relative to Cu(111), although the barrier is much higher than on Pt(111). When using another functional like PBE-vdW, these changes to the barrier are very similar, suggesting that mixing PBE with RPBE only affects the minimum barrier height and not other physics like the energetic corrugation of the barrier height. Previous work22 using the optB86b-vdW functional saw a much larger reduction of 44 kJ/mol relative
to Cu(111), whereas we find a reduction of 35.7 kJ/mol when using the optB86b-vdW functional (note that the barrier heights previously reported22were incorrect and the corrected
results are available in Ref.56). The geometry found previ-ously22is slightly different but can only explain a small part
of the difference (about 2 kJ/mol) between the previous results and the results in this work. Most of the difference is caused by the relaxation of the surface atoms during the dimer calculation in Ref.22due to the considerable resulting protrusion of the Pt atom. Furthermore, using a different xc-functional (optB86b-vdW54) results in smaller lattice constants for solids.57 This could mean that due to different lattice constants caused by the different functionals, a different strain in the lattice of a SAA is observed, resulting in a different barrier height for the alloy.
Marcinkowski and co-workers22introduced the parameter
α=E
Cu(111)
b −E
Pt–Cu(111) (atop Pt) b
EbCu(111)−EbPt(111) , (2)
whereα= 0 andα= 1 indicate a barrier height equal to Cu(111) and Pt(111), respectively. The lower barrier found previously22 givesαoptB86b−vdW= 0.52; i.e., the barrier is between a Pt(111)-like and Cu(111)-Pt(111)-like barrier, whereas the higher barrier found in this work with the SRP32-vdW functional is closest to Cu(111) sinceαSRP32−vdW = 0.37. Moreover, PBE-vdW also results in a more Cu(111)-like barrier withαPBE−vdW = 0.39. Although additional work is needed, it seems that by allowing the Pt atom to pucker out, the barrier becomes more Pt-like for Pt–Cu(111).
Finally, we checked that relaxing the top layer in the x and y direction also does not have a large influence on the barrier height. When the top layer is relaxed in the x and y direction also before the dimer calculation (but note that the top layer is kept fixed during the transition state search), above Pt, the barrier is reduced by 3.4 kJ/mol and above the next nearest neighbour Cu the barrier is increased by 1.2 kJ/mol. It is expected that similarly small effects will occur for the case of Pd–Cu(111).
Above the alloyed Pd top atom in Pd–Cu(111), the barrier height is reduced by 24.1 kJ/mol and the changes for the geom-etry relative to Cu(111) are similar to those for the Pt alloy, but smaller. This is to be expected since the barrier on Pd(111) is also higher and later than on Pt(111). Likewise, Pd–Cu(111) has a barrier height that is even more similar to a Cu(111)-like barrier height sinceα= 0.29, which is also reflected by the fact that the barrier geometry above Pd is more similar to Cu(111) than what is observed above Pt.
B. Minimum energy path
FIG. 3. Elbow plot of methane on Cu(111) (a), above Pd in Pd–Cu(111) (b), above the next nearest neighbour Cu in Pt–Cu(111) (d), and above Pt in Pt–Cu(111) (e). (c) and (f) are the same as (a), but with reacted trajectories for 181.3 kJ/mol andν1= 1 (c) andν1= 2 (f). Methane is fixed in its transition state geometry above the top site, whereas Z and the bond distance of the dissociating hydrogen are variable. Contour lines are drawn at intervals of 0.05 eV between 0.5 and 2.0 eV. The colours indicate the energy (eV) with respect to methane in the gas phase. The black circles in panel (a) indicate points from a NEB calculation, while the black squares indicate the highest point along the MEP.
calculation, where all degrees of freedom are relaxed, in Fig.3(a)are in excellent agreement with the MEP, which is assumed to be the case for other surfaces also. As already stated above, the barrier is late and high on Cu(111). Moreover, the MEP does not have a smooth curvature, but makes almost a right angle. Hence, incoming molecules may not be able to fol-low the MEP due to the requirement of a high kinetic energy to overcome the barrier combined with the sharp turn of the MEP and thus may have to react over much higher barriers (“the bobsled effect”59,60). This can also be seen in Fig.3(c), where the reacted trajectories at Ei = 181.3 kJ/mol and ν1 = 1 are superimposed on the elbow plot. Even when the
vibrational energy is increased toν1 = 2, the trajectories are
not able to follow the MEP in Fig.3(f). Furthermore, in Fig.4, the top site transition state is taken and placed above the fcc
FIG. 4. (a) The MEP from Fig.3(a)(green) and above the fcc site on Cu(111) (blue). The fcc MEP was obtained by placing the top site geometry on the fcc site. (b) Curvature from the aforementioned MEPs. The red points indicate the transition state, while the black squares indicate the point on the MEP with the largest curvature.
site resulting in a similar elbow plot, although the MEP is more strongly curved. The barrier obtained from this elbow plot is 185.9 kJ/mol, which is only 1.5 kJ/mol lower than the barrier obtained using a constraint dimer search. This sug-gests that the barrier geometry is almost independent of the reaction site. Additionally, the change in energy when moving away from the transition state at the top site is similar to the change found at the fcc site, i.e., the corrugation around the barrier geometry is again almost independent of the reaction site.
Similarly, Fig.3(b)shows the MEP of methane dissoci-ating above the Pd atom in Pd–Cu(111). Here, the MEP is further away from the surface and through a lower barrier than for Cu(111). However, the MEP above the Pt atom in Pt–Cu(111) in Fig.3(e)shows larger differences than above Pd relative to Cu(111), which could be caused by the fact that the barrier above Pd is more similar to Cu(111) than above Pt. Above Pt the barrier is lower and earlier and the MEP has a smoother curvature. Furthermore, the MEP for Pt–Cu(111) has a similar curvature as and is at a higher distance to the surface than in the MEP for Pt(111), while the barrier is later and higher. Above the next nearest Cu atom for both alloys, a similar MEP was obtained as for Cu(111), as can be seen in Fig.3(e)for Pt–Cu(111). Summarizing, the MEPs above the Pt and Pd atoms in the alloys exhibit similar but not identi-cal features as the MEPs for Pt(111) and Pd(111). Above the Cu atoms in the alloys, the MEPs are similar to the MEP for Cu(111).
224701-6 Gerrits, Migliorini, and Kroes J. Chem. Phys.149, 224701 (2018)
FIG. 5. The same as Fig.3, but for Cu(211) with the A8 geometry (a) and with theθangle optimized (c). (b) and (d) show the MEP for Cu(111) and Cu(211), whereθis optimized. The contour lines in (a) and (c) are drawn at intervals of 0.05 eV between 0.0 and 1.6 eV and indicate the energy (eV) with respect to methane in the gas phase. The colours in (b) and (d) indicate the difference in angle with respect to the transition state, and contour lines are drawn at intervals of 0.5◦between−10◦and 24◦. The black squares indicate
the highest point along the MEP.
molecule would follow the MEP, it would undergo a rapid reorientation of the CH-bond when it approaches the surface before it is able to extend the CH bond. The bending along the MEP for Cu(211) is similar as for Cu(111).
C. Sticking probability
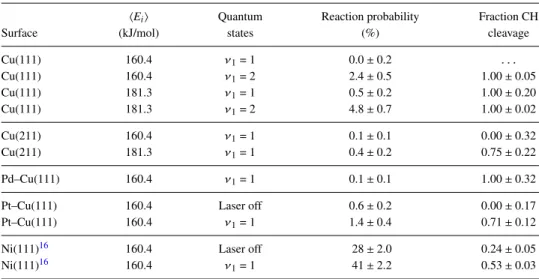
In Table II, results are summarized for AIMD on sev-eral surfaces. At incidence energies close to the minimum barrier height, methane has a much lower sticking probabil-ity on Cu(111) than on Ni(111). At 160 kJ/mol and ν1 = 1,
no reaction is observed on Cu(111), and with ν1 = 2 a
reac-tion probability of only 2.4% is obtained. At higher incidence energy, some reaction is observed, but only for vibrationally excited molecules, which also explains why only CH cleavage is observed and no CD cleavage.
Surprisingly, on Cu(211), a similar reaction probability is obtained as for Cu(111). This could imply that the lower barriers found around the step edge on Cu(211) are dynami-cally inaccessible. However, CD cleavage is observed, which could indicate that methane found a lower barrier to dissociate over on Cu(211) than on Cu(111) since no CD cleavage was found at Cu(111) for the same or even higher energy, although it remains unclear whether this is a statistical anomaly. It is more probable that the increase in reactivity due to the steps combined with reduction in reactivity due to the terraces leads to a similar reactivity for Cu(211) as Cu(111).
On Pd–Cu(111), the reaction probability is low for 160 kJ/mol andν1= 1, i.e., only 0.1%±0.1. Apparently, the
lower-ing of the barrier atop the Pd atom is not large enough to enable the reaction of methane for 160 kJ/mol andν1= 1. By contrast,
on Pt–Cu(111), a higher reaction probability is observed. Inter-estingly, the barrier atop the Pt atom on Pt–Cu(111) is only 8 kJ/mol lower than atop Pd on Pd–Cu(111), and it is not clear whether this can fully account for the increased reaction prob-ability at 160 kJ/mol and forν1 = 1. It is possible that since
the barrier on Pt is earlier and the MEP in the entrance chan-nel is less curved than on Pd, the reaction is also dynamically more favorable on the Pt doped surface than on the Pd doped surface due to a smaller bobsled effect.59,60Moreover, it was found that the energy transfer (ET) from scattered methane to the surface atoms of the Pt–Cu(111) and Pd–Cu(111) surface is about 10 kJ/mol lower than to the Cu(111) surface at equal incidence energy (hEii=160 kJ/mol) (see TableIII), withET being defined as
ET =(Vi+Ki)−(Vf +Kf), (3)
where V and K are the potential free and kinetic energy of methane at the initial (i) and final (f) steps of the trajec-tories. It is possible that due to the additional lattice strain caused by the alloyed atoms, energy transfer from methane to the surface via phonon excitations is less efficient. This is also supported by the fact that the partial phonon densities of states of the Pt and nearest neighbour Cu top layer atoms in
TABLE II. Sticking probabilities obtained with AIMD for Cu(111), Cu(211), Pd–Cu(111), Pt–Cu(111), and Ni(111). For Cu(111) and Cu(211) at 160 kJ/mol andν1= 1, 500 and 692 trajectories were simulated, respectively. The error bars represent 68% confidence intervals.
hEii Quantum Reaction probability Fraction CH
Surface (kJ/mol) states (%) cleavage
Cu(111) 160.4 ν1= 1 0.0±0.2 . . .
Cu(111) 160.4 ν1= 2 2.4±0.5 1.00±0.05
Cu(111) 181.3 ν1= 1 0.5±0.2 1.00±0.20
Cu(111) 181.3 ν1= 2 4.8±0.7 1.00±0.02
Cu(211) 160.4 ν1= 1 0.1±0.1 0.00±0.32
Cu(211) 181.3 ν1= 1 0.4±0.2 0.75±0.22
Pd–Cu(111) 160.4 ν1= 1 0.1±0.1 1.00±0.32
Pt–Cu(111) 160.4 Laser off 0.6±0.2 0.00±0.17 Pt–Cu(111) 160.4 ν1= 1 1.4±0.4 0.71±0.12
Ni(111)16 160.4 Laser off 28±2.0 0.24±0.05
TABLE III. Energy transfer of scattered methane to Cu(111), Pd–Cu(111), Pt–Cu(111), and Pt(111) athEii=160 kJ/mol. The results for Pt(111) are extrapolated from earlier work.17The error bars represent 68% confidence
intervals.
Surface Energy transfer (kJ/mol) Baule model
Cu(111) 62±1 57
Pd–Cu(111) 53±1 55
Pt–Cu(111) 52±1 53
Pt(111)17 28±1 20
Pt–Cu(111) are found at higher energies than in Cu(111), which is shown in thesupplementary material. Furthermore, it is likely that the difference in energy transfer is partially caused by the difference in mass between the Cu atoms and the alloyed atoms, as one would expect in the Baule model.61,62A mod-ified Baule model, which weights energy loss to the Pt or Pd atom in the surface layer according to its fractional coverage in the SAA, yields good agreement with the AIMD results for energy transfer to the surface atoms.
In most cases, exciting theν1 vibrational mode leads to
more CH-cleavage than CD cleavage (see TableII). However, it remains difficult to draw conclusions on the fraction of CH cleavage due to the limited amount of reacted trajectories. Fur-thermore, Fig.6shows theθ, β, andγangles of methane on Cu(111) and Pt–Cu(111) at the highest collision energies, not-ing that the initial conditions are similar for the two surfaces, except methane has a higher kinetic energy and vibrational excitation on Cu(111) than on Pt–Cu(111). Here we see that the angular distributions of the reacting methane are similar on both surfaces and that there is little steering in theθ and βangles, but there is quite some steering in the bend angle γin order to follow the MEP. Moreover, it is to be expected on the basis of the elbow plots that the vibrational efficacy is high. Unfortunately, due to the limited amount of reactiv-ity, typically only vibrationally excited molecules react, i.e., vibrational energy promotes the reaction but it is unclear by how much, as we hardly see laser off reaction. Therefore, we could not compute vibrational efficacies for our AIMD data. Finally, no trapping is observed, which is to be expected
FIG. 6. θ,β, andγangles of methane during AIMD for scattered and reacted trajectories at the initial time step and when a dissociating bond reaches the transition state value. Solid lines are for Cu(111) (Ei= 181 kJ/mol and
ν1= 2), and dashed lines are for Pt–Cu(111) (Ei= 160 kJ/mol andν1= 1).
considering the high kinetic energy methane has in our simulations.
D. Reaction site
Figures7(a)and7(c)show the reaction site of methane on Cu(111) forν1= 1 andν1= 2, respectively, withEi= 181 kJ/mol. Methane does not have a clear preference of reaction site on Cu(111) since the distribution appears to be statistical. It is likely that since the barrier above the hollow sites is only 21 kJ/mol higher than above the top site, and methane has a high energy due to both the translational and the vibrational energy, dynamically there is no preference of reaction site. Also, no significant steering in x and y is observed for either scattered or reacted trajectories.
On Cu(211), methane reacts only at the step, as can be seen in Fig.8. Furthermore, during the dissociation, the methyl
FIG. 7. The impact site of reacting methane on Cu(111) forν1= 1 (a) andν1 = 2 (c), withEi= 181 kJ/mol, and on Pt– Cu(111) for laser off (b) and laser on (ν1 = 1) (d), withEi= 160 kJ/mol. The gray circles indicate Pt atoms, while the blue circles indicate the Cu top layer surface atoms. The green and red circles are the impact sites where the dissociation of a CH (green) or CD (red) bond occurred. The empty green and red circles indi-cate the location of methane att= 0 fs, while the solid circles are for when dis-sociation takes place, i.e., whenr=r‡.
224701-8 Gerrits, Migliorini, and Kroes J. Chem. Phys.149, 224701 (2018)
FIG. 8. The impact site of reacting methane on Cu(211) forEi= 181 kJ/mol andν1= 1. The blue shaded area indicates the step, while the red dashed line is the top step edge. The blue circles are the top layer surface atoms, and the green and red circles are the impact sites where the dissociation of a CH (green) or CD (red) bond occurred. The empty green and red circles indicate the location of methane att= 0 fs, while the solid circles are for when dissociation takes place, i.e., whenr=r‡.
moves towards the bottom step edge, while the dissociating hydrogen moves towards the terrace, with the dissociating bond located above the top step edge atom. This can also be seen from the fact that the centre of mass moves from the top step edge towards the bottom step edge, i.e., there is some steer-ing. Interestingly, for none of the reactive events, the centre of mass is above the top step edge atom, which is the loca-tion of the lowest barrier, nor does the hydrogen dissociate towards the bottom step edge, which would be another low bar-rier. It remains unclear due to the limited amount of reacted trajectories whether this is a statistical anomaly or whether the aforementioned barriers are dynamically inaccessible, for instance, due to the late barrier geometry.
On Pt–Cu(111), for both laser off and laser on, reaction occurs near the Pt, as can be seen in Figs.7(b)and7(d). This means that Pt only alters the barrier locally as suggested by the elbow plots and the minimum barriers. Moreover, in con-trast to Cu(111), methane reacts relatively closer to the Pt top site, with no difference being observed between CH and CD bond dissociation. Again, no significant steering in x and y is observed.
IV. CONCLUSIONS
In this work, we have made predictions with AIMD on the reactivity of methane on several copper-based surfaces using the SRP32-vdW functional, combined with barriers and elbow plots in order to rationalize the results. The results predict a much lower reactivity for Cu(111) than for Ni(111) and Pt(111) due to the high and late barrier found on Cu(111), requiring high kinetic and vibrational energies in order to observe the reaction. Furthermore, methane has the same reaction proba-bility on Cu(211) as on Cu(111), but with the reaction occur-ring only at the steps. This can be understood from the lower barriers at the step and higher barriers at the terrace relative to Cu(111). Moreover, making a so-called single-atom alloy from
Cu(111) with Pt increases reactivity. This is partially caused by the reduction of the barrier height, together with changes in the dynamical pathway and reduction in energy transfer from the molecule to the surface. The minimum barrier is only affected locally around the alloyed atom, i.e., the Cu surface is unaffected, which is also reflected by the fact that methane reacts only near the top site of the Pt atom. Also, the choice of the exchange-correlation functional can have a large effect on the changes of the local barrier above the alloyed barrier. For Pd–Cu(111), the reduction in barrier height and changes in the dynamical pathway were not sufficient to observe reactiv-ity at the same energies as Pt–Cu(111). Finally, we hope that our predictive calculations will be followed by experiments in order to prove the transferability of the SRP32-vdW func-tional among systems in which methane interacts with flat and stepped surfaces of metals belonging to adjacent groups of the periodic table and among systems in which the interaction is with SAAs of these metals.
In the present paper, we have made predictions of the reactivity of methane on copper surfaces for a limited range of incidence energies, which additionally are at the high end of what can be achieved with molecular beams using seed-ing with H2. In the future, it may be possible to use a neural
network (NN) approach to fit a potential energy surface for methane interacting with a mobile copper surface. Such an approach63has already been used successfully for dissociation of diatomic molecules reacting on metal surfaces.64,65 How-ever, research will have to be carried out aimed at investigating whether accurate NN potentials can in fact be developed for polyatomic molecules reacting on metals and whether in fact reaction probabilities smaller than 1% can be calculated accu-rately with a quasi-classical approach (due to the possibility of quantum effects and potential problems with zero-point energy violation).
SUPPLEMENTARY MATERIAL
Seesupplementary materialfor more detailed procedures and results for the AIMD.
ACKNOWLEDGMENTS
This work was financially supported by the European Research Council through an ERC2013 advanced grant (No. 338580) and through an NWO/CW TOP grant (No. 715.017.001). Furthermore, this work was carried out on the Dutch national e-infrastructure with the support of NWO-EW. The authors thank Michail Stamatakis, Angelos Michaelides, Francesco Nattino, and Helen Chadwick for the useful discus-sions.
1J. Wei and E. Iglesia,J. Phys. Chem. B108, 4094 (2004).
2G. Jones, J. G. Jakobsen, S. S. Shim, J. Kleis, M. P. Andersson, J. Rossmeisl, F. Abild-Pedersen, T. Bligaard, S. Helveg, B. Hinnemann, J. R. Rostrup-Nielsen, I. Chorkendorff, J. Sehested, and J. K. Nørskov,J. Catal.259, 147 (2008).
3X. Li, W. Cai, J. An, S. Kim, J. Nah, D. Yang, R. Piner, A. Velamakanni, I. Jung, E. Tutuc, S. K. Banerjee, L. Colombo, and R. S. Ruoff,Science324, 1312 (2009).
4M. Losurdo, M. M. Giangregorio, P. Capezzuto, and G. Bruno,Phys. Chem.
5W. Zhang, P. Wu, Z. Li, and J. Yang,J. Phys. Chem. C115, 17782 (2011). 6K. Li, C. He, M. Jiao, Y. Wang, and Z. Wu,Carbon74, 255 (2014). 7X. Wang, Q. Yuan, J. Li, and F. Ding,Nanoscale9, 11584 (2017). 8J. Kraus, L. B¨obel, G. Zwaschka, and S. G¨unther,Ann. Phys.529, 1700029
(2017).
9B. Tian, T. Liu, Y. Yang, K. Li, Z. Wu, and Y. Wang,Appl. Surf. Sci.427, 953 (2018).
10G.-J. Kroes,Phys. Chem. Chem. Phys.14, 14966 (2012).
11B. Jackson, F. Nattino, and G.-J. Kroes,J. Chem. Phys.141, 054102 (2014). 12J. Wellendorff, T. L. Silbaugh, D. Garcia-Pintos, J. K. Nørskov, T. Bligaard,
F. Studt, and C. T. Campbell,Surf. Sci.640, 36 (2015).
13S. Gautier, S. N. Steinmann, C. Michel, P. Fleurat-Lessard, and P. Sautet,
Phys. Chem. Chem. Phys.17, 28921 (2015). 14G.-J. Kroes,J. Phys. Chem. Lett.6, 4106 (2015).
15C. D´ıaz, E. Pijper, R. A. Olsen, H. F. Busnengo, D. J. Auerbach, and G. J. Kroes,Science326, 832 (2009).
16F. Nattino, D. Migliorini, G.-J. Kroes, E. Dombrowski, E. A. High, D. R. Killelea, and A. L. Utz,J. Phys. Chem. Lett.7, 2402 (2016).
17D. Migliorini, H. Chadwick, F. Nattino, A. Guti´errez-Gonz´alez, E. Dom-browski, E. A. High, H. Guo, A. L. Utz, B. Jackson, R. D. Beck, and G.-J. Kroes,J. Phys. Chem. Lett.8, 4177 (2017).
18A. Groß,Top. Catal.37, 29 (2006).
19M. Ramos, A. E. Mart´ınez, and H. F. Busnengo,Phys. Chem. Chem. Phys. 14, 303 (2011).
20H. M. Swaan, V. C. H. Kroll, G. A. Martin, and C. Mirodatos,Catal. Today 21, 571 (1994).
21A. Iglesias-Juez, A. M. Beale, K. Maaijen, T. C. Weng, P. Glatzel, and B. M. Weckhuysen,J. Catal.276, 268 (2010).
22M. D. Marcinkowski, M. T. Darby, J. Liu, J. M. Wimble, F. R. Lucci, S. Lee, A. Michaelides, M. Flytzani-Stephanopoulos, M. Stamatakis, and E. C. H. Sykes,Nat. Chem.10, 325 (2018).
23H. L. Tierney, A. E. Baber, and E. C. H. Sykes,J. Phys. Chem. C113, 7246 (2009).
24F. R. Lucci, T. J. Lawton, A. Pronschinske, and E. C. H. Sykes,J. Phys.
Chem. C118, 3015 (2014).
25J. P. Simonovis, A. Hunt, R. M. Palomino, S. D. Senanayake, and I. Waluyo,
J. Phys. Chem. C122, 4488 (2018).
26P. Reyes, A. Figueroa, G. Pecchi, and J. L. G. Fierro,Catal. Today62, 209 (2000).
27K. Persson, A. Ersson, K. Jansson, N. Iverlund, and S. J¨ar˚as,J. Catal.231, 139 (2005).
28A. Kokalj, N. Bonini, S. de Gironcoli, C. Sbraccia, G. Fratesi, and S. Baroni,
J. Am. Chem. Soc.128, 12448 (2006).
29W. An, X. C. Zeng, and C. H. Turner,J. Chem. Phys.131, 174702 (2009). 30S. Yuan, L. Meng, and J. Wang,J. Phys. Chem. C117, 14796 (2013). 31G. Kresse and J. Hafner,Phys. Rev. B49, 14251 (1994).
32G. Kresse and J. Hafner,Phys. Rev. B47, 558 (1993).
33G. Kresse and J. Furthm¨uller,Phys. Rev. B54, 11169 (1996). 34G. Kresse and J. Furthm¨uller,Comput. Mater. Sci.6, 15 (1996). 35G. Kresse and D. Joubert,Phys. Rev. B59, 1758 (1999). 36P. E. Bl¨ochl,Phys. Rev. B50, 17953 (1994).
37M. Methfessel and A. T. Paxton,Phys. Rev. B40, 3616 (1989). 38G. Henkelman and H. J´onsson,J. Chem. Phys.111, 7010 (1999). 39A. Heyden, A. T. Bell, and F. J. Keil,J. Chem. Phys.123, 224101 (2005). 40J. K¨astner and P. Sherwood,J. Chem. Phys.128, 014106 (2008). 41P. Xiao, D. Sheppard, J. Rogal, and G. Henkelman,J. Chem. Phys.140,
174104 (2014).
42A. Mondal, M. Wijzenbroek, M. Bonfanti, C. D´ıaz, and G.-J. Kroes,J. Phys.
Chem. A117, 8770 (2013).
43F. Nattino, H. Ueta, H. Chadwick, M. E. van Reijzen, R. D. Beck, B. Jackson, M. C. van Hemert, and G.-J. Kroes,J. Phys. Chem. Lett.5, 1294 (2014). 44B. Hammer, L. B. Hansen, and J. K. Nørskov,Phys. Rev. B59, 7413 (1999). 45J. P. Perdew, K. Burke, and M. Ernzerhof,Phys. Rev. Lett.77, 3865 (1996). 46M. Dion, H. Rydberg, E. Schr¨oder, D. C. Langreth, and B. I. Lundqvist,
Phys. Rev. Lett.92, 246401 (2004).
47M. Wijzenbroek and G. J. Kroes,J. Chem. Phys.140, 084702 (2014). 48F. Nattino, D. Migliorini, M. Bonfanti, and G.-J. Kroes,J. Chem. Phys.144,
044702 (2016).
49G.-J. Kroes, C. D´ıaz, E. Pijper, R. A. Olsen, and D. J. Auerbach,Proc. Natl.
Acad. Sci. U. S. A.107, 20881 (2010).
50Z. Xie, J. M. Bowman, and X. Zhang,J. Chem. Phys.125, 133120 (2006). 51C. D´ıaz, R. A. Olsen, D. J. Auerbach, and G. J. Kroes,Phys. Chem. Chem.
Phys.12, 6499 (2010).
52S. Nave and B. Jackson,J. Chem. Phys.130, 054701 (2009).
53K. Lee, E. D. Murray, L. Kong, B. I. Lundqvist, and D. C. Langreth,Phys.
Rev. B82, 081101(R) (2010).
54J. Klimeˇs, D. R. Bowler, and A. Michaelides,Phys. Rev. B83, 195131 (2011).
55S. Nave, A. K. Tiwari, and B. Jackson,J. Chem. Phys.132, 054705 (2010). 56M. T. Darby, M. Stamatakis, A. Michaelides, and E. C. H. Sykes,J. Phys.
Chem. Lett.9, 5636 (2018).
57J. Park, B. D. Yu, and S. Hong,Curr. Appl. Phys.15, 885 (2015). 58H. J´onsson, G. Mills, and K. W. Jacobsen,Classical and Quantum Dynamics
in Condensed Phase Simulations(World Scientific, 1998), pp. 385–404. 59R. A. Marcus,J. Chem. Phys.45, 4493 (1966).
60E. A. McCullough and R. E. Wyatt,J. Chem. Phys.51, 1253 (1969). 61B. Baule,Ann. Phys.349, 145 (1914).
62E. Kennard,Kinetic Theory of Gases: With an Introduction to Statistical
Mechanics(McGraw-Hill Book Company, Inc., London, 1938). 63J. Behler and M. Parrinello,Phys. Rev. Lett.98, 146401 (2007). 64K. Shakouri, J. Behler, J. Meyer, and G.-J. Kroes,J. Phys. Chem. Lett.8,
2131 (2017).
65Q. Liu, X. Zhou, L. Zhou, Y. Zhang, X. Luo, H. Guo, and B. Jiang,J. Phys.
![FIG. 1. Top and side view of the transition state of methane on Cu(111) with the C2 geometry [(a) and (b)], on Cu(211) with the EtoE geometry [(c) and (d)], Pd(111) with the A2 geometry [(e) and (f)], and on Pt–Cu(111) [(g) and (h)] and Pd–Cu(111) [(i) and](https://thumb-us.123doks.com/thumbv2/123dok_us/8173586.2166886/4.891.88.806.858.1074/view-transition-state-methane-geometry-etoe-geometry-geometry.webp)