THE PRIVATE PROVISION OF PUBLIC GOODS:
THREE ESSAYS ON THE EVOLVING PUBLIC ECONOMICS OF PHILANTHROPY
Alexandra Graddy-Reed
A dissertation submitted to the faculty at the University of North Carolina at Chapel Hill in partial fulfillment of the requirements for the degree of Doctor of Philosophy in the Department of Public
Policy.
Chapel Hill 2015
© 2015
ABSTRACT
Alexandra Graddy-Reed: The Private Provision of Public Goods: Three essays on the evolving public economics of philanthropy
(Under the direction of Maryann P. Feldman)
This dissertation contributes to the literature on the private provision of public goods through three papers. The first paper is focused on the organizational level of providing public goods. The paper collects survey data on North Carolina for-profit and nonprofit organizations and empirically demonstrates variation in organizational practices not captured by legal designation. This paper then addresses how private provision of public goods changes in response to economic recession and how responses vary by organizational type and strategy. The second paper addresses the issue of classification of nonprofit entities to consider the role of strategic giving. A
classification model based on source of funding and grantmaking strategy is put forth and vetted using a dataset constructed from IRS Form 990s over a five year time period. The paper analyzes differences in giving trends by this classification system during and post-recession and shows how grant size and total giving are impacted by both an organization’s funding source and their
grantmaking strategy. The third paper expands the nonprofit theoretical base by creating an innovation production model to assess the role of competition in nonprofit organizations focused on disease treatment and eradication. An empirical estimation of the model with multiple innovative outcomes highlights the importance of market share and labor quality to innovation-related
ACKNOWLEDGEMENTS
I would like to acknowledge the support and guidance of so many wonderful people who helped me along this journey. It’s a bit hard to believe that after five years I have finished the last step of graduate school. My research would not be possible without the support of my advisor and chair, Maryann Feldman. Maryann led my training and supported my research goals throughout my time at UNC. When I joined the program and her lab we began work on many exciting projects. She pushed me to look at questions from different perspectives and to connect ideas from across multiple disciplines. Maryann’s guidance not only improved my approach to research but also acclimated me to academic culture, connecting me to a valuable network of collaborators and partners. I’m very thankful for her kind support throughout the program and for pushing me to go further than I thought I could.
I would also like to thank my doctoral committee members, who were and are an invaluable resource. I would like to thank Jeremy Moulton, Daniel Gitterman, Eleanor Brown, and Ashu Handa for their support, guidance, and feedback on my dissertation research. I am also appreciative of the support of the faculty, staff, and peers within the halls of Abernethy who assisted and
supported me. I would like to thank Christine Durrance, Mary Leigh Creedon, Molly Smith, Lauren Lanahan, Ashley Chaifetz, Jesse Hinde, and Evan Johnson. Thank you for help with STATA, administration, advice, and for generally keeping my spirits up!
Dissertation Completion Fellowship and from the National Science Foundation Science of Science and Innovation Policy Program Doctoral Dissertation Improvement Grant.
The 2012 North Carolina Social Innovation Survey was conducted with Dawn Trembath and the NC Fourth Sector Resource Project and made possible by support from the Public Policy Department at the University of North Carolina at Chapel Hill. I would also like to thank Madison Rivers, Jongmin Choi, Leslie Boney, Frank Ethridge, Don Hobart, Thomas Kelley, Katie Kross, Will Lambe, John Parker, and Leslie Scott and many others for their help with survey development and data collection.
The nonprofit data used in this dissertation are accessed from: the National Center for Charitable Statistics of the Urban Institute, the Foundation Center, Guidestar, Charity Navigator, and Metasoft Foundation Search and supported in part by the National Science Foundation Science of Science and Innovation Policy Program under Grant #1431289 and Grant #1158755. For their critical assistance in pulling data, I thank my research assistants Khadijah Diaz and Lee Hofrichter and colleagues Jongmin Choi and Jeff Savage. Earlier versions of these projects were presented at the 2014 West Coast Nonprofit Data Conference, the Academy of Management, the Association for Public Policy Analysis & Management, and the Association for Research on Nonprofit
Organizations & Voluntary Action conferences. I appreciate the feedback I received at these meetings.
So much thanks goes to my wonderful family and friends, who supported and cheered me on throughout this process. I would not be where I am now without the constant love and support I receive on a daily basis from so many great people that truly mean the world to me.
TABLE OF CONTENTS
LIST OF TABLES ... xii
LIST OF FIGURES ... xiv
CHAPTER ONE: THE PRIVATE PROVISION OF PUBLIC GOODS ... 1
1.1 Introduction ... 1
1.2 The Provision of Public Goods ... 2
1.3 Theoretical Foundations ... 4
1.4 Methodological Considerations ... 6
1.5 Overview of the Dissertation ... 7
1.5.1 Chapter Two: Stepping Up: An empirical analysis of the role of social innovation in response to an economic recession ... 7
1.5.2 Chapter Three: What’s in a Name? Disambiguating philanthropic grantmakers and their strategies ... 8
1.5.3 Chapter Four: The Race for a Cure: Collaborators or Competitors? Modeling the effects of competition in disease-specific charities ... 8
CHAPTER TWO: STEPPING UP: AN EMPIRICAL ANALYSIS OF THE ROLE OF SOCIAL INNOVATION IN RESPONSE TO AN ECONOMIC RECESSION ... 11
2.1 Introduction ... 11
2.2 Defining Social Innovation: Existing Theory & Literature ... 13
2.2.1 Innovation Out of Necessity: The Role of Economic Crisis ... 15
2.3.1 Legal Structure and the Impact of the Recession in North Carolina ... 18
2.3.2 Survey Design ... 19
2.3.3 Sample & Descriptive Statistics ... 21
2.3.4 Methods ... 25
2.4 Results ... 29
2.4.1 Organizational Traits in Socially Innovative Practices ... 29
2.4.2 Responding to the Recession: Introduction of New Products & Methods ... 30
2.4.3 Responding to the Recession: Increasing Social Support ... 31
2.5 Discussion... 33
CHAPTER THREE: WHAT’S IN A NAME? DISAMBIGUATING PHILANTHROPIC GRANTMAKERS AND THEIR STRATEGIES ... 43
3.1 Introduction ... 43
3.2 The State of American Philanthropy ... 45
3.2.1 A Reappearing Act: Strategic Grantmaking in American Philanthropy ... 45
3.2.2 Evaluating Success in Philanthropy ... 48
3.3 A Model of Organizational Classification ... 54
3.3.1 Existing Classification Systems ... 54
3.3.2 A New Model of Classification ... 58
3.4 Research Design & Methods: Applying & Evaluating the Model ... 62
3.4.1 Vetting the System ... 62
3.4.2 Applying the System ... 63
3.5 Data ... 65
3.5.3 Descriptive Statistics ... 68
3.6 Results ... 70
3.6.1 Vetting the System: Multinomial Logit Results ... 70
3.6.2 Applying the System: OLS Results, Year-Level ... 71
3.6.3 Applying the System: OLS Results, Grant-Level ... 73
3.7 Discussion... 74
CHAPTER FOUR: THE RACE FOR A CURE: COLLABORATORS OR COMPETITORS? MODELING THE EFFECTS OF COMPETITION IN DISEASE-SPECIFIC CHARITIES ... 97
4.1 Introduction ... 97
4.2 Disease-Specific Charities ... 98
4.2.1 Leveraging Venture Philanthropy in the Drug-Development Pipeline ... 100
4.2.2 Partnering and Lobbying ... 102
4.3 Developing a Nonprofit Innovation Production Function ... 103
4.4 A Disease-Specific Charity Innovation Production Function ... 109
4.5 An Empirical Specification of the Nonprofit Innovation Production Function ... 115
4.5.1 Model Specifications ... 116
4.5.2 Data and Sample ... 119
4.6 Results ... 121
4.6.1 Results: Feigenbaum, Revisited ... 121
4.6.2 Results: Characteristics of Grantmaking and Lobbying Organizations ... 121
4.6.3 Results: Grantmaking Investment ... 123
4.6.4 Results: Royalty Revenue ... 124
4.6.5 Results: Lobbying Expenditures ... 125
CHAPTER FIVE: CONCLUSIONS AND POLICY RECOMMENDATION ... 144
4.1 Stepping Up: An empirical analysis of the role of social innovation in response to an economic recession ... 144
4.2 What’s in a Name? Disambiguating philanthropic grantmakers and their strategies ... 145
4.3 The Race for a Cure: Collaborators or Competitors? Modeling the effects of competition in disease-specific charities ... 146
4.4 Plans for Future Research ... 147
APPENDIX ... 149
Appendix 2.1 List of Practices in Use by Legal Structure and Hybrid Terminology Sub-Samples ... 149
Appendix 3.1 List of Words Used from Mission Statements and Grant Descriptions ... 150
Appendix 3.2 Comparison of Classification System to Restricted Version ... 154
Appendix 3.3 Sample & Population Comparison ... 155
Appendix 3.4 Multinomial Logit Result by Alternate Classifications ... 156
Appendix 3.5 OLS Regression Results of Annual Data by Alternate Classifications ... 157
Appendix 3.6 OLS Regression Results of Grant Data by Alternate Classifications ... 158
Appendix 4.1 Geographic Market Share and Size Distribution ... 159
Appendix 4.2 State Distribution Comparison ... 161
LIST OF TABLES CHAPTER ONE
1.1 Overview of Dissertation ... 10
CHAPTER TWO 2.1: Comparison of State and Survey Sample County Distributions ... 38
2.2: Descriptive Statistics by Legal Structure and Hybrid Terminology Sub-Samples ... 39
2.3: Scale of Social Innovation Regression Results ... 40
2.4: Scale of Post-Recession Introductions Negative Binomial Regression Results ... 41
2.5: Post Recession Increases to Social Support Logistic Regression Results ... 42
CHAPTER THREE 3.1 Summary Statistics – Nonprofit Level ... 86
3.2 Summary Statistics – Grant Level ... 87
3.3 Category Distributions ... 88
3.4 Category Comparisons ... 89
3.5 Multinomial Logit Result ... 90
3.6 OLS Regression Results of Annual Data, 2007-2011 ... 91
3.7 OLS Regression Results of Annual Data, Recession: 2008-2009 ... 92
3.8 OLS Regression Results of Annual Data, Post recession: 2010-2011 ... 93
3.9 OLS Regression Results of Grant Data, 2007-2011 ... 94
3.10 OLS Regression Results of Grant Data, Recession: 2008-2009 ... 95
3.11 OLS Regression Results of Grant Data, Post recession: 2010-2011 ... 96
4.2: GEN’s Top 20 Grantmaking Disease Nonprofits ...133
4.3: Factors of Innovation for Disease-Specific Charities ...134
4.4: Related-Disease Organization Market Share & Size ...135
4.5: Descriptive Statistics by Major NTEE Group ...136
4.6: Descriptive Statistics of Grantmaking & Lobbying Organizations ...137
4.7: Regression Results—Feigenbaum’s (1987) Model with Current Sample ...139
4.8: Regression Results—Characteristics of Investors, Innovators, & Advocates ...140
4.9: Regression Results—Size of Grantmaking Investment ...141
4.10: Regression Results—Size of Royalty Revenue ...142
4.11: Regression Results—Size of Lobbying Expenditures ...143
APPENDIX TABLES 2.1 List of Practices in Use by Legal Structure and Hybrid Terminology Sub-Samples ...149
3.1 List of Words Used from Mission Statements and Grant Descriptions ...150
3.2 Comparison of Classification System to Restricted Version ...154
3.3 Sample & Population Comparison ...155
3.4 Multinomial Logit Result by Alternate Classifications ...156
3.5 OLS Regression Results of Annual Data by Alternate Classifications ...157
3.6 OLS Regression Results of Grant Data by Alternate Classifications ...158
4.1 Geographic Market Share and Size Distribution ...159
LIST OF FIGURES CHAPTER TWO
2.1: Frequency of “Social Innovation” and related terms in academic publications ... 36
2.2: Sources of Social Innovation ... 36
2.3: Comparison of State and Sample Rural-Urban Distributions of Establishments with Employees ... 37
2.4: Comparison of State and Sample Economic Distress Tier Distributions of Establishments with Employees ... 37
2.5: Quartile Distribution of All Social Practices by Legal Structure ... 37
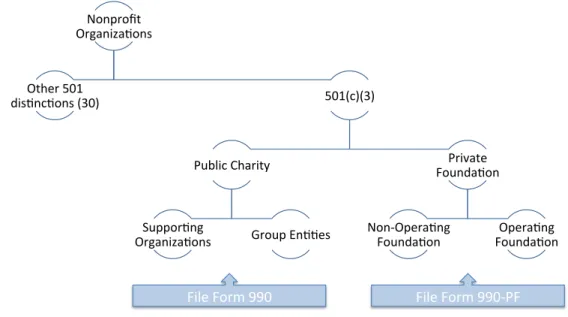
CHAPTER THREE 3.1 – Diagram of IRS 501(c)3 Classifications ... 79
3.2 – Diagram Adjusted for Common Types ... 79
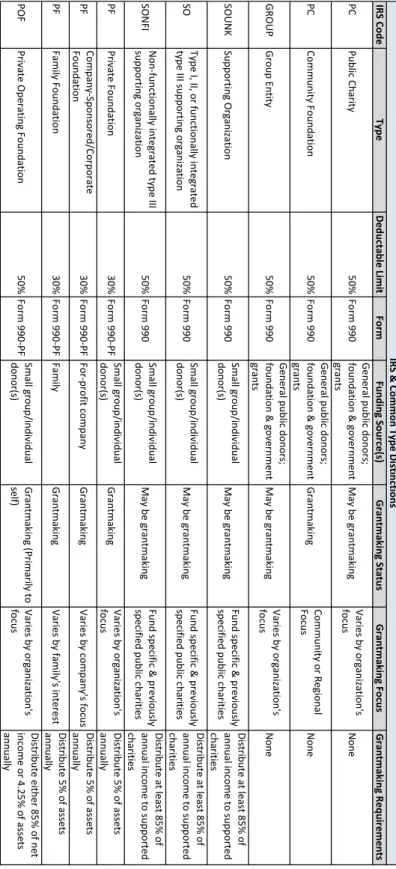
3.3 – Table of Distinctions by IRS Classification & Common Types ... 80
3.4 – Relationships between Grantmakers & Grant-Recipients ... 81
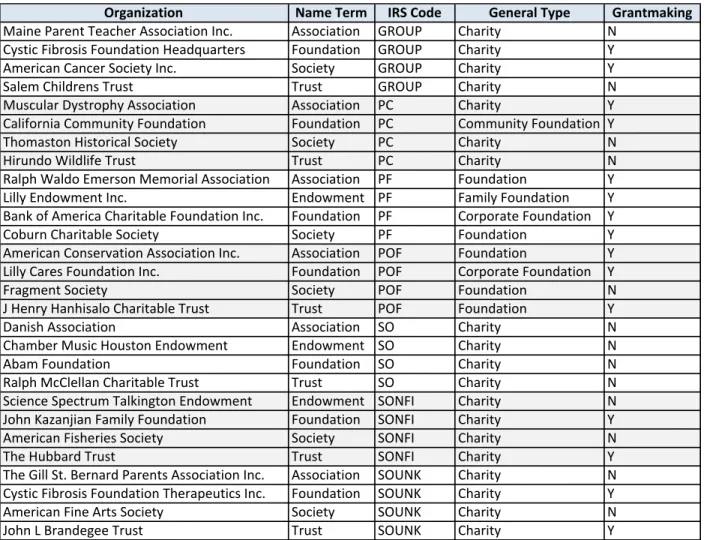
3.5 – Table of Variation Examples ... 82
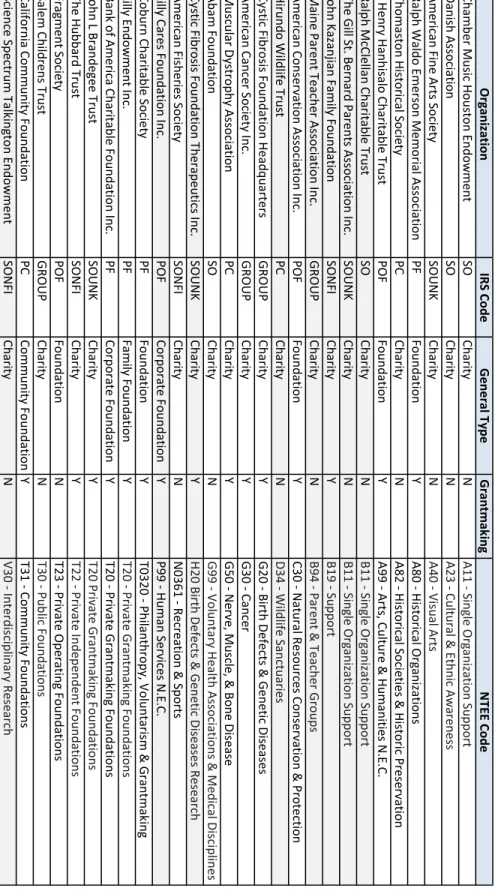
3.6 – Table of Variation Examples with NTEE Codes ... 83
3.7: Organization Classifications by Funding Structure and Mission Focus ... 84
3.8 – Table of Variations updated to New Classification System ... 85
CHAPTER ONE: THE PRIVATE PROVISION OF PUBLIC GOODS
1.1 Introduction
Nonprofit organizations support the United States (US) economy as direct providers of public goods, and as employers and revenue generators. They account for a growing share of the economy (5.5% of GDP in 2010) and provide almost 10% of wages for the American workforce (National Center for Charitable Statistics, 2013b). Philanthropy’s existence in the US has been constant throughout its history and encouraged by the cultural norm to give back and by the tax code that rewards it.
However, our understanding of these organizations as public good providers is limited – we lack information about what types of organizations are involved in philanthropy and what they contribute to the public good. A varied set of terms is used to describe philanthropy, which can confuse the discussion and empirical analysis. Generally referred to as the third sector to distinguish it from the for-profit and public spheres, it contains nonprofit organizations, which include
philanthropic foundations and charitable organizations that aim to provide for the common good. But confusion is growing over terminology as many nonprofit organizations incorporate revenue-generating streams, resembling those in the for-profit world. Additionally, research in this field is constrained by the available data on these organizations and their practices.
developing the theory around organizational philanthropic practices and by using three datasets to analyze their behavior that crosses over traditionally accepted boundaries.
1.2 The Provision of Public Goods
As Federal and state governments continue to debate the extent of their role in the provision of public goods and the regulation of other public good providers, it becomes especially relevant to understand how private individuals and organizations are changing to provide public goods and services. It is well accepted that public goods exist because they are goods that cannot be optimally provided for in the market due to their inherent nature as non-excludable and non-rivalrous. This market failure puts the onus on government to provide pure public goods like ensuring air quality, providing defense, and maintaining infrastructure, due to its size and capital.
However, in the US, a sector of nonprofit organizations, the third sector, exists to also provide quasi-public goods, acting as private providers of public goods. These quasi-public goods1
differ from pure public goods in that they could be excludable. They include social services like education and job training, food and nutrition, and health care – items benefiting the individual directly receiving them and the community in which these individuals live through positive
externalities. These public goods usually affect a smaller scale of individuals or community and often provide a private benefit in addition to the public good. Nonprofits serve as private providers of public goods since government will only provide public goods up to the desire of the median voter, leaving residual demand (Weisbrod, 1975). The US supports their efforts with two key financial incentives: nonprofit organizations themselves are exempt from many taxes paid by for-profit organizations, and individuals receive tax deductions for supporting nonprofit organizations.
Through these incentive structures, the Federal government indirectly supports nonprofits as public good providers.
In addition to the third sector, many for-profit organizations provide public goods, though to a lesser extent and in a different form than their nonprofit counterparts. Firms can offer benefits to their employees that improve their quality of life, support programs that benefit their surrounding community, or engage in positive environmental action. These activities can occur within the profit-driven mission of the firm or as an additional act of corporate social responsibility. These actions may be profit-maximizing in the long run and certainly affect communities and the quality of community life.
Individuals can also be private providers of pubic goods through philanthropy. Large and small donations from individuals to existing nonprofits, through their firm, or by creating a philanthropic foundation can lead to the provision of public goods. These different sources of philanthropy are well documented throughout the literature. The foundation of this work provides an understanding of the motivations behind individual philanthropy (Andreoni, 1990; Atkinson & Stern, 1974; Diamond, 1973; King, 1986). This is complemented by a line of research on the crowding in and out of government and private provision of public goods both through donations to nonprofit organizations (Andreoni & Payne, 2003, 2011; Bergstrom, Blume, & Varian, 1986; Bernheim, 1986), and to the funding of innovative activity (Blume-Kohout, Kumar, & Sood, 2009; Connolly, 1997; David, Hall, & Toole, 2000; Goldfarb, 2008).
The role of philanthropic foundations in the US overtime has been well documented
entrepreneurs with a strong social drive (Dacin, Dacin, & Tracey, 2011; Dart, 2004; Dees, 2008; Mulgan, 2006; Young & Salamon, 2002).
But it is not well known how these evolutions in organizational approach have affected the private provision of public goods. This dissertation contributes to the literature by documenting the changing organizational forms of philanthropy across legal structures, developing the theory of these organizations so that they may be more accurately classified by their behavior, and evaluating their provision of public goods using unique datasets. This chapter follows with a discussion of the theoretical foundations of this dissertation, methodological challenges and paths, and chapter summaries.
1.3 Theoretical Foundations
Public economics extends the foundations of microeconomic theory as related to market failures and considers the transaction costs of the government provision of public goods (Auerbach & Hines, 2002). It allows for the examination of issues related to individual decision-making, organizational behavior, and the effectiveness of tax policy at increasing a community’s welfare relative to the tax burden. Public economics serves as the theoretical foundation for this dissertation, with a focus on the theory of public good provision.
donations, as some non-givers may become givers with the additional income (Bergstrom et al., 1986). Bernheim (1986) extends this work to examine if individuals give toward a desired aggregate level, and argues that this does not hold if people enjoy giving – if they receive a personal benefit from donating (Bernheim, 1986). This points to the role of alternate motivations to giving that include public and private benefits. Andreoni’s (1990) impure altruistic model accounts for these motivations and concludes that a redistribution to more altruistic people will increase the total provision of giving, supporting the work of Bergstrom (1986), and that crowding out will be incomplete (Andreoni, 1990). Payne (1998) extends Andreoni’s framework by including firms producing the charitable good and individual’s acting through voting and donating. When controlling for firm heterogeneity and political and economic factors, Payne (1998) confirms incomplete crowd-out (Payne, 1998).
This theoretical base is extended to include the theories of institutional change and organizational behavior. These theories provide the ability to frame and evaluate individual, organizational, and institutional level changes overtime. Olson’s (1965) theory of collective action argues that unless the group is small in number, or there are individual incentives or coercion to make individuals act in larger groups, rational self-interested individuals will not act in the interest of the common good. This idea of the role of individual incentives and coercion is argued here to be the shape of social norms and pressure and can lead to the private provision of public goods discussed previously. The role of institutional norms is key to the extent of American philanthropy as they bound individuals to a culture that can change only incrementally (North, 1990; Ostrom, 2009). Philanthropists have prospered in motivating social change by working as elites within these confines and set roles (Bartley, 2007).
& Osberg, 2007; Peredo & McLean, 2006; Reis & Clohesy, 2001). This dissertation uses this foundation of entrepreneurship and innovation to evaluate and explain the work of foundations, nonprofits, and for-profit organizations in providing public goods. Griliches (1979) first put forth the knowledge production function to estimate the role of R&D activity on growth and knowledge (Griliches, 1979). Since then, the production function has been applied to measure the impact on various innovation output (Audretsch & Feldman, 1996; Feldman, 1994; Freel, 2005; Geroski, 1990; Slavtchev & Fritsch, 2005). Studies have found positive relationships between knowledge spillovers and firm innovation (Audretsch & Feldman, 1996; Feldman, 1994; Slavtchev & Fritsch, 2005), and that innovation also builds on experience so existing innovation furthers future work (Feldman, 1994). Thus, knowledge production should be studied at the spatial unit, as opposed to firm-level (Audretsch & Feldman, 2004). This thorough literature on innovation production needs to be applied more often to the empirical analysis of social innovation to better understand the motivations and consequences of its actions.
1.4 Methodological Considerations
impacts for nonprofits as it is very challenging to evaluate the success of a nonprofit’s program or properly capture its impact. Evaluation efforts are thus limited.
The papers in this dissertation work past these data deficiencies by collecting and utilizing data from a variety of sources and applying multiple methodological research designs to employ rigorous quantitative and mixed methods approaches. The first paper designs and implements a survey to collect quantitative data on organization’s behavior that is analyzed with econometrics. The second paper presents a hypothesized model of the types of philanthropic organizations. It then vets this classification scheme with econometric analysis of quantitative and qualitative data. The third paper develops a theoretical model for nonprofit organizations grounded in the theories of innovation, nonprofits, and competition and then empirically estimates the model.
1.5 Overview of the Dissertation
1.5.1 Chapter Two: Stepping Up: An empirical analysis of the role of social innovation in response to an economic recession
Categorizing organizations as either for-profit or nonprofit is a false dichotomy as existing for-profit firms are becoming more socially conscience while nonprofits are adopting profit-making activities to ensure their viability. This paper conceptualizes the array of social practices as a
1.5.2 Chapter Three: What’s in a Name? Disambiguating philanthropic grantmakers and their strategies
With the recent growth in American philanthropy has come increased attention to the results of foundations and nonprofits. However, there is still confusion about the types of organizations that comprise it, complicating the evaluation of nonprofits. Nonprofit, foundation, and association are classifying terms used interchangeably in organizations across legal and funding structure. This paper begins to address concerns of categorization and evaluation by presenting a classification of grantmakers by their funding source and strategy. Using data from the IRS Form 990 and Form 990-PF, this paper analyzes descriptive characteristics to vet this classification scheme and then analyzes grant-making behavior across the categories to assess their differences. Results show that focused organizations, both donation-based and endowed, provide more through grantmaking in terms of total giving and size of grant.
1.5.3 Chapter Four: The Race for a Cure: Collaborators or Competitors? Modeling the effects of competition in disease-specific charities
Economic theory holds that competition promotes innovation in the private market. In the third sector, however, the role of competition is uncertain: multiple nonprofits working toward the same goal likely means higher transaction costs from increased fundraising, marketing, and salaries. Disease-specific charities are driven to find cures, improve treatments, and provide patient support. In recent years, they have become more aggressive in funding research and providing public
advocacy, even if their cause affects a small number of people. However, it is unclear whether this increased attention has led to a change in the rate of progress.
disease-specific charities. The model develops the conditions that promote and deter progress in curing diseases, with careful attention to the role of competition. Using OLS regression analysis, the
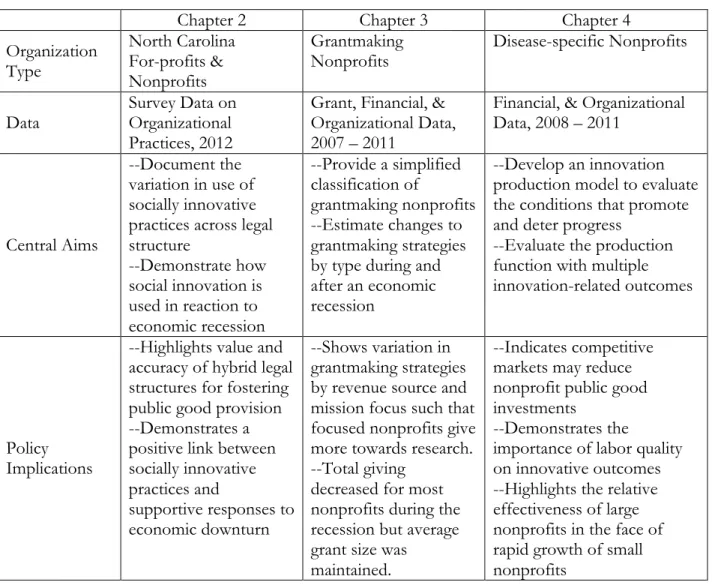
Table 1.1 Overview of Dissertation
Chapter 2 Chapter 3 Chapter 4
Organization Type
North Carolina For-profits & Nonprofits
Grantmaking
Nonprofits Disease-specific Nonprofits
Data Survey Data on Organizational Practices, 2012
Grant, Financial, & Organizational Data, 2007 – 2011
Financial, & Organizational Data, 2008 – 2011
Central Aims
--Document the variation in use of socially innovative practices across legal structure
--Demonstrate how social innovation is used in reaction to economic recession
--Provide a simplified classification of
grantmaking nonprofits --Estimate changes to grantmaking strategies by type during and after an economic recession
--Develop an innovation production model to evaluate the conditions that promote and deter progress
--Evaluate the production function with multiple innovation-related outcomes
Policy Implications
--Highlights value and accuracy of hybrid legal structures for fostering public good provision --Demonstrates a positive link between socially innovative practices and
supportive responses to economic downturn
--Shows variation in grantmaking strategies by revenue source and mission focus such that focused nonprofits give more towards research. --Total giving
decreased for most nonprofits during the recession but average grant size was
maintained.
--Indicates competitive markets may reduce nonprofit public good investments
--Demonstrates the
CHAPTER TWO: STEPPING UP: AN EMPIRICAL ANALYSIS OF THE ROLE OF SOCIAL INNOVATION IN RESPONSE TO AN ECONOMIC RECESSION
(With Maryann P. Feldman)2
2.1 Introduction
Organizations are typically either characterized as for-profit or nonprofit – an outdated dichotomy that does not accommodate the observed blended range of organizational practices and the improvised adaption to changing economic circumstances. Many for-profit businesses have made substantial changes to their practices to be more socially conscience at a time of greater need while nonprofit enterprises have adopted profit-making activities to ensure their viability in light of decreased government support and fewer private donations (Graddy-Reed, Feldman, & Trembath, 2013). Moreover, both for-profit and nonprofit organizations may be important contributors to their local economy depending on the quality of employment benefits provided, concerns for
environmental sustainability, and contributions to address quality of life concerns in their community (Feldman, 2014). Relatively little is known about how organizational practices have shifted across the legal distinction of for-profit and nonprofit or how the 2008 recession affected the use of different practices. This paper contributes by examining the role socially innovative practices play in responding to economic challenges and considering how these practices vary by legal
structure.
A variety of labels have been used to describe organizations that blend for-profit models with social goals. The terms social enterprise and social entrepreneurship have been applied to the adoption of revenue-generating models within nonprofit organizations (Dees, 2007; Foundation Center, n.d.-b) as well as to for-profit organizations operating with a social mission (Fleishman, 2007; Peredo & McLean, 2006). Terms like triple bottom line and corporate social responsibility are used to describe for-profit firms that attempt to create social benefit, while legal incorporation schemes, such as Low-Profit Limited Liability Corporation are introduced as a hybrid tax status. Other terms, like fourth
sector, are being introduced more recently in a search for new definitions, with uncertain degrees of
precision. There are discrepancies between the terms organizations use, their legal structure, tax status, and what they actually do. To move the agenda forward, we use the umbrella term social
innovation to broadly capture organizational efforts aimed at alleviating social problems. Our focus is
on innovative practices used by organizations to address societal problems and concerns.
This paper analyzes a survey of organizational practices in the US state of North Carolina to understand the range of practices in use and specifically examine how organizations responded to the 2008 economic recession. We conceptualize the use of social innovation practices as a
continuum and reveal variation that is not captured by prevailing legal distinctions. The paper provides empirical evidence about how organizations across the continuum from for-profit firms to nonprofit organizations used social innovation to respond to the 2008 economic recession. Results indicate that many organizations, across the range of legal structure, responded to the recession by increasing support to the environment, their local community, or their employees. Existing social practices positively influenced the decision to provide support, indicating a deepening of
across legal structure, and demonstrates how social innovation was used in reaction to increased need due to an economic shock.
The paper is organized as follows. The next section reviews the theory and literature regarding social innovation. Section three presents the research design with a review of North Carolina’s economy, the survey design, and empirical methods. Results are presented in section four. The final section concludes with discussion and implications of our finding, and suggestions for future research.
2.2 Defining Social Innovation: Existing Theory & Literature
Social innovation is an emerging field of research that lacks a conclusive definition and theoretical framework. While the practice is not new, the concept has grown in popularity in recent years as seen by President Obama’s creation of the Office of Social Innovation in 2009 and the increased presence of the topic in academic publications3 (Figure 2.1).
The burgeoning field has a spectrum of prior research that utilizes varying definitions and research methods. According to Stanford’s Center for Social Innovation (2009), social innovation “is a novel solution to a social problem that is more effective, efficient, sustainable, or just than present solutions and for which the value created accrues primarily to society as a whole rather than private individuals”. Much of the existing literature follows this definition and frames social innovation as an extension of innovation applied to social problems (Brozek, 2009; Dees, 2008; Martin & Osberg, 2007; Peredo & McLean, 2006; Reis & Clohesy, 2001). Related terms of social entrepreneurship and
social enterprise are also used in the literature to describe individuals and organizations that strive to
innovation and entrepreneurship literature, theoretical developments have been made by grounding the practice in institutional theories of social capital, organizational change, and legitimacy (Agrawal & Hockerts, 2013; Habisch & Adaui, 2013).
While much progress has been made in developing our understanding of social innovation, we are still limited in our knowledge of how social innovation is produced. Social innovation can be understood as the process of creating novel solutions to further a social good – it is innovation relating to the solution of a social problem (Mulgan, 2006; Pol & Ville, 2009). Thus there may be direct and indirect paths and as a result multiple motives that lead to its creation. When discussing production however, the literature focuses on social entrepreneurship as the only route to social innovation, thus ignoring other viable organizational pathways. Other literatures highlight
alternative ways that organizations provide for the public good without reference to their common goal of achieving social innovation.
Figure 2.2 presents the multiple paths to social innovation that existing literature has focused on separately. The most direct path is through organizations, whether they be for-profit, nonprofit, or a hybrid structure, that are created with the explicit aim to attempt to address a social problem. For example, TOMS Shoes is a for-profit entity with a business model that provides a pair of shoes to a person in need with every pair of fashion shoes purchased.
For-profits may also create social innovation through their social involvement, namely their corporate social responsibility practices. Corporate social responsibility (CSR) is the practice by for-profit firms to give back to their community through the provision of time, funding, or services. Reis and Clohesy (2001) find that female and young entrepreneurs as well as family-firms have the largest CSR profiles. Delevingne, (2009) finds that CSR is perceived to positively influence firm reputation, suggesting that firms may decide to expand their CSR programs in the wake of poor economic conditions. CSR’s affect on financial performance has been indeterminate, with the most rigorous studies finding no effect (Aupperle, Carroll, & Hatfield, 1985; McWilliams & Siegel, 2000). This may be due to the diversion of profits into social innovation, which is reflected in marketing strategies (Hess, Rogovsky, & Dunfee, 2002). However, CSR decisions could be treated as profit maximizing investments that increases revenue more than the associated costs for a firm
(McWilliams & Siegel, 2001).
These three alternative routes suggest that social innovation will not be limited to social enterprises but will span the range of organizational forms.
2.2.1 Innovation Out of Necessity: The Role of Economic Crisis
There is a more altruistic orientation that describes the rise of social innovation in the wake of an economic slump. As the economy slumps, firms may increase their philanthropy not just to garner more consumer support but also to sustain their community (Acs & Phillips, 2002). Our hypothesis is that organizations adopt new socially innovative practices in times of economic downturn, responding directly to greater need.
community-oriented practices. This is occurring not only because of connection to local communities, but also out of necessity. In these difficult economic times, having first mover
advantage and being the low cost producer are no longer sufficient strategies; thus, organizations are adopting a range of nontraditional practices, and offering a means to create viability in local
communities at a time of decreased government capacity. Recognizing the importance of their workforce and their local community context motivates organizational response.
The multiple sources of social innovation coupled with the potential influence of economic conditions prompts three research questions:
What types of organizations engage in socially innovative behavior and what role does legal structure play? Since
social innovation can come from any type of legal structure it is unclear if one type is more likely to create social innovation or more generally, attempt to create it.
What role does socially innovative behavior play in responding to a recession? As organizations are faced with
business decisions in response to economic downturn, is their business behavior motivated by their social behavior?
What role does socially innovative behavior play in providing increased social support in response to the recession? We
expect that those organizations that are more socially innovative would be more likely to increase social support when need is higher due to worsened economic conditions.
2.3 Research Design
To answer these questions, this study uses data from the 2012 North Carolina Social
While social innovation as a practice benefits from a business’ ability to create change and an entrepreneur’s innovative approaches, it is weakened by the difficulty of defining and measuring social success (Dees, 2008). Thus a primary challenge to studying social innovation is finding an appropriate measure of it. As discussed previously, existing methods of classifying socially
innovative organizations rely on legal structure or self-identification. Legal structure fails to capture socially innovative behavior that is occurring across multiple legal structures. Self-identifying terms are also a poor indicator as it assumes a universally accepted and known definition of the behavior. But there is no consensus on a common definition and the terms in use are not widely spread. These methods are biased and inefficient at classifying socially innovative organizations.
We, instead, proxy for social innovation by measuring an organization’s investment in social goals, captured by the practices they have in place. Practices in place identify common behavior across organizations that may or may not describe themselves as socially innovative and across legal structure. It captures what an organization is actually doing to work towards social progress as opposed to what they would like to do. By surveying a variety of practices we are able to categorize behavior into classes around how challenging and costly they are to implement and by their area in the business process, whether it be in production, delivery, or investment. This approach, of using existing practices, provides a more concrete perspective to social engagement and provides
perspective as to how organizations are operationalizing the concepts with which they may or may not identify.
2.3.1 Legal Structure and the Impact of the Recession in North Carolina
North Carolina, the 10th largest US state, has a population of approximately nine million residing in 85 rural and 15 urban counties. While currently growing, North Carolina’s economy is in a state of transition as it moves away from labor-intensive manufacturing industries to technology and service industries with manufacturing losing over 100,000 jobs in the state since 2007 (Bunn & Ramirez, 2011). Although North Carolina’s real GDP grew at a faster rate than the US from 2004 and 2009, the recession significantly damaged the state’s economy and as of 2011, the state’s median household income had declined to 84% of the US average, with high concentrations of wealth in the urban counties (Bunn & Ramirez, 2011). Further, the state unemployment rate rose from 5 to 11.2% between April 2008 and February 2009, with the poorest counties experiencing the highest peak of 13.3% in March 2010 (Bunn & Ramirez, 2011; Center on Poverty, Work and Opportunity, 2010).
Each state in the US is responsible for oversight of the legal structure of organizations within their boundaries. North Carolina has a common set of available legal structures for
organizations. Traditional for-profit business forms include the corporation and the Limited Liability Company (LLC) or Partnership (LLP). These structures can be used by social enterprises as they permit flexibility, allow for private investment, and are often viewed as more efficient than nonprofit forms. Corporations make profits their primary aim but can incorporate social benefits as a factor in long-term profitability calculations while LLCs and LLPs incorporate a social purpose into the operating agreement (Graddy-Reed et al., 2013). North Carolina organizations may also form as a for-profit entity with cooperative principles in place. These organizations consist of members who share in ownership and governance rights.
is available in some states and is a for-profit organization with a social mission that submits an annual report on their social impact (Foundation Center, n.d.-b).
The Low-Profit Limited Liability Corporation (L3C) is a hybrid legal form of a for-profit business structure with an explicit charitable mission. It became available in North Carolina in 2010 for organizations that met the statutory requirements to advance a social goal, with the creation of profits as not a significant goal, and no political or legislative purpose. This form enables for-profit organizations to receive financing from private philanthropic foundations that previously was only available to nonprofits. However, the North Carolina legislature repealed the L3C as an available legal structure effective January 2014. Meaning no new organizations could register as an L3C but existing organizations could remain as such (Graddy-Reed et al., 2013).
North Carolina allows for the formation of tax-exempt nonprofit corporations. These organizations exist solely for a social mission and allow financing in the form of donations and grants. Nonprofits can incorporate for-profit strategies to accomplish their mission as long as the business activity is significantly related to its social purpose (Graddy-Reed et al., 2013).
2.3.2 Survey Design
representative of organizations that survived the recession or were created after it; there is no information on the behavior of firms that failed as a result of the recession.
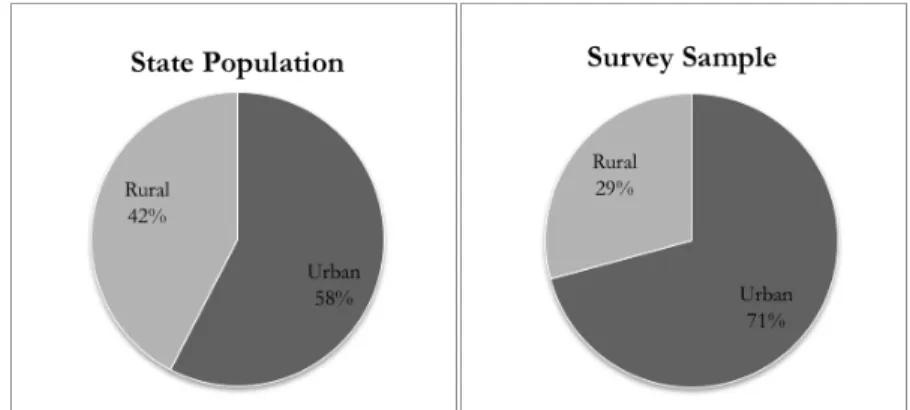
Seventy-one of the 100 counties are represented in the survey from across the state (Table 2.1). There is an oversampling of urban respondents, who account for 71% of the sample while accounting for 58% of establishments with employees in the state (Figure 2.3).
North Carolina’s Department of Commerce classifies each of the 100 counties in one of three economic distress tiers. Tier 1 is made up of the 40 most economically distressed counties, Tier 2 accounts for the middle 40 counties, and Tier 3 comprises the 20 least distressed. Counties are ranked annually based on their unemployment rate, median household income, population change, and property values in the previous year (Weisbecker, 2012). The designations are used in multiple state programs that provide tax credits to promote economic development (NC Department of Commerce, 2013). The 2013 classifications are used in this analysis because they were based on the 2012 economic conditions, the year of the survey. The survey sample’s distribution of economic distress tiers is similar to the state’s, however, Tier 2 establishments are somewhat underrepresented in the sample while Tier 3 organizations are overrepresented (Figure 2.4).
Of the 29 counties not represented in the survey, 20 are Tier 1 counties, or the most
economically distressed. Their absence may be tied to a lack of Internet access. Since the survey was only available online, many potential respondents were not able to respond. More than 15 percent of the state’s rural population lacks high-speed Internet access and all Tier 1 counties are rural, thus include areas without broadband coverage (NC Broadband, n.d.). This is a limitation in the results and of all internet-based surveys. It also limits the generalizability of the analysis of Tier 1
2.3.3 Sample & Descriptive Statistics
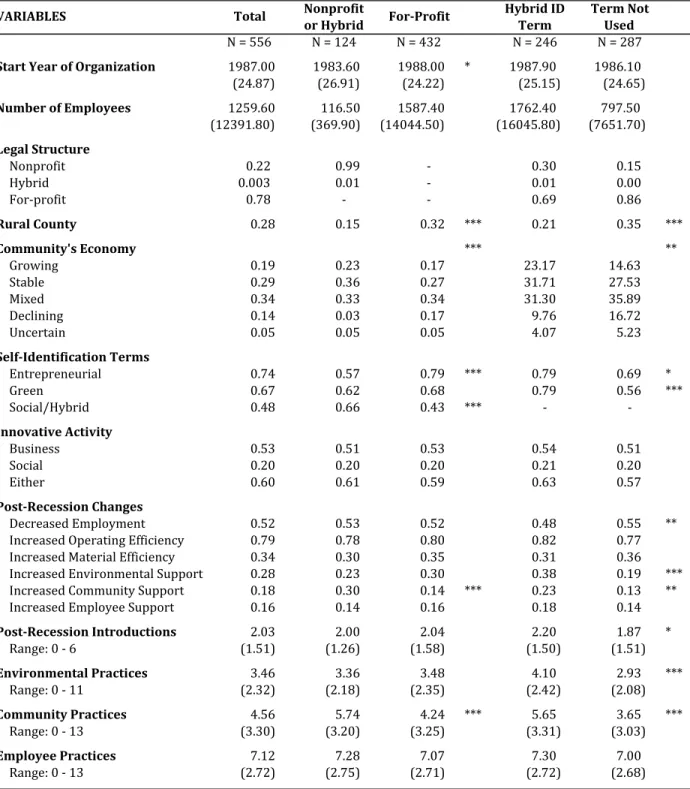
The sample for this analysis uses complete survey responses from organizations located in North Carolina counties, excluding government and quasi-government organizations. This produced a sample of 556 organizations. 4 Table 2.2 presents the descriptive statistics for the sample and by
sub-samples of legal structure and use of self-identifying terms.
Legal Structure
Legal structure historically identifies the types of practices and strategies an organization employs. However, these boundaries are blurring as nonprofits adopt profit strategies and for-profits become more socially involved. Survey respondents provided their legal structure. These values were categorized into three groups: For-profit, Nonprofit, and Hybrid. For-profit organizations consist of those that are not incorporated, operate as an LLC or LLP, or as an S or C corporation.
Nonprofit organizations consist of those that reported a 501(c)3, 501(c)4, 501(c)6, or other nonprofit
designation. Hybrid organizations are those with either an L3C or cooperative structure. As seen in Table 2.2, nonprofit or hybrid organizations were more likely to provide increased community support following the recession and have more community practices in place than for-profit organizations. However, for-profits provide similar levels of environmental and employee support and benefits. The similarities in many areas confirm that legal structure is not a clean indicator of socially engaged organizations.
Terminology
Respondents were asked to self-identify, using multiple classifying terms including
social enterprise. These were grouped by type as Entrepreneurial, Green (containing green enterprise and
environmentally responsible), or Social/Hybrid (containing hybrid, for benefit, fourth sector, triple bottom line, and
social enterprise). Because there is no well-accepted definition of social innovation, the use of a
definitive term is not an appropriate means of identifying socially innovative organizations. However, many do use terms that imply a social mission appropriately. Within this sample, those that used a social term of identification were significantly more likely to have increased environmental and community support in response to the recession, and have more environmental and community practices in place. It is important to note that those using social terms were also more likely to be in an urban county. This may mean that such terms are not geographically widespread in their use, another signal that they should not be used as the sole means of identification.
Innovation
Innovation is a process rather than simply an outcome. In order to innovate, firms must by definition try new things. Trying something new is risky and thus susceptible to failure. By asking firms about practices they have tried and their subsequent failures, there is an understanding of the risks they are taking and thus their efforts to innovate. Respondents were asked about failed or incomplete projects and socially engaged practices to capture this risk-taking behavior and innovative process. Both risk types and the combination of either attempt are fairly evenly
distributed across respondents both by legal structure and self-identifying terminology, confirming that these distinctions do not serve as accurate measures to capture social innovation.
Responses to the Recession
products and methods, organizations were asked if following the recession they introduced new or improved: goods, services, methods of manufacturing or production, support processes, marketing methods, or methods of logistics, delivery, or distribution. The count of these responses creates the
Recession Introductions variable, ranging from zero to six with a mean of 2.03 introductions. Twenty
percent of survey respondents reported no new or improved introductions and approximately 27% reported one introduction. The most frequent response was introducing a new or improved service with roughly 40% of respondents followed with 37% reporting new or improved marketing
methods.
Respondents were also asked if in response to the recession, their organization changed certain business and social practices. This included changes to decrease costs by: decreasing employment, increasing operating efficiency, and increasing material efficiency. Over half of respondents reported decreasing employment in response to the recession. The question also included options related to social involvement of: increasing environmentally sustainable practices, increasing assistance to the local community, and increasing assistance to employees. Environmental practices had the highest response of this set with 28% reporting increases. Only 16% of
respondents indicated they increased support to their employees.
Scales of Social Engagement
Respondents were also asked about their engagement with a series of social practices – 11 environmental, 13 community, and 13 employee. Appendix Table 2.1 lists each of these practices, their frequency, and differences by legal structure and use of self-identifying terms. Figure 2.5 presents the quartile distribution of all practices by legal structure. Although there are heavier tails in either direction for each structure, both are well represented across the distribution again signaling that legal structure does not alone capture the social motivations of an organization
These practices were combined to form three series of scales. These scales proxy for socially innovative activity by capturing an organization’s investment in social goals – how involved they are in achieving a social good based on the practices they are actually engaged in. The first series of scales are grouped around the focus area of practices. They are count scales of the number of environmental, community, and employee practices an organization has in place. These scales do not capture how valuable or innovative any one practice is but instead captures the breadth of support an organization has in either the environment, their community, or their employees with the premise that organization’s with a higher number of practices are more socially engaged and devoted to meeting a social mission.
The second series of scales was created by dividing the former by type of practices.
Environmental practices were divided into two categories of basic (recycle, conserve water, and save energy) or advanced (track emissions, produce renewable energy, etc.) practices. Community
practices were divided into three categories of production related (local suppliers, suppliers with good practices, etc.), donation-based (company service day, donate use of facilities, etc.), and outreach activities (support K-12 education, promote economic equality). Employee practices were divided into two categories of benefits (retirement contributions, health insurance, etc.) and
practices by focus and attempt to capture the value of practices as they relate to solving social problems.
The third series of scales groups these more detailed scales across focus area to capture a more fluid picture of social engagement. This consists of three scales: basic, production, and investment. The basic scale includes the employee benefits and basic environmental practices. These are practices that are important at an individual level but do not directly work to solve a large social problem and are well spread across organizations. The production scale includes the advanced environmental and production-related community practices. These practices likely provide personal advantages and benefits to the organization but also contribute to meeting larger social goals. Finally, the investment scale includes the community donation, community activities, and employee investment practices. These practices may also provide some benefit to the organization but are significantly contributing to a social mission – they are practices that signal a desire to improve a community through innovative strategies.
2.3.4 Methods
bins of: Very small (two to four employees), Small (five to 15), Medium (16 to 85), Large (86 to 500),
and Extra Large (over 500 employees).
Organizational Traits in Socially Innovative Practices
Given the challenges in identifying socially innovative organizations it is unknown what types of organizations are engaged in this behavior. The scales of social engagement are used here as a proxy for social innovation as they capture the breadth of investment an organization makes towards a social aim. The organizational factors are then examined that influence the number of practices an organization has incorporated. Equation 2.1 regresses the number of practices an organization has in place on legal structure and other organizational traits.
log (!"#$%& !"#$#%&%"' !"#$%) =!+ !!!"+!!!"#+!!! 2.1
The key independent variable of interest is the legal structure of the organization. Legal structure is included as a categorical variable with binary indicators for nonprofit (NP) and hybrid (Hyb) with for-profits as the referent group. Additional covariates (Z) included are the types of
self-identification terms used by an organization (entrepreneurial,social/hybrid, and green), age of
organization, size by number of employees, location in an economic distress tier, and presence of innovative behavior.
This model evaluates the importance of organizational traits across multiple scales including the count scale of all social practices in place, the combination of employee and community
practices, and then the three grouped scales of investment, production, and basic practices. This will help establish if certain traits are more important to certain types of social involvement.
likelihood ratio test. The Poisson model was used for the production and basic practices scales but rejected for the combination scales and investment scale, resulting in the use of a negative binomial model.
Responding to the Recession: Introduction of New Products & Methods
The differing social scales are then used as explanatory variables in assessing the response to the recession made by organizations. Were more engaged organizations more likely to be proactive in their business response to the recession? Equation 2.2 addresses this question by regressing the business response of an organization on their scale of practices, legal structure, and other
organizational demographics.
log (!"#$%& !" !"#"$$%&' !!"#$%&'"($!)) =!+!!!"#$%+ !!!"+!!!"#+!!! 2.2
The outcome variable used is the number of introductions made in response to the recession. As discussed above this is a count ranging from zero to six and includes the introduction of new or improved goods, services, logistics, processes, marketing, or manufacturing methods. This captures how diversified organizations were in responding to the economic downturn.
The key independent variable is the scale of social engagement. Three models are run using different types of scales. The first uses the simple count scales by type of practice – environmental, community, and employee. The second utilizes the three grouped scales of investment, production, and basic practices. The third uses the detailed scales of basic and advanced environmental,
production, donation, and activity in the community, and employee benefits and investment. Legal structure is also included as a categorical variable with nonprofit and hybrid structures in reference to for-profits, as it was in the modeling of social innovation (Equation 2.1). It is
organization (entrepreneurial,social/hybrid, and green), age of the organization, number of employees, location in an economic distress tier, and presence of innovative behavior.
Due to the count nature of the outcome, both a negative binomial and Poisson model were fitted. However with each case, the Poisson was rejected through the goodness of fit and likelihood ratio tests resulting in the use of the negative binomial model.
Responding to the Recession: Increasing Social Support
Finally, the social scales are used to examine what types of organizations responded to the increased need from the recession with increased social support. Equation 2.3 regresses the decision to increase any type of social support (environmental, community, or employee) on a series of organizational characteristics and demographics (Z) and the scales of practices in place.
log !"#$%&'%( !"#$%& !"##$%& =!+!!!"#$%&+ !!! 2.3
The key independent variables are the individual social scales by either general type (environmental, community, and employee) or detailed type (basic and advanced environmental, production,
donation, and activity in the community, and employee benefits and investment). Control variables include whether the organization is a for-profit or not, the age of the organization, number of employees, economic distress tier of their county, the types of self-identification terms used by an organization (entrepreneurial,social/hybrid, and green), and the presence of innovative behavior. There is, however, the potential for endogeneity between responsiveness to increased need and the number of social practices currently in place. To obviate this concern, additional models were run by each type of social support (environmental, community, and employee) while omitting the
log !"# !"#$%&"'(")*+ !"##$%& =!+!!!"#$%&'()+ !!!"#$%&'()+ !!! 2.4
log !"# !!""#$%&' !"##$%& = !+!!!"#$%&'()+ !!!"#$%&'()+ !!! 2.5
log !"# !"#$%&'' !"##$%& = !+!!!"#$%&'()+ !!!"#$%&'()+ !!! 2.6
Due to their binary outcome values, these equations were fitted with logit models to examine what factors influence an organization’s decision to increase social support in response to the recession.
2.4 Results
Empirical results are presented in Tables 2.3, 2.4 and 2.5, which are discussed in turn.
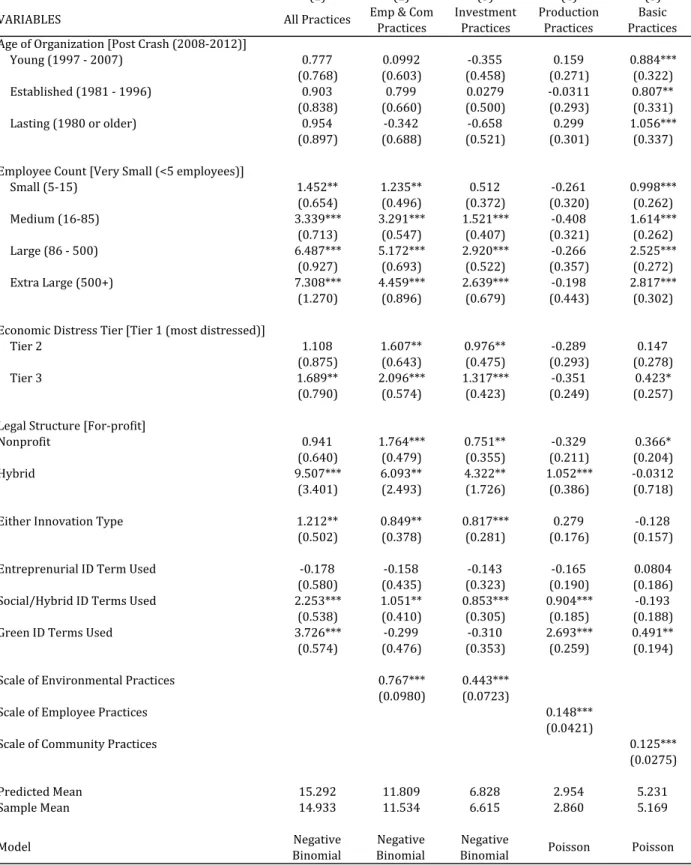
2.4.1 Organizational Traits in Socially Innovative Practices
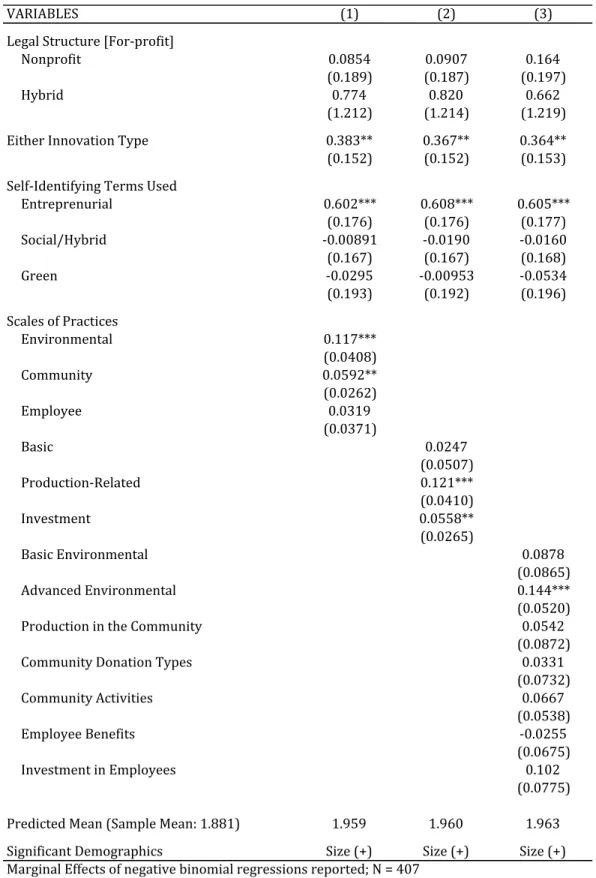
Table 2.3 presents the marginal effects resulting from Equation 2.1 evaluated at the various scales of social practices. The estimations’ predicted means slightly overestimate the real sample means but are very similar. The importance of organizational traits vary by scale.
Looking first at model 5, basic practices, we see that age and size most impact the number of practices in place. These practices are widespread across organizations and in high frequency and thus least likely to be an indicator for socially innovative organizations. The results show no significant effect from innovation or using entrepreneurial or hybrid terminology. Further, legal structure has only a small effect with nonprofits providing a third of a practice more on average than similar for-profit organizations.
practice, on average. Being a larger organization or in a less economically distressed area are also positive and significant indicators of investment practices.
Model 2 uses the count of employee and community practices in total - this includes the investment practices but also practices less likely to be associated with social innovation. Results show similar but larger effects than in model 3. Isolating the production related practices in model 4 that may lead to social aims but also benefit the organization so much weaker effects than model 3.
These results indicate that legal structure and terminology are indicators of social behavior and they are positively associated with the use of practices more strongly linked to social innovation (model 3). This effect indicates that those that select a hybrid legal structure are doing so
appropriately as they have a policy significant number of more practices in place, as compared to for-profits. There is less of an obvious distinction between nonprofits and for-profits with an average difference of less than one practice. This indicates that these traditional legal structures are not a good indicator of one being inherently more socially innovative.
Use of a social term is a positive but not a strong indicator of social innovation with having almost one more practice on average than those that did not use a social term. This confirms that using self-identification, as a means of classifying socially innovative organizations, is not a good policy. This may be because there are not set definitions of the terms and that the terms are not widespread. Overall, hybrid legal structure is the strongest predictor of investment related practices, signifying the importance of these alternative structures in promoting social innovation.
2.4.2 Responding to the Recession: Introduction of New Products & Methods
Self-identifying as entrepreneurial had a consistent positive and significant effect of 0.6 additional introductions following the recession. Innovation had a smaller but still consistent positive and significant effect of 0.4 additional introductions on average. However, legal structure failed to have a significant effect on introductions as did an organization’s age and location.
In model 1, the general count of environmental and community practices are positively associated with introductions. In model 2, these elements are highlighted again with production-related and investment practices being significant. When broken down by detailed type in model 3, only advanced environmental practices are significant with 0.14 more introductions on average. Given the predicted average of 1.96 practices, this represents approximately a 7.3% change in the average outcome. Though significant this is a much smaller indicator than self-identifying as entrepreneurial which represented a 30.6% change from the fitted average. The results indicate that organizations with advanced environmental practices are slightly more likely to respond to the recession with more business changes but the overall minimal effect of socially innovative practices indicates that they are not a strong driver of business-related introductions post recession.
2.4.3 Responding to the Recession: Increasing Social Support
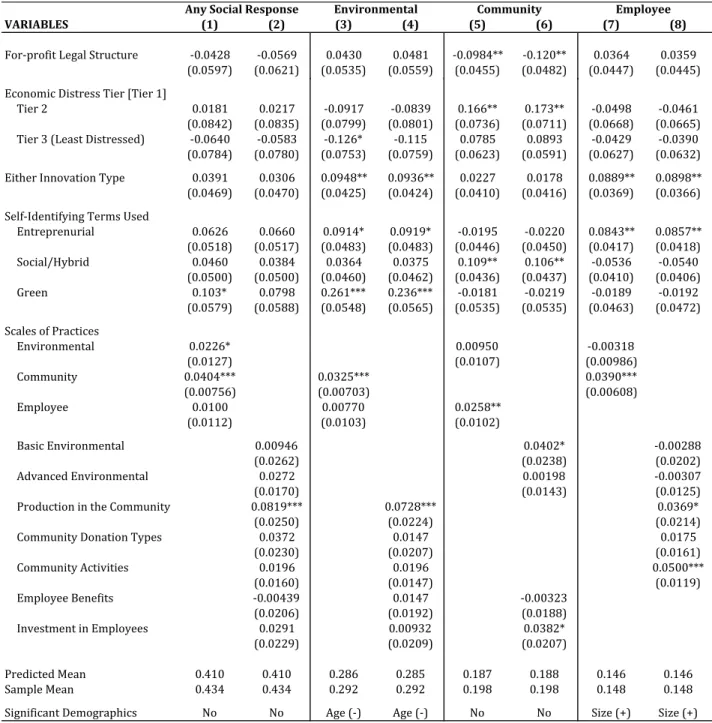
Table 2.5 presents the marginal effects from the logistic regressions used to analyze the response of increased social support. Models 1 and 2 on any social support produced a similar fitted average to the sample mean of of 0.41 as compared to the sample mean of 0.43. Models 3 and 4 run similar models for environmental support only, while models 5 and 6 examine the effects on
community support, and models 7 and 8 on employee support; all with similar predicted means to their sample means.
average, respectively. Increased employee practices are positively and significantly associated with increased community support but not environmental. These results hold with the detailed scales with production-related community practices, community activities, and investment in employees positively affecting additional social support. Increased investment in employees, practices that are associated with social innovation, is associated with a 3.8 percentage point increase on average in the probability of providing additional community support in response to the recession. Similarly, increased community activities, practices also associated with social innovation, are associated with an increase of 5.0 percentage points in the probability of providing employee support. These results indicate that socially innovative practices are small indicators of providing additional social support following an increase in need.
Innovative activity and self-identification as entrepreneurial are stronger indicators of increasing employee support with an average increase in probability of approximately 9 percentage points. Use of a social or hybrid identification term is associated with roughly a 10 percentage point increase in the probability of providing community support. Community support was the only type for which legal structure matters – being a for-profit decreases the probability of providing
community support by approximately 10 to 12 percentage points, on average. Being in a Tier 2 as opposed to Tier 1 county increased the probability of providing community support by
2.5 Discussion
Organizations have begun to adopt a range of socially engaged practices in an attempt to create viability in local communities at a time of decreased government capacity. In an effort to determine identification of socially innovative organizations, this analysis highlights the importance of hybrid legal structures. Though the L3C is no longer available in the state of North Carolina, organizations that incorporated as L3Cs and as cooperatives did so appropriately – they self-selected into a legal structure that allowed for their high level of social engagement. The results suggest that this tax status encourages greater involvement from organizations in the provision of public goods and provides support for the value of having this option. Given the low cost to states to implement hybrid legal structures that do not decrease tax revenue North Carolina should reconsider their policy regarding the L3C. This analysis also provides support for the introduction of the L3C as a means of fostering social involvement from private organizations in other US states, where debate is underway on whether to adopt the structure.
In considering responses to the recession, many organizations introduced new or improved products and methods to survive the economic downturn. Organizations that did so were more likely to be innovative and have advanced environmental practices. Legal structure did not provide a means of identifying these organizations, nor did age or location. This implies that organizations across type and place were proactive responders to the recession.
In terms of social support, many organizations increased their support to sustaining the environment, their local community, or their employees in response to the recession. Organizations with more socially innovative practices were more likely to increase social support. When the recession increased need for such support, many organizations working towards social goals responded by increasing support to their employees and communities. With global concern over government’s ability to provide or sustain public good provision, private organizations are becoming more valuable in their service to their communities. Encouraging this social involvement and focus in organizations may then increase support to the public at the crucial time of an economic
downturn.
The 2012 North Carolina Social Innovation Survey has some limitations. Since it was
evaluate the response to a recession through social practices while controlling for the political, economic, and cultural atmospheres of a state.
More research is needed from a larger sample that crosses over state boundaries. This will allow the results to be vetted in multiple geographies to examine if different states inherently
respond differently to crises. Also, a follow-up study should be done within North Carolina to see if the introductions and increased social support in response to the recession had lasting affects for the organizations and if these efforts improved their surrounding economy.
This paper examines the difficulty in identifying socially innovative organizations as their behavior crosses legal boundaries, self-identification, and organizational characteristics and puts forth a classification method that utilizes how organizations operationalize their social mission. Knowing the extent to which organizations are incorporating practices provides a means of accurately identifying the more socially engaged organizations. These more engaged organizations were more pro-active in responding to the economic recession by providing needed support to their employees and communities. This paper contributes to the literature on social innovation by
Figures
Figure 2.1: Frequency of “Social Innovation” and related terms in academic publications
Source: Scopus Database
Figure 2.2: Sources of Social Innovation
!"#$%&'( )*+',-./$+0("1(.(
2"3$./(455/$3.%"-( 627(!,.3%3'#(
8",95,":+( 2"3$./( ;-&"/&'<'-+( 8",95,":+(
;--"&.%"-(
2"3$./( ;--"&.%"-( 8",95,":+#=( >0?,$@#=(A( B"-5,":+#(C$+D(
Figure 2.3: Comparison of State and Sample Rural-Urban Distributions of Establishments with Employees
Source: NC Employment Security Commission 2011 via the Rural Center Data Bank
Figure 2.4: Comparison of State and Sample Economic Distress Tier Distributions of Establishments with Employees
Source: NC Employment Security Commission 2011 via the Rural Center Data Bank
Figure 2.5: Quartile Distribution of All Social Practices by Legal Structure
!!"#
!$"#
%&"#
'("#
!)"# '*"#