Review Article – Electrical Engineering
Power Quality Analysis by the Ripple Technique
Amam Hossain Bagdadee
Research Fellow, Asian Institute of Technology, Klong Luang, Pathumthani 12120, Thailand
Abstract
Characteristic of Power quality has been with us since the inception of the electrical Power system. However, the topic of power quality has attracted particular attention in recent years due to the increase of electronically controlled. Power quality problems caused disruptions to electrical or electronic equipment and the resulting consequences are very expensive. Ripple techniques will be studied in this paper for analyzing power quality monitoring. In the case study based on the measurement of the site of the Asian Institute of Technology (AIT) and it was examined using the proposed ripple technique.
Key words:Power Quality, AIT, Monitoring, Ripple Technique
Introduction
The development of the microprocessor in a variety of electronic devices has increased the vulnerability of these devices to resolve quality control problems. These issues cover a wide range of electrical inter-ference that may arise or occur in various locations in the network and its effects on various types of vital forces. As a result of this weakness electric utilities and electricity are becoming increasingly concerned about the quality of electric power.
Recent advances in signal analysis have led to the development of new methods for expansion and to identify power quality problems. Most of the work has done in the field of power quality on these issues both from the detection and localization of view or from the compressed data. Ripple decomposition technique is a powerful tool that can be used to help assess the quality problems. In this article we will discuss some of the techniques and wave power quality phenomena. Power Quality Problems
It is necessary to review common power quality problems are briefly defined in the sequel [1].
• Transients mean of changes in the variables that were lost during the transition from steady state operating condition to another and they can be classified as either temporarily banned and flourished.
• Short duration voltage changes caused by a fault condition and energization large loads at high starting currents involved. The mistake may cause a decline, '' rising 'and' void in the supply voltage, also known as SAG, swelling and disruption respectively. Classification and identification of the voltage is controlled by the IEEE 1159 standard and ANSI/IEEE-446-1987. This is known as the power curve CBEMA accepted.
• Sag was reduced to 0.1 ~ 0.9pu the root mean square (RMS) voltage, current, frequency or size line for a period of 0.5 minutes over a voltage drop caused by the offense. Through energisation is a normal weight and starting large motors. • The swelling is usually defined as the increase
in the size of the one-minute frequency voltage of 1.1 ~ 0.5 or around 1.8pu RMS current system-related offenses. But they are not very common for an electric voltage.
• Interruption when low voltage and current load than 0.1pu occurs in a period not exceeding one minute. Interrupt fault electrical system and it http://www.phoenixpub.org/journals/index.php/jaar
ISSN 2519-9412 / © 2017 Phoenix Research Publishers
Received: 29-04-2017; Accepted 05-07-2017; Published Online 08-07-2017
٭Corresponding Author
gives be caused by failure of equipment failure and control.
• Voltage over a long period encompasses RMS deviation frequency energy than a minute. Formed over a long period can be either high voltage or fall.
• Voltage imbalance means the maximum percent deviation from the average value of the three-phase voltage or current divided by the average of the three-phase. Voltage or current
• Waveform distortion, as the deviation from the
ideal frequency characteristic of the steady-state sine wave of the main contents of the spectral deviation DC, is defined harmonics offset. Fourth is key to cutting out the noise and waveform distortion.
• Frequency deviation is as power system
fundamental frequency of the nominal value being the description. Time required according to the response of the version control system in the frequency and magnitude of load and load changes.
• Envelopes voltage or a series of changes to
system voltage fluctuations are random changes in the voltage of typically less than the voltage specified by ANSI C84.1 - 1982 to 1.13 years. 0.9 PU ago.
State of Art about Power Quality Researches In recent years, the power quality issues, has become a research topic of interest to many researchers. Some of these studies have been registered for the entire selection and the paper [2-9].
Niagara Mohawk Power Corporation (NMPC)
Mid-1989, Niagara Mohawk Power Corporation that has supported important energy of 2 high-quality feeder and distributor education of Buffalo, the region of New York, has been justified in the study [2]. Most of the problem, it is actually caused by the customer's own equipment.
National Power Laboratory (NPL)
In 1990, the bad debt from the five-year exploration phase noise of electric mode [3] Data were collected from 300 sites within the continental United States and Canada. The site also includes a place where participants feel as though they have
power quality problems and where no problems were seen. The research found that the capacitor utility change event may be noted that most of the check. But size is not usually the most intense peak voltage of these places.
Electric Power Research Institute (ERPI)
In 1990 (the RP3098 1) Electrotek Corporation and Electric Power Research Institute (EPRI) contract in order to carry out a survey of the quality of the power distribution company. States enter [4] As a result of these studies, a common type of error that has been detected by a power disturbance, indicating that it is an interruption of voltage transient one harmonic distortion temporary. Ripple Transforms Techniques
Power quality problems are characterized by a wide spectrum of their highest peak RMS voltage; frequency statistics of the ripple transform coefficients immediately. The voltage drop is the number of notches duration of a temporary nature, etc. These are features unique to identify power quality problems are different [12-19] and introduce signal processing tools to analyze power quality. (The DWT) is a basic tool for analyzing ripple signal time series. It shows the frequency of the signal quality was recorded with time. It is possible to be translated in time series analysis component of the spectrum, this feature is very attractive. For example, methods such as Fourier analysis are based on the idea of a solid basis so that it can be adapted to a great classical method of signal processing. More stable power quality features, research, Fourier transform DWT more appropriate application of the necessary [20].
If we identify f is a different objective in line for virtually all her appointed role properly ripple
ψ, F may be delayed.
One problem of the DWT is that it does not change at a constant. This solution for recovering invariance is, WAVE, meaning that redundant or destruction exchange DWT classic Aurous al [20] signal DWT of translation means that not of DWT signal. Algorithm [21] [22] can be used in order to achieve such a dynamic change and redundancy.
We are the basic idea behind this algorithm, do a brief introduction on how to run the [21, 22] conversion Aurous is similar to the classic DWT exception. The main purpose of the massacre there is no killing of non-stage, was to collect and store a minimum of data necessary to allow for the restoration of a particular input. To ignore the massacre it also has a large storage capacity.
C0 dataset (k) is a signal of the resolution or
the first signal C1 (k) is subsequently, CN (k) is
passed through the low-pass filter H1 which will
obtain the time series. N number of filtering shown:
This is achieved using the subsequent equation is as:
wj(k)= c j−1(k) − c j(k) …3
This algorithm makes it easy to create c0k original signal is as:
Quality of Power C0 (k) is, hl, C1 acquires
by passing through the low-pass filter and GL (k) and Wj (k) is not passed through a high pass filter to generate a CN (k) and W (k) you. Through the time- series are decomposition filter N times of the pair.
Equation (2) and (5) can be used to create the original signal. The only difference is the filter regeneration hl and gl will be used instead.
Case Study-Monitoring Power Quality of Energy Building at the Asian Institute of Technology (AIT)
Several AIT Laboratories host in The Energy building. Power plant located 14 miles from the substation transformer 1500 kVA rated was. Energy building review process is carried out at the plant for 32 days (28/08/14 to 09/28/14) block diagram in Figure 1 show. That the electrical connection and the point of common coupling (PCC) of the node PQ.
Figure1. Block Diagram of Energy Building (AIT)
Building of energy department has been experiencing a lot of temporary interference because of interference from impeding the AC voltage waveform. Switch capacitor does not resolve the problem, and therefore the opportunity for a comprehensive power quality monitoring with no recorded data.
Transients’ analysis
Figure 2. Low frequency
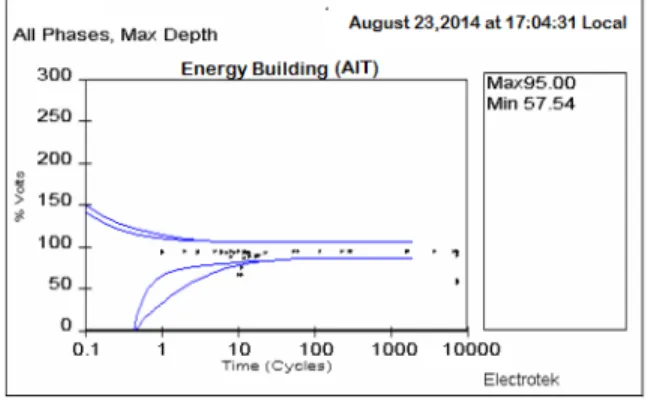
Short/long duration variations
The energy Department of the building to experience a voltage of 69 devices, many of swelling voltage is not found to be sufficiently low magnitude of only 8 options of voltage during the period of investigation from the voltage of the 69 recording devices Hmm. Then, in a long period of time, it will be classified as curve CBEMA-See Figure 3.
Figure 3. CBEMA curve
Eight voltage sag which is located outside of the nearly curve tolerance CBEMA was mainly observed during the night. These can be linked to a system crash.
Phase imbalance
Creating a current trend Energy building sites have unusual distinction Phase A and B, and it was shown that the neutral line is in progress between the current 20A80A - with reference to Figure 4 please
The observed abnormal waveform current trend is unbalanced voltage all three phases are calculated to indicate that an equilibrium,
respectively, and give the result of an imbalance of neutral phase A and B. 1.8% maximum deviation and despite phase C of, have a less than 1% of the deviation, the voltage phase anyone of 2% in the threshold deviation remained at 2% of these plots, they have to It has been proven that you are balance.
Figure 4. The RMS Current in real condition
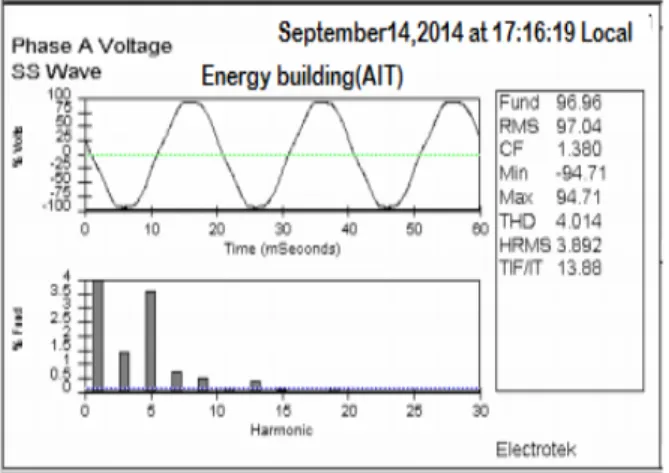
Analyze the waveform distortion
C is more than 5% of the specified threshold set by 2279 AS Asian Standard, especially phase, creating a site power at high total harmonic distortion (THD) levels - Part 2 However, repeat remaining A and B THD. 1.5% to 3.5%, a strange combination of harmonic, since it is clear that more than 5% of only once in step C, the range within the components of the strange THD to be in the ninth; to adjust the combination in the course has been exceeded once harmonic strange 4%, all of the phase B, fig 6has remained in a 4% showing a waveform stability of the state in the process. There is a slight increase. Harmonic distortion that has been observed in Energy building and lighting and personal computer applications was the mail cause.
Figure 6. Steady-state waveform
Energy building site appears to be a continuous waveform to increase the power supply noise. 00 and evening between 17: 00-08: 00-06: This noise, between the generally 06, is a combination of the mess 00 study radio frequency signal superimposed on the signal seen in the morning shows It has been Noise, etc. (of 50 Hz) noise. Future Investigation with Ripple Techniques
Probably as a result of lightning, see reference 11- have been temporarily banned the use of the ripple decomposition when monitoring construction sites of the Energy building. As shown in Fig. 7 events were identified by high noise ripple coefficients signal interference electrical smaller coefficient has been shown to be random. The examination of the impulse disturbance is low because the ripple analysis is the most translated, which makes converting your interrupt WAVE most severe that the only level 1 and 2. Coefficient of the high level of display size and first and second voltage 39 milliseconds will rise to the destruction of his maximum half in a short period of time in terms of value in microseconds observed a polarization of the incident. Temporary impulses that apparently there is a rapid change in the voltage stability of the state are the one that shows what happened.
Wave technique is applied to the measurement data from the Energy building sites. The aim of the ripple technique is to identify power quality problems recorded on the site of the power plant will not be shown clearly on the nodes along. Ripple analysis results are obtained in the sequel.
Figure 7.
Impulse disturbance detection
Multi resolution analysis of transient
However, when using the ripple decomposition there, the number of low-frequency temporal oscillations have been observed - will follow up the 20 fast interference fluctuations in milliseconds as shown in Fig. 8 noise 12, and. Noise, vibration immediately after the specified 20 milliseconds. Voltage drops in the power system. This event is observed at 3 on a scale decomposition 2, 3 and 4 and 12 of the scale, rapid change of frequency, it is easy to identify that is not a steady state voltage occurred. It includes positive and negative. Quickly this observation to the polarity change is, we suggest a temporary thing the detection of low-frequency vibration.
Multi resolution analysis of voltage sag
During the period of monitoring the Energy building site had experienced an 8-voltage drop and no-voltage swell. Figure9, using a ripple of Daubechies and showed the waveform of fault detection.
Figure 9. Voltage sag d, (a) 22:35:29 (b) 22:35:30 Figure 9(a), we noted that many of the coefficients slightly compared to the absolute highest levels consistent basis. These coefficients during high vibration that occurs in 30 milliseconds showed a drop in voltage. However, due to the high value WTCs stated in the third occurred in Figure 9(b) in 30 milliseconds, they show that the pressure returned to normal levels. This is shown clearly on the event, the voltage drop observed during the inspection.
Multi resolution analysis of harmonic distortion
The site of Energy building has experienced a high level of total harmonic distortion (THD) Figure 6-4 (a) shows the differences in level and THD waveforms think 6-4 (b) shows up different waveforms low THD.
In Figure 10, we find that the coefficients repeat it all around. These values are listed in different levels of distortion harmonic notes Figure 10 (a) with a coefficient higher value stated in the form of a wave than (b) means. THD levels that is higher in (a) than (b) This has been confirmed by the power quality problems in energy Building.
Figure10. Harmonic distortion detection
a) Higher and b) Lower level
Correlation of results and findings
The number of ripple multi-resolution decomposition detection and localization done in the power quality problems through the use of technology is power quality problems that were found in the energy construction site of the Energy building within the site, Monday, Tuesday and Saturday, and a high order to for the rest of the week it was implied that there was relatively low. In comparison with the PQ node, ripple technology has put a high emphasis on the general study of the various disturbances instead of transient events. Information from the collection by using the Energy building ripple technology, clearly, was to classify the type of power quality fault to be found in this power system. The collected information, except for temporary disturbance power quality, has suggested that a relatively clean in energy building.
Conclusion
been recorded by node PQ in the Asian Institute of Technology (AIT) study, otherwise alone may not have been identified PQNode. It shows the capability of the ripple method decomposition to identify power quality problems.
References
[1] R.C. Dougan, M.F. McGranaghan and H.W. Beaty, Electrical Power System Quality,
McGraw-Hill, USA, 1996.
[2] P.P. Barker et al. Power Quality Monitoring of
A Distribution System,” IEEE Transactions
On Power Delivery, 9(2): 1994, 1136-1142.
[3] D.S. Dorr et al. Interpreting Recent Power
Quality Surveys to Define the Electrical Environment. IEEE Transactions on Industry
Applications, 6(6): 1997, 1480-1487.
[4] E.W. Gunther and H. Mehta, A Survey of Distribution System Power Quality – Preliminary Results, IEEE Transactions on Power Delivery,
10(1), 1993.
[5] D.D. Sabin, T.E. Grebe, and A. Sundaram, RMS Voltage Variation Statistical Analysis For A Survey of Distribution System Power Quality Performance, IEEE Power Engineering Society: 1999 Winter meeting: 31 Jan-4 Feb,
1999, New York City, New York, USA/IEEE
Power Engineering Society, IEEE, Piscataway,
New Jersey, USA, 1999, Vol. 2, pp. 1235-1240. [6] Electrical Power Systems Quality, Internet
Home Page, http://www.electrotek.com, (current April 9th, 2001)
[7] IEEE Recommended Practice for Monitoring Electric Power Quality (IEEE 1159-1995) http://www.pqnet.electrok.com/pqnet/main/b ackgrnd/terms/paper/t able.htm(current April 18th, 2001)
[8] SEQEB System Investigation Department;
Supply and Demand: A Guide for Commerce
and Industry, 1st Edition, August 1994.
[9] IEEE Standard 446-1987, IEEE Recommended
Practice for Emergency and Standby Power
System for Industrial and Commercial
Applications (IEEE Orange Book).
[10] BMI, User Guide, and PASS graphical software for the PQ Node.
[11] Basic Measuring Instruments (BMI), Hand
Book of Power Signatures, 2nd Edition,
Revised and Expanded, Basic Measuring Instruments, 1993.
[12] A.M. Gaouda et al. Power Quality Detection
and classification Using Ripple-Multi-resolution Signal Decomposition, IEEETransactions on
Power Delivery, 14(4) 1999, 1469-1475.
[13] W.M. Grady et al. Power Quality Assessment
via Ripple Transform Analysis, IEEE
Transactions on Power Delivery, 11(2) 1996,
924-930.
[14] O. Poisson, P. Rioual and M. Meunier, New Signal Processing Tools Applied to Power Quality Analysis, IEEE Transactions On
Power Delivery, 14(2), 1999, 561-566.
[15] S. Santoso, E.J. Powers and W.M. Grady, Electrical Power Quality Disturbance Detection using Ripple Transform Analysis, in Proceedings
of the IEEE-SP International Symposium on
Time-Frequency and Time-scale Analysis,
Philadephia, PA, 1994, 166-169.
[16] W.M. Grady et al. Characterization of
Distribution Power Quality Events with Fourier and Ripple Transforms, IEEE
Transactions on Power Delivery, 15(1),
2000, 247-254.
[17] S. Mallat, A Theory for Multiresolution Signal Decomposition: The Ripple Representation,
IEEE Transactions on Pattern Analysis and
Mach. Intel., 11, 1989, 674-693.
[18] S. Santoso, E.J. Powers and W.M. Grady, Ripple-based Power Quality Event Identification System, Part 1The Ripple Transform and Feature Extraction of Power Quality Disturbances and Part 2: Design and Implementation,” ERPI Report, August 1997.
[19] J. Wu and T.K. Saha, Simulation of Power Quality Problems on A University Distribution System, 2000 Power Engineering Society Summer Meeting: Conference proceedings:
16-20 July 2000, Seattle, Washington, USA/
sponsored by Power EngineeringSociety and
Institute of Electrical and Electronics
Engineers, m IEEE, Piscataway, New Jersey,
[20] G. Beylkin and N. Satio, Ripples, their autocorrelation functions and multiresolution representation of signals, IEEE Trans. Signal
Processing, Vol. 7, 1997, pp.147-164.
[21] Ripple Toolbox User’s Guide, The MATH WORKS Inc., version 2, September 2000. [22] G. Zheng et al. The Ripple Transform for
Filtering Financial Data Streams, Journal
of Computational Intelligence in Finance,
Vol. 7, No. 3, May/June 1999.
[23] A. Aussem, J. Campbell and F. Murtagh, Ripple-Based Feature Extraction and Decomposition Strategies For Financial Forecasting, Journal of Computational
Intelligence in Finance, Vol. 6, No.3, 1999,
pp.5-12, March/April
[24] D.B. Percival and A.T. Walden, Discrete Ripple Transform, Ripple Methods for Time
Series Analysis, Cambridge University Press,