DETECTING MOVEMENT ERRORS IN CHRONIC ANKLE INSTABILITY PATIENTS: COMPARING FUSIONETICS TO THE LESS
Julie Elizabeth Harriss
A thesis defense submitted to the faculty of the University of North Carolina at Chapel Hill in partial fulfillment of the requirements for the degree of Master of Arts in the Department of
Exercise and Sport Science (Athletic Training) in the College of Arts & Sciences.
Chapel Hill 2017
Approved by: Erik Wikstrom
© 2017
ABSTRACT
Julie Harriss: Detecting Movement Errors in Chronic Ankle Instability Patients: Comparing Fusionetics to the LESS
(Under the direction of: Erik Wikstrom)
Lateral ankle sprains are the most common injuries in sport, and many who have an initial lateral ankle sprain go on to experience recurrent sprains and instability; defined at chronic ankle instability (CAI). The purpose was to determine whether Fusionetics or the Landing Error Scoring System (LESS), movement efficiency exams, are able to detect differences between collegiate athletes with and without CAI. Lower extremity Fusionetics tests (overhead squat, overhead squat with heel lift, and single limb squat) and the LESS were performed.
Nonparametric analyses found no differences between groups for any of the five outcome measures. Further, no correlations were found between injury characteristics (questionnaires and number of sprains) and outcome measures within the CAI group. The results indicate that
TABLE OF CONTENTS
LIST OF TABLES ... vi
LIST OF ABBREVIATIONS ... vii
CHAPTER I: INTRODUCTION ...1
CHAPTER II: REVIEW OF LITERATURE ...4
Epidemiology ...4
Risk factors ...4
Dynamic tasks in chronic ankle instability ...9
Drop and Jump Landings ...9
LESS ...14
CHAPTER III: METHODS ...16
3.1 Research design ...16
3.2 Participants ...16
3.3 Instruments ...17
3.4 Procedures ...17
3.5 Statistical Analysis ...19
CHAPTER IV: RESULTS ...22
Demographics ...22
Normality ...23
Group differences ...23
CHAPTER V: DISCUSSION ...26
Sample Comparison ...26
Group Differences ...27
Individual Variability ...29
Limitations ...31
Clinical implications ...32
Conclusions ...32
APPENDICES ...34
APPENDIX 1: FUSIONETICS SCORING ...34
APPENDIX 2: LANDING ERROR SCORING SYSTEM DEMONSTRATION ...34
APPENDIX 3: SCORING FOR THE LANDING ERROR SCORING SYSTEM ...35
APPENDIX 4. FUSIONETICS SCORING ERRORS ...36
APPENDIX 5: FOOT AND ANKLE ABILITY MEASUREMENT ...36
APPENDIX 6: IDENTIFICATION OF FUNCTIONAL ANKLE INSTABILITY ...37
LIST OF TABLES
Table 3-1 – Independent and dependent variables………...23
Table 3-2 – Research aims………...23
Table 4-1 – Number of participants by sport...24
Table 4-2 – Means and standard deviations...25
LIST OF ABBREVIATIONS
ATFL Anterior Talo-Fibular Ligament CAI Chronic Ankle Instability CFL Calcaneofibular Ligament EMG Electromyography
FAAM Foot and Ankle Ability Measure FAI Functional Ankle Instability FMS Functional Movement Screen GRF Ground Reaction Force
IdFAI Identification of Functional Ankle Instability LAS Lateral Ankle Sprains
CHAPTER I: INTRODUCTION
Lateral ankle sprains (LAS) are one of the most common injuries in sport,1 accounting for 40% of lower extremity injuries.2 The anterior talofibular ligament (ATFL) is the most
commonly injured ligament followed by the calcaneofibular (CFL) and the posterior talofibular ligament (PTFL). It is estimated that 2 million ankle sprains occur every year in the United States3 costing an average of 2 billion dollars annually.4 Acute ankle sprains are common, but up to 73% of subjects have recurrent sprains5 and up to 74% report at least one symptom 1.5 to 4 years later.6 Delahunt et. al.7 conducted a review of the literature and recommended the
definition of CAI include the presence of recurrent symptoms for a minimum of one year after initial LAS.
Chronic ankle instability is defined in many different ways, however, most agree that it has two subsections, mechanical instability and functional instability. Mechanical instability is defined as talocrural joint laxity due to damage to the lateral ankle ligaments.8 Functional instability is defined as feelings of instability and feelings of giving way.8 There are multiple theories about the causes of functional instability including disruption of proprioceptors,
mechanoreceptors, neuromuscular control, and postural stability.8 The link between mechanical and functional instability is not fully understood, mechanical instability rarely accounts for functional instability.9
predictor of sustaining a lateral ankle sprain.12,13 Poor dynamic and static postural stability have also been shown to increase likelihood of injury, although there are conflicting studies.12 14-17 More recently, functional tests have been studied to look at risk factors of ankle sprains,
including the SEBT, jump stabilization tasks, the BESS and modified BESS, and weight bearing lunge test (WBLT). The SEBT, WBLT, and the BESS were shown to not have an association with increased risk of ankle sprain18 while the hop test and the modified BESS found those who scored poorly were at greater risk of sustaining an ankle sprain.19 20 These studies show promise that functional risk factors are predictive of ankle sprain risk but many use laboratory equipment that is not available to the vast majority of athletic trainers.
While few studies have been done to look at risk factors, many functional tasks have been done to look at the difference between those with CAI and healthy controls. The SEBT has been shown to have conflicting results with several showing differences in at least one direction21 22 with several others showing no differences in reach distance.23-25 SEBT research has not proven consistent enough to show it is a capable tool of detecting differences between those who have CAI and healthy subjects. The Functional Movement Screen deep squat has been used to look at differences between CAI and healthy controls, with no differences found between the groups.26 27 Other functional studies include drop and jump landings where time to stabilize, ground reaction forces, and kinematics have been shown to be different between the groups.28-44 Higher or more posteriorly directed GRFs have been shown in those with CAI along with more anterior shear at the talocrural joint upon landing, both causing more stress to be placed on the stabilizing
could be a difference pre-injury that makes the subjects more likely to sustain a LAS, however, more research needs to be completed to support this theory.
The most promising functional task appears to be related to jump landing; however, many of the functional risk factors studied have used laboratory equipment, which is not readily
available in a clinical setting to determine who is at risk of sustaining a LAS. The LESS has been proven to be reliable between users and valid at detecting movement errors.45 The LESS does not require laboratory equipment and has been associated with other lower extremity injuries at the knee and stress fractures.45 46 Fusionetics is a movement assessment that has three different tests looking at the lower extremity quality of movement, the overhead squat, the overhead squat with heel lift, and the single leg squat, and it provides total scores, individual test scores, and specific joint scores. Therefore, the purpose of this study is to determine if the LESS or the lower
CHAPTER II: REVIEW OF LITERATURE
Epidemiology
Lateral ankle sprains (LAS) are one of the most common musculoskeletal injuries,1 which accounts for 40% of lower extremity injuries.2 Of the lateral ligaments, the anterior talofibular ligament (ATFL) is the most frequently injured. The calcaneofibular ligament (CFL) is injured fairly frequently but mostly in concurrently with an ATFL injury. The posterior talofibular ligament (PTFL) is rarely injured. It is estimated that 2 million ankle sprains occur every year in the United States alone3 and 5600 incidences per day in the UK47. Incidence rates have been listed as 2.15 to 7 per 1000 person-years,3 4 although females showed a higher incidence of ankle sprains compare with males with one study showing a incidence rate of 13.6 in females.47 LASs have a high initial health care cost ranging from $318-$941 per visit to an emergency room.48 Given the volume of acute ankle sprains seen, healthcare costs can reach 2 billion dollars annually.4 Average time lost due to LAS is 7.1 ± 6.5 days.14
Most importantly, acute LAS and recurrent ankle sprains have been linked to
posttraumatic ankle osteoarthritis. Hinterman et al.50 found that 66% of subjects with lateral ankle ligament injuries had cartilage damage predominately in the medial talus. Sugimoto et al.51 and Valderrabano et al.52 found similar results, with 73% and 85% of ankles with instability displaying articular degeneration respectively. Lee et. al.53 found a significantly greater percentage of those with CAI had osteochondral lesions of the tip of the medial malleolus compared to those without CAI. Using MRI, as opposed to arthroscopic visualization, Golditz et. al.54 found that an ankle instability group showed greater T2 relaxation times (worse cartilage health) on the medial talar dome relative to copers and uninjured controls; however, copers showed greater changes than the control group. The changes are believed to be a strong predictor of osteoarthritis, showing the presence of an early structure modification.54
CAI is a continuum that includes mechanical instability and functional instability.55 56 However, the link between mechanical and functional instability has not been clearly
demonstrated. Mechanical instability is defined as laxity of the talocrural joint caused by damage to the ligaments.8 Functional instability is defined as recurrent lateral ankle instability due to the disruption of proprioception, postural stability, and neuromuscular control in the ankle.8 Freeman9 found that mechanical instability and adhesion formation rarely accounts for functional instability. Hertel8 suggests that when ankle ligaments are torn, the sensory
increased amount of joint laxity in triplanar directions. Absence of the ATFL allows more anterior movement of the talus whereas damage to the CFL allows the talus to tilt more towards inversion.55 Functional instability has been related to impaired postural control and other
dynamic functional tasks, and chronic ankle instability has been shown to influence feedback and feed-forward mechanisms of motor control.57 Studies have been able to show what percentages of first time ankle sprains develop chronic ankle instability; however, the link between why certain patients develop recurrent problems is still unknown.
Hertel55 in a later article described chronic ankle instability as recurrent lateral ankle instability that results in recurrent ankle sprains. Hiller et al.56 advanced the model by describing CAI as symptoms ranging from giving way of ankle, loss of strength, recurrent sprains, pain, and swelling. Although there are many definitions of ankle instability, Delahunt et. al.7 conducted a review of the literature and recommended the definition of CAI to include the presence of
recurrent symptoms for a minimum of one year after initial LAS. Most recently, the International Ankle Consortium, determined inclusion criteria of CAI as at least one ankle sprain, a history of previously injured ankle giving way or recurrent sprains, and a function questionnaire such as the Foot and Ankle Ability Measure or the Foot and Ankle Outcome score.58 Subjects with multiple sprains complain of more symptoms than those who have had only a single sprain.5
initial LAS like those with CAI do and report limited or no self reported disability and better function than those with CAI. Studies have found no differences in laxity, talar position, and fibular position in copers when compared to those with CAI.59
Wikstrom and Brown59 report minimum inclusionary criteria should include an ankle sprain that is severe enough to warrant immobilization for one week or non-weight bearing for minimum of three days, return to moderate activity for 12 months without a recurrent ankle sprain, and minimum disability reported on a questionnaire. Copers report better overall ankle function than those with chronic ankle instability.59 Research has not been able to distinguish why certain patients develop chronic ankle instability and why some become copers and have no recurrent problems following an acute sprain.
Risk factors
Ankle sprains are a common injury and because they often result in long term instability. In order to understand how to prevent them, there needs to be a general understanding of risk factors. General risk factors have been found, including BMI, previous injury, and ankle
strength. Studies have been done to look at intrinsic risk factors for first time ankle sprains and chronic ankle instability; however, not much consistency has been found among the results of those studies. The most common risk factors include previous injury, BMI, increased body weight, and asymmetry between eccentric ankle plantar flexion and ankle dorsiflexion.10 Previous injury has been shown to be the most consistent and important risk factor.
were 2x as likely to suffer an ankle sprain. They found that previous injury was the strongest predictor of ankle injury.
Two studies looked at deficits in range of motion, and both found that less dorsiflexion increased risk of ankle sprains.1213 Subjects with less dorsiflexion than average were at a 5x greater risk of an ankle sprain, which is considered a strong predictor of ankle sprains.12
Baymhauer et al.13 found that muscle strength imbalances increased risk of ankle injuries. Peak torque and average torque were measured of lower-leg musculature to determine if the risk of ankle sprains is related to isotonic or isokinetic strength.11 Subjects with lower eccentric plantar flexion were 10.8x more likely to sustain a lateral ankle sprain and those with lower inversion eccentric strength were 4.4x more likely to sustain a ankle sprain.
McGuine et. al.14 looked at balance as a predictor of ankle sprains, and found that those who sustained injuries had higher preseason compilation (COMP) scores, indicating worse postural stability, compared to those who did not suffer sprains. COMP scores where assessed by looking at postural sway while balancing on a single limb with eyes open and eyes closed.14 McGuine et al.14 found that an increase in COMP scores correlated with increased rates of ankle sprains thus leading them to the conclusion that poor balance may predispose athletes to ankle injuries. Beynnon et al.16 also looked at postural sway differences in healthy athletes but did not find a relationship between COMP scores and the risk of initial ankle sprains. However, De Noronha12 found postural sway to be a moderate predictor of ankle sprains, and in a later study, he found that those who scored below an 80% on the SEBT in the postereolateral direction were at 48% greater risk of suffering an ankle sprain.15 Those with abnormal postural stability have a significant increase in the risk of sustaining an ankle injury.17
that subjects were 4-13x more likely to sustain a lateral ankle sprain if they were unable to control their momentum during the forward hop, and they were 2x more likely to sustain an ankle sprain if they could not control their landing during a backwards hop. This study showed the ability to predict ankle sprains by using a forward and backwards hop. Another study found that the weight-bearing lunge test, BESS, and SEBT scores were not associated with sustaining a lateral ankle sprain.18 Again, showing the SEBT is not as consistent in being an ankle sprain injury risk test. Finally, a study found that using a modified BESS test, scoring above the median for the foam tests were 70% more likely to sustain a lateral ankle sprain.19 Based on the above research, some risk factors are more functional in nature and can be used in a clinical setting to look at biomechanical differences in those that suffer injuries and those that do not. However, other functional movement patterns should be investigated, especially those that can be incorporated into a clinical setting, without the use of laboratory equipment given the inconsistencies noted in the literature.
Dynamic tasks in chronic ankle instability
There are functional tasks that have been studied to determine differences between those with CAI and healthy controls, one of which being the Star Excursion Balance Test (SEBT). The SEBT is a non-instrumented test that is used to measure dynamic postural stability by having a patient stand on one leg while reaching in eight different directions. Anterior, posteromedial, and posterolateral directions are commonly used to measure reach distance and normalized by leg length. All eight directions are not needed for the SEBT to be used as a clinical test for
Several studies found no significant difference in reach difference when comparing healthy controls to those with CAI or copers.23,24,25 Hertel et. al.21 found significant deficits in subjects with CAI compared to healthy in the anteromedial, posteromedial, and medial
directions. Another study found significant differences in performance in all eight directions in those with CAI compared to healthy controls and their uninvolved limb.22
While some studies found no difference in reach distance, one study looked at trunk rotation, pelvic rotation, and hip flexion and found all three were greater in those with CAI with the anteromedial reach, and an increase in just trunk flexion in the medial reach in those with CAI.24 Changes in trunk and pelvic motion may be a compensatory movement to increase deficits in reach distance or a risk factor of initial sprains or CAI.
While the SEBT is a non-instrumented test, occasionally EMG activity of muscles like the tibialis anterior and peroneus longus are measured and studied to see differences in groups. EMG results showed greater activity of the tibialis anterior and the peroneus longus of copers
compared to healthy controls which may be a compensatory strategy to improve stability while performing the SEBT.25 However, the study did not find a significant difference in EMG activity of the copers compared to those with CAI.
The SEBT can be used as a predictor of lower extremity injuries, with girls who have composite scores less than 94% of leg length were 6.5 times more likely to sustain a lower extremity injury.63 The same study found boys who had right and left leg reach distances different than 4 cm were 2.5 times more likely to sustain a lower extremity injury. While lower extremity injury is not specific to the ankle, a functional test that can predict injury without the use of laboratory instruments is an important clinical tool. The SEBT is a clinical tool that can be used without equipment; however, the research has not been developed to show that it is a
Only two previous articles have looked at differences between those with CAI and healthy controls performing another functional movement, the squat. Both previous articles used the Functional Movement Screen (FMS) lower extremity assessment. One study included the deep squat and the hurdle step over26 while the other included all three exercises: hurdle step over, deep squat, and the in-line lunge.27 For the deep squat, the FMS scores the test 0-3. A 3 is achieved if the subject can perform a deep squat keeping their heels on the floor, head and chest facing forward, and does not have valgus collapse of either knee with feet shoulder width apart. If any compensation is noted, the FMS board was placed under the heels. If the subject is able to complete the test with no compensations with their heels raised, a score of 2 is given. If the subject is still unable to perform the test, a score of 1 is given. A score of zero is achieved if the subject has any pain with testing. Both previous tests found no differences in deep squats between groups.26 27
Drop and Jump Landings
It is hypothesized that differences in jump or drop landings between those with CAI and healthy controls may increase risk of ankle sprains. Studies have investigated biomechanical differences in sagittal and frontal plane kinematics, ground reaction force (GRF), and time to stabilization during drop landing in those with CAI compared to healthy controls or copers.28-44 Some studies found that those with CAI have higher GRFs during single leg drop landing
re-injury. They are theorized to be attributed to altered feed-forward mechanics.31 Caulfield et al.30 found differences between CAI and healthy control groups in pre-landing angles of the knee and ankle that are attributed to differences in feed forward motor control. A decrease in angular displacement does not allow shock absorption and increases the risk of injury.30
Lateral and forward hops have also been used to look at differences in landing kinematics between CAI and controls. De Ridder et al.32 found no differences in lower limb kinematics when comparing CAI to controls in lateral and forward jumps, while recently his work found an increase in GRF in those with CAI causing them to have a stiffer landing in a side jump test.29 Other jumping tasks have found that those with CAI, functional instability, or mechanical laxity need a longer time to stabilize after landing than healthy controls.33-38 Gribble et. al.34 also found a decrease in pre-landing knee flexion that may contribute to a decrease in the dynamic stability of the ankle; subsequently causing an increased time to stabilize. Knee flexion upon impact helps dissipate forces and control ground reaction forces. In addition, more knee flexion lowers the center of gravity, which improves postural stability. Only one study found no difference in dynamic postural stability during jump landings between CAI, copers, and healthy controls.39
Lin et. al.40 hypothesized that an alteration in muscle feed-forward activation, can increase risk of re-injury. This could also increase injury risk as plantar flexion is an open packed position that decreases bony congruence of the ankle. Participants with functional instability had a longer time to reach a closed packed, dorsiflexed position of the ankle joint. Limited dorsiflexion range of motion can increase the likelihood of a lateral ankle sprain.42 A decrease in dorsiflexion at initial contact during single leg jump landing may explain an increase in posterior GRF which can cause a higher transmission of force to the stabilizing ligaments and joint articular surfaces which could explain the high incidence of OA and ligament injuries in those with ankle instability.42 A delay or decrease in dorsiflexion may result in the posterior GRF due to the changes in the position of body mass and center of gravity, causing an increase of stress on the articular surfaces.
Studies also looked at the frontal plane motion upon landing and found a greater variability in ankle frontal plane motions in those with FAI. Due to the laxity in the ATFL, the ligament is not able to limit anterior translation which can increase risk of injury as the motion exceeds safe movement patterns, and may explain the increase in variability in GRF.41 In contrast, Terada et. al.44 found no significant difference in peak anterior tibial shear force between those with CAI and the control group. Peak anterior tibial shear force had a moderate inverse correlation with knee flexion and was strongly correlated with posterior GRF; however neither outcome was significantly different between groups.44
LESS
The Landing Error Scoring System (LESS) is a functional movement screen that can be used with or without laboratory equipment. The test involves a horizontal jump off of a 30-cm box placed 50% of the subject’s height from a landing target followed by an immediate maximum vertical jump. Keys to the test are instructing subjects to jump with both feet simultaneously, not jumping vertically off the box, and completing the motions in a fluid manner. Standard video cameras, to capture the frontal and sagittal planes, help ensure valid scoring. Scoring consists of counting landing errors, with higher scores indicating worse landing technique. Errors include positioning of lower extremity and trunk upon landing, positioning of the feet, positioning of the trunk during landing and amount of displacement of each joint in both sagittal and frontal plane. 3D motion analysis, the gold standard of kinematic and kinetic
movements, showed the LESS to be valid and reliable at indicating movement errors.45 Interrater reliability ranged from .72-.81 for the LESS scored in real time65 and proved to have moderate to excellent interrater reliability between experts and novices.66 Automatic scoring, via the
alternative kinematics and kinetics may need to be included to expand the LESS to be useful for looking at ankle instability.
While the LESS can be used to identify those with poor landing biomechanics that put them at risk for an ACL injury, limited data is available regarding jump landing biomechanics as a predictor of injury. While some landings biomechanics appear capable of predicting ankle injury risk, they have not used a clinically available tool like the LESS. To date, only one other non-instrumented functional task, the SEBT, has been shown to predict ankle sprain injury risk. Worse scores on the Fusionetics and LESS tests may indicate that those with CAI are at an increased risk of lower extremity injury. Thus, identifying another functional task that is easily deployed in clinical settings would be valuable.
CHAPTER III: METHODS
3.1 Research design
This case-control study sought to identify if the LESS and/or Fusionetics was sensitive enough to identify those who have CAI compared to controls. The independent variable was group, CAI and control. The dependent variables were the overall scores and the overall Fusionetics as well as the individual Fusionetics scores for the overhead squat, overhead squat with heel lift, and the single leg squat with a max possible score of 100 for each (appendix 1). Outcomes were compared between groups at one time point during preseason screenings.
3.2 Participants
Ninety-nine participants were used in this study. These participants were varsity athletes at the University of North Carolina at Chapel Hill. Physically active individuals participated in at least three thirty minute sessions of sporting activity a week. The inclusion and exclusion criteria for the CAI group was determined by the International Ankle Consortium.58 The inclusion criteria for CAI group consisted of a history of at least one significant ankle sprain that occurred at least 12 months prior to enrolling in the study and was associated with inflammatory
interruption of one day of physical activity. Participants could be between 18-35 years old. This study was approved by the Institutional Review Board (IRB) of the University of North Carolina at Chapel Hill.
3.3 Instruments
Fusionetics is a movement efficiency screen that is broken up into seven specific components, three for the lower body. The lower extremity Fusionetics64 score was determined by performance on the un-weighted overhead squat, the overhead squat with heel lift, and the single leg squat tasks. Before conducting the squat assessments, verbal instructions were given to participants: “feet shoulder width apart, toes pointing straight ahead, and arms fully extended up by your ears. Squat down to the height of a chair seat.” The same instructions were given for the overhead squat with the heel lift except the heels were placed on a small weight plate (~3/4 inch).
For the single leg squats, “Stand on one leg with toes pointing straight ahead and hands on hips, squat down to the height of a chair seat.” The tester observed movements from the front and recorded the compensations that occurred at each checkpoint. The detail for movement compensations can be seen in appendix 4. Major themes that were noted in Fusionetics are any alterations in foot or knee positioning that occurred due to hip, knee, or ankle factors. Another major theme was asymmetry between sides, especially when looking at single leg squats.
the Fusionetics squat assessment, however, specific errors are noted at each joint and the errors are deducted from the total squat score based on computer scoring. There are 10 total errors for the overhead squat and the overhead squat with heel lift, and 5 errors for the single leg squats. Different errors are weighted differently. Appendix 4 shows specific errors for the Fusionetics squat tasks. Errors look at foot and knee positioning, arch collapse, lumbar spine arching or rounding. The single leg squat has fewer errors and also looks at foot and knee positioning as well as uncontrolled trunk flexion and loss of balance. The Fusionetics scoring should be able to pick up smaller differences in movement between participants than the FMS squat scores. The Fusionetics scores were calculated on the online portal by the proprietary Fusionetics software. The scores start at 100 and decrease with each error. The magnitude of reduction, depends on the error made. Fusionetics has developed cut off scores to separate participants into good, moderate and poor movers. Based on the Fusionetics algorithms, good movers score between 75-100, moderate score between 50-75, and poor movers score below 50.
IdFAI is a self-reported questionnaire based on two previous FAI instruments, the Ankle Instability Index (AII) and the Cumberland Instability Tool (CAIT). The IdFAI is a ten-item questionnaire with a discrimination score of 10, meaning those scoring higher than a 10 are considered to have FAI (Appendix 6).69 Gurav et al. 70 found the IdFAI to have excellent test-retest reliability (ICC2,1=0.959). Overall, the IdFAI was found to have an accuracy of 89.6%, which is higher than the accuracy of the CAIT and AII combined.69 This questionnaire can be filled out quickly and easily and is an accurate and feasible way to determine whether
participants have FAI.
The Foot and Ankle Ability Measurement-sport subscale (FAAM-s) is another self-reported foot and ankle function questionnaire about sport activities (Appendix 5). Each question has point values from 0 (unable to do) to 4 (no difficulty at all). The scores are then transformed into percentage scores with higher scores indicating higher levels of function.71 The maximum score for the sports subscale is 32. The score is divided by the highest possible score and then multiplied by 100 to get a percentage. A higher percentage is a representation of higher
function.71 The FAAM test retest reliability was .87 for the sports subscale.72 The FAAM sport allowed us a comparison between the CAI and control groups on the level of disability in sport activities.
3.4 Procedures
After determining eligibility via the IdFAI score, participants completed the Fusionetics screening by completing five overhead squats, overhead squats with heel lift, and finally five single leg squats for both limbs. The Fusionetics data was collected on Fusionetics scoring sheets by the examiner. Participants then were given practice trials of the LESS until they were
score the jump landings. Failed trials of the LESS were discarded and repeated.LESS jump landings were considered successful if the participants (1) jumped off of both feet from the box; (2) jumped forward, but not vertically, to reach the force plate below; (3) landed with the entire foot of the dominant lower extremity on the force plate; (4) landed with the entire foot of the non-dominant lower extremity off the force plate; and (5) completed the task in a fluid motion.45 The test order was recorded.
3.5 Statistical Analysis
Sample size estimates were based on sample sizes from pilot testing. A power analysis was conducted based on effect sizes. Calculated effect sizes from pilot testing of recreational athletes, indicate a total sample size of 174 was needed to observe significant differences in CAI and control for the total Fusionetics. A sample size of 70 was needed to observe significant differences in the LESS.
Komogorov-Smirnov normality tests were used to determine normality of dependent variables. Fusionetics, LESS, and individual component scores were assessed using separate nonparametric statistics to compare between the two groups, controls vs. CAI. Non-parametric statistics were used because four out of the five dependent variables indicated that the data was not normal distribution. A frequency distribution of movement quality (Good, Moderate, Poor) by group was analyzed with Chi Square. A Spearman Rho correlation was run on CAI cases only to determine correlations between IdFAI, FAAM-Sport, and number of ankle sprains and
Table 3-1 Variables
Independent Variables Dependent Variables
Group:
-CAI
-Healthy controls
Total Fusionetics Overhead squat
Overhead squat with heel lift Single leg squat
LESS scores
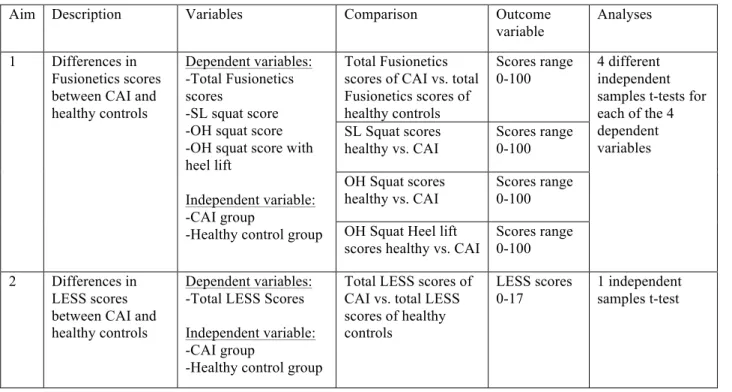
Table 3-2 Research Aims
Aim Description Variables Comparison Outcome
variable
Analyses
1 Differences in Fusionetics scores between CAI and healthy controls
Dependent variables: -Total Fusionetics scores
-SL squat score -OH squat score -OH squat score with heel lift
Independent variable: -CAI group
-Healthy control group
Total Fusionetics scores of CAI vs. total Fusionetics scores of healthy controls
Scores range 0-100
4 different independent samples t-tests for each of the 4 dependent variables SL Squat scores
healthy vs. CAI
Scores range 0-100
OH Squat scores healthy vs. CAI
Scores range 0-100
OH Squat Heel lift scores healthy vs. CAI
Scores range 0-100
2 Differences in LESS scores between CAI and healthy controls
Dependent variables: -Total LESS Scores
Independent variable: -CAI group
-Healthy control group
Total LESS scores of CAI vs. total LESS scores of healthy controls
LESS scores 0-17
CHAPTER IV: RESULTS
Demographics
Ninety-nine subjects from six division one NCAA sports met the inclusion and exclusion criteria. Forty-nine of those participants were deemed to have CAI (M:20;F:29, age 19.86±1.24, height 68.59±3.14, weight 159.41±25.67, IdFAI 15.63±3.86, FAAM-S 94.58±9.61%) and fifty participants were considered uninjured controls (M:26;F:24, age 19.64±1.08, height 69.82±3.54, weight 159.82±25.94, IdFAI 1.20±2.30, FAMM-S 98.82±5.42%). Normality tests show that age (p<.01) and height (p<.01) are not normal therefore nonparametric statistics are used to compare age, height, and weight between groups. There were no differences in age (p=.356), height (p=.244), and weight (p=.937). A breakdown of the participant’s sport by Group can be seen in Table 4.1.
Table 4-1 Number of participants by sport
CAI Control
Women’s Crew 10 9
Men’s Soccer 9 12
Women’s Soccer 4 3
Men’s Lacrosse 11 14
Women’s Lacrosse 9 4
Normality
Komogorov-Smirnov normality tests were run on the five dependent variables. Four out of the five tests were significant: LESS p<.05, Fusionetics p=.20, DL squat p<.01, DL squat with heel lift p<.01, SL squat p<.01 indicating the data is not normally distributed. Therefore, non-parametric statistics were used to compare the two groups.
Group differences
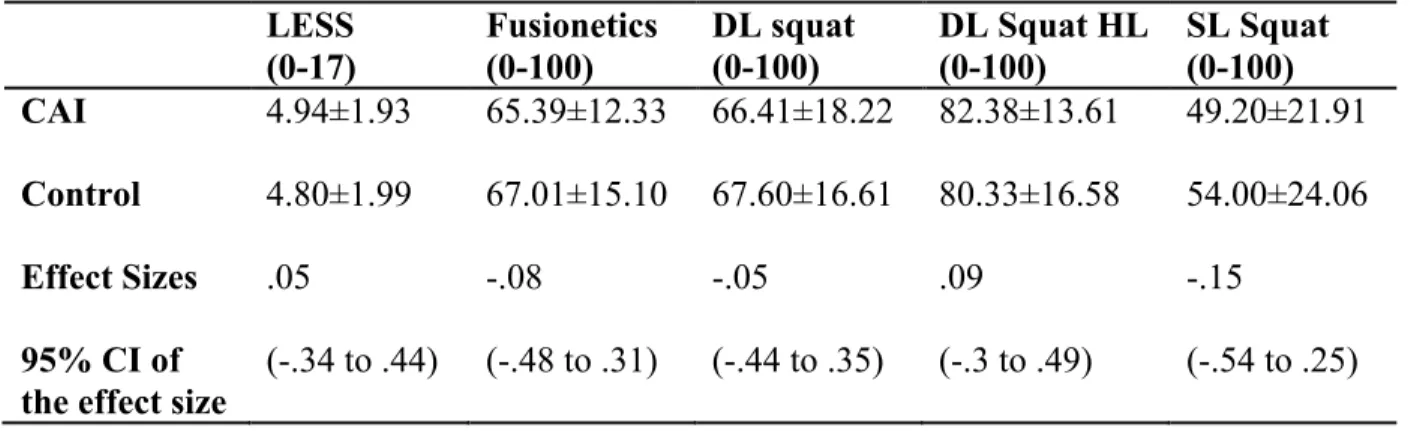
No differences were found between groups for LESS score (p=.514), total Fusionetics score (p=.491), un-weighted overhead squat score (p=.814), overhead squat with heel lift score (p=.725), or the single leg squat score (p=.359). Group means and standard deviations for each test can be seen in table 4-2 below. The Chi square results were not significant for each task, total Fusionetics (p=.715), DL squat (.073), DL squat with heel lift (p=.681), and single leg squat (p=.321).
Table 4-2 Means and standard deviations
LESS (0-17)
Fusionetics (0-100)
DL squat (0-100)
DL Squat HL (0-100)
SL Squat (0-100) CAI 4.94±1.93 65.39±12.33 66.41±18.22 82.38±13.61 49.20±21.91
Control 4.80±1.99 67.01±15.10 67.60±16.61 80.33±16.58 54.00±24.06
Effect Sizes
95% CI of the effect size
.05
(-.34 to .44)
-.08
(-.48 to .31)
-.05
(-.44 to .35)
.09 (-.3 to .49)
-.15
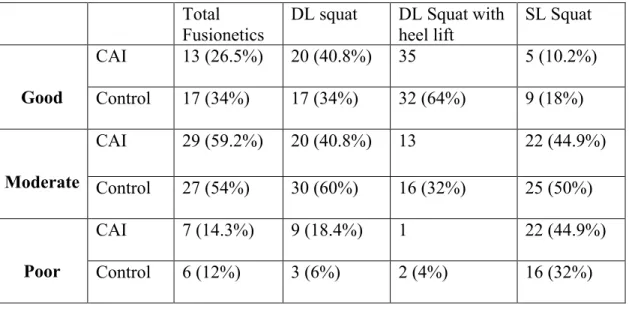
Table 4-3 Cutoff score frequency for Fusionetics scores
Correlations
Within the CAI cases, no significant correlations between LESS or Fusionetics scores and injury characteristics associated with CAI (e.g. IdFAI, number of ankle sprains, etc.) were noted. However, significant correlations were noted among CAI participant’s weight and height and total Fusionetics scores, double leg squat scores, and double leg heel lift squat scores. A table illustrating the relationships among these variables can be seen in table 4-4.
Total Fusionetics
DL squat DL Squat with heel lift
SL Squat
Good
CAI 13 (26.5%) 20 (40.8%) 35 5 (10.2%)
Control 17 (34%) 17 (34%) 32 (64%) 9 (18%)
Moderate
CAI 29 (59.2%) 20 (40.8%) 13 22 (44.9%)
Control 27 (54%) 30 (60%) 16 (32%) 25 (50%)
Poor
CAI 7 (14.3%) 9 (18.4%) 1 22 (44.9%)
Table 4-4 Spearman correlations between injury characteristics and movement assessments in CAI participants.
LESS Fusionetics DL Squat DL Squat HL SL Squat Number of sprains -.202 p=.164 -.279 p=.052 -.229 p=.114 -.138 p=.343 -.167 p=.251
IDFAI -.154
p=.290 -.265 p=.066 -.211 p=.145 -.258 p=.073 -.121 p=.406 FAAM Sport -.203
p=.161 .173 p=.234 .074 p=.612 .053 p=.717 .219 p=.130
Height -.198
p=.172 -.346 p=.015 -.287 p=.046 -.356 p=.012 -.139 p=.339
Weight -.105
CHAPTER V: DISCUSSION
The purpose of this study was to compare movement efficiency during four tasks (LESS, double limb squat, double limb squat with heel lift, single limb squat) between collegiate athletes with and without CAI. We hypothesized that collegiate athletes with CAI would score
significantly higher (worse) on the LESS than healthy controls and that collegiate athletes with CAI would score significantly lower (worse) on Fusionetics total score for each task relative to healthy controls. The results of this study overall failed to support our a priori hypotheses for both research questions.
Sample Comparison
The current sample of CAI athletes were required to have sustained at least one lateral ankle sprain and score ≥10 on the IdFAI. This differs from previous studies which have used a wide range of inclusion criteria. The majority required at least one previous lateral ankle sprain, although a few required at least two 30-32 42 or more36 40 to be defined as having CAI. Similarly, most previous participants were recreationally active and completed cardiovascular exercise or recreational sports like intramural soccer or basketball and found sensorimotor differences between a CAI and uninjured control group. Only one other study included Division I athletes as participants38 and in that investigation differences, relative to uninjured controls, in static
postural control were not detected. However, the CAI group did take longer to stabilize after landing from a jump relative to the uninjured control group.38 Thus, our lack of group
regardless of the presence of CAI. However, only two studies have been done in collegiate athletes with CAI, more research is needed.
Our average FAAM-sport scores for the CAI participants would support this hypothesis. Despite being classified as having CAI, the average FAAM-Sport score was 94.58% whereas previous studies often report FAAM-Sport scores below 80%.34 37 44 Despite high functioning in the CAI group, our sample was still significantly lower than the control group. However, it should be noted that many studies in the literature use FAAM-Sport scores as an inclusion criteria which may bias the comparison between the current sample and previous reports. Similarly, no other study used the IdFAI to determine CAI status, instead using the CAIT, FAAM/FADI , or the AII.25-28 33 34 37 38 40 43 While our results could suggest that the IdFAI was not an appropriate tool to classify participants, it must be noted that the scale was developed from the CAIT and AII.69 More specifically, the IdFAI was developed to eliminate the number of diagnostic questionnaires being used in the CAI literature and was found to have an accuracy of 89.6% in identifying participants with the minimally accepted criteria for CAI.69 73 While, it is possible that using a different classification tool could have altered the results, we are confident that the IdFAI accurately identified NCAA Division 1 collegiate athletes with CAI.
Group Differences
Jump landings
differences in landing stiffness, it is likely that detecting a single error out of 17 possible errors may not be enough to show significant differences between the groups.
Differences in CAI and control groups have been found in single limb time to
stabilization following a jumping task.33-38 This study used the LESS, a double limb drop landing task, therefore, it is not as posturally demanding as the single limb jump landings observed in studies above. Additionally, the LESS does not require stabilization but rather requires participants to immediately jump for maximum height after landing from the drop jump. This does not allow time to stabilization to be measured using the LESS and therefore makes direct comparisons difficult.
Finally, studies have looked at frontal plane motion with jump landings between CAI and control participants. These studies show greater anterior tibial shear force which may explain greater GRF findings. However, these studies had mixed results with one showing a difference between FAI participants and healthy controls41 and another showing no difference.44 The LESS also looks at the frontal plane errors but these errors focus on knee valgus and hip adduction, not ankle specific frontal plane errors.
Cumulatively, laboratory instruments have identified kinematic, and kinetic differences between CAI and uninjured control groups. However, the current study looked at a
non-laboratory based test that could be used in a clinical setting. The LESS has been shown to identify worse landing kinematics45 in those at greater risk for ACL injuries.45 46 Errors indicating joint positioning at initial contact, max displacement, and stiffness of landing are similar to findings in previous literature. However, without laboratory equipment, feed forward muscle activity and anterior tibial translation cannot be measured. As a result, the overall LESS score may not be sensitive enough to detect the changes associated with CAI. Jump landings may be an inappropriate clinical task, or because specific individual movement errors could mask errors that show differences in groups. For example, trunk flexion may not differ between groups but may overshadow a lack of dorsiflexion. We did not examine specific errors related to plantar flexion at landing, or landing stiffness. The presence of these specific errors in isolation may be more appropriate to examine in CAI participants than the overall LESS score.
Squat
that Fusionetics would be better able to pick up CAI associated compensations than the FMS. For example, out of the ten possible errors for the double limb squat, foot flattening, foot external rotation, and heel lift are included. These specific adaptations are thought to be related to decreases in available dorsiflexion. Previous studies have attributed movement compensations and an increased risk of recurrent lateral ankle sprains to a decrease in dorsiflexion.42
While there are more possible movement errors that could be identified in the Fusionetics scoring algorithm, few look at the ankle specifically. Further, the proprietary algorithm or proposed movement quality cut points may not be appropriate for looking at ankle specific errors or CAI associated movement abnormalities. Examining the specific errors made by the CAI and uninjured control participants might be more appropriate for the CAI population. Additionally, the postural demands in the double limb task are minimal and may not detect differences associated with CAI.21-25 Although the single limb squat task has a greater demand for postural stability, both limbs are included in one test. Therefore, if deficits are seen in the involved side, the effect may be minimized due to the score of the uninvolved limb being included with the involved limb.
Single limb balance tasks have been used as a predictor of ankle sprains; however, there are mixed results.15 Several studies showing balance tests such as the SEBT and the BESS have mixed results in predicting ankle sprain risk14 18 39 or lower extremity injuries in general.63 There are also mixed results comparing CAI and healthy participants using the SEBT.21-25 The
the control group. As a result, the SLS may not be able to pick up differences specific to the etiology of CAI. Future research should look at specific errors that CAI participants display during the SLS versus control participants.
Individual Variability
CAI is a heterogeneous condition and thought to have a multi-factorial mechanism. As a result, everyone within the CAI group may move differently; therefore looking at group means may not be the most appropriate way to examine the data. With so much variability in the
injury characteristics (e.g. questionnaires of self-reported function, number of sprains, incidences of instability, severity of sprains, etc) and individual movement errors as well as other measures of sensorimotor function.
Limitations
There were several limitations in this study. While we specifically targeted Division I athletes, the generalization of these results to other populations may be limited. This could also suggest that those with worse self-reported function may have worse movement quality relative to the current sample. Additionally, this current study used the Fusionetics platform, which has its own proprietary algorithm for scoring the different tasks. The limitation is that we only used this platform to score movement quality. There could be other more effective ways to score movement quality and identify group differences. Examining movement errors without the Fusionetics platform may be advantageous for CAI related research. Additionally, future research should focus on single limb tasks that increase postural demands like the SEBT or the Y-balance test. These balance tasks have been shown to detect differences in groups and are easily performed in a clinical setting.
Clinical implications
Conclusions
There was no difference between CAI subjects and healthy controls in Fusionetics total or individual task scores. Similarly, there was no difference between CAI subjects and healthy controls in LESS scores. Finally, despite CAI being a heterogeneous condition, there was no correlation among injury characteristics: number of sprains, IDFAI, or FAAM-S scores and movement assessment scores.
APPENDICES
APPENDIX 1: FUSIONETICS SCORING
APPENDIX 3: SCORING FOR THE LANDING ERROR SCORING SYSTEM
correctly. Trials were excluded and repeated if the participants jumped vertically from the box or if they did not jump for maximal height upon landing. Two digital video cameras (model DCR-HC30; Sony Corporation of America, Park Ridge, NJ) were placed 10 ft (3 m) in front of and to the right of the participants to capture frontal and sagittal images of all jump-landing trials.14,16
Data Reduction
Two research assistants (L.J.D., M.J.D.), who were blinded to injury status, graded the digital videos of all participants using the LESS and free computer software (QuickTime; Apple, Inc, Cupertino, CA). The LESS is a valid and reliable (interrater reliability: intraclass correla-tion coefficient [2,1]¼0.84, standard error of the mean¼ 0.71) clinical movement-analysis tool that evaluates specific jump-landing characteristics.14 Movements were analyzed at theinitial contact frame, which was defined as the frame immediately before the foot was flat on the ground, and between initial contact and maximal knee flexion (Table 1). The LESS primarily uses a dichotomous scoring rubric to identify obvious movement errors, such as limited knee flexion or excessive medial knee
displace-ment. Therefore, a 1-point differential in the total LESS score can be associated with moderate to large differences in certain biomechanical variables.14A higher LESS score indicates a greater number of landing errors and conse-quently poorer jump-landing technique. The average LESS score from the 3 trials at each testing session was used for data analyses.
Statistical Analyses
Standard statistics for screening tests were used and included receiver operator characteristic curve analyses to select a test cutpoint, followed by computation of sensitivity and specificity. We compared mean LESS scores in the injured and uninjured participants using t tests. The 1-season risk of ACL injury in athletes whose screening was positive was divided by the 1-season risk of ACL injury in athletes whose screening was negative to compute the injury risk ratio. We used SPSS software (version 16.0; SPSS Inc, Chicago, IL) and SAS software (version 9.2; SAS Institute, Cary, NC) to analyze the data. Returning athletes contributed more than 1 season to the analysis, and multiple seasons were treated as statistically independent. Exact methods, such as the Fisher test, were
Table 1. Operational Definitions for Individual Landing Error Scoring System Items
Landing Error Scoring System Item Operational Definition of Error Scoring Knee flexion: initial contact The knee is flexed less than 308at initial contact. 0¼Absent
1¼Present Hip flexion: initial contact The thigh is in line with the trunk at initial contact. 0¼Absent
1¼Present Trunk flexion: initial contact The trunk is vertical or extended on the hips at initial contact. 0¼Absent
1¼Present Ankle plantar flexion: initial contact The foot lands heel to toe or with a flat foot at initial contact. 0¼Absent
1¼Present Medial knee position: initial contact The center of the patella is medial to the midfoot at initial contact. 0¼Absent
1¼Present Lateral trunk flexion: initial contact The midline of the trunk is flexed to the left or the right side of the body at initial contact. 0¼Absent
1¼Present Stance width: wide The feet are positioned greater than shoulder width apart (acromion processes) at initial
contact.
0¼Absent 1¼Present Stance width: narrow The feet are positioned less than shoulder width apart (acromion processes) at initial
contact.
0¼Absent 1¼Present Foot position: external rotation The foot is externally rotated more than 308between initial contact and maximum knee
flexion.
0¼Absent 1¼Present Foot position: internal rotation The foot is internally rotated more than 308between initial contact and maximum knee
flexion.
0¼Absent 1¼Present Symmetric initial foot contact:
initial contact
One foot lands before the other foot or 1 foot lands heel to toe and the other foot lands toe to heel.
0¼Absent 1¼Present Knee-flexion displacement The knee flexes less than 458between initial contact and maximum knee flexion. 0¼Absent
1¼Present Hip-flexion displacement The thigh does not flex more on the trunk between initial contact and maximum knee
flexion.
0¼Absent 1¼Present Trunk-flexion displacement The trunk does not flex more between initial contact and maximum knee flexion. 0¼Absent
1¼Present Medial-knee displacement At the point of maximum medial knee position, the center of the patella is medial to the
midfoot.
0¼Absent 1¼Present Joint displacement Soft: the participant demonstrates a large amount of trunk, hip, and knee displacement. 0¼Soft
Average: the participant has some, but not a large amount of, trunk, hip, and knee displacement.
1¼Average
Stiff: the participant goes through very little, if any, trunk, hip, and knee displacement. 2¼Stiff Overall impression Excellent: the participant displays a soft landing with no frontal-plane or
transverse-plane motion.
0¼Excellent
Average: all other landings. 1¼Average Poor: the participant displays large frontal-plane or transverse-plane motion, or the
participant displays a stiff landing with some frontal-plane or transverse-plane motion.
2¼Poor
APPENDIX 4. FUSIONETICS SCORING ERRORS
APPENDIX 5: FOOT AND ANKLE ABILITY MEASUREMENT
Patient Name: ________________________________________ Date: ____________________
Please answer EVERY QUESTION with ONE response that most clearly describes your condition within the past week. If the activity the question is limited by something other than your foot or ankle, mark NOT APPLICABLE (N/A).
Because of your foot & ankle, how much
difficulty do you have with:
No Difficulty Slight Difficulty Moderate Difficulty Extreme Difficulty Unable
To Do N/A
Standing 0 1 2 3 4 □
Walking on even ground 0 1 2 3 4 □
Walking on even ground without shoes 0 1 2 3 4 □
Walking up hills 0 1 2 3 4 □
Walking down hills 0 1 2 3 4 □
Going up stairs 0 1 2 3 4 □
Going down stairs 0 1 2 3 4 □
Walking on uneven ground 0 1 2 3 4 □
Stepping up and down curbs 0 1 2 3 4 □
Squatting 0 1 2 3 4 □
Coming up on your toes 0 1 2 3 4 □
Walking initially 0 1 2 3 4 □
Walking 5 minutes or less 0 1 2 3 4 □
Walking approximately 10 minutes 0 1 2 3 4 □
Walking 15 minutes or greater 0 1 2 3 4 □
Because of your foot & ankle, how much
difficulty do you have with:
No Difficulty Slight Difficulty Moderate Difficulty Extreme Difficulty Unable
To Do N/A
Home responsibilities 0 1 2 3 4 □
Activities of daily living 0 1 2 3 4 □
Personal care 0 1 2 3 4 □
Light to moderate work (standing,
walking) 0 1 2 3 4
□
Heavy work (push/pulling, climbing,
carrying) 0 1 2 3 4
□
Recreational activities 0 1 2 3 4 □
How would you rate your current level of function during your usual activities of daily living from 0 to 100 with 100 being your level of function prior to your foot or ankle problem and 0 being the inability to perform any of your usual daily activities?
__________%
Because of your foot & ankle, how much
difficulty do you have with:
No Difficulty Slight Difficulty Moderate Difficulty Extreme Difficulty Unable
To Do N/A
Running 0 1 2 3 4 □
Jumping 0 1 2 3 4 □
Landing 0 1 2 3 4 □
Starting & stopping quickly 0 1 2 3 4 □
Cutting/lateral movements 0 1 2 3 4 □
Low impact activities 0 1 2 3 4 □
Ability to perform activity with your
normal technique 0 1 2 3 4 □
Ability to participate in your desired sport
as long as you would like 0 1 2 3 4 □
How would you rate your current level of function during your sports related activities from 0 to 100 with 100 being your level of function prior to your foot or ankle problem and 0 being the inability to perform any of your usual sports related activities?
__________%
FAAM Sports Subscale
APPENDIX 6: IDENTIFICATION OF FUNCTIONAL ANKLE INSTABILITY
REFERENCES
1. van Rijn RM, van Os AG, Bernsen RM, et al. What is the clinical course of acute ankle sprains? A systematic literature review. Am J Med 2008;121(4):324-31 e6.
2. Fernandez WG, Yard EE, Comstock RD. Epidemiology of lower extremity injuries among U.S. high school athletes. Acad Emerg Med 2007;14(7):641-5.
3. Waterman BR, Belmont PJ, Jr., Cameron KL, et al. Epidemiology of ankle sprain at the United States Military Academy. Am J Sports Med 2010;38(4):797-803.
4. Waterman BR, Owens BD, Davey S, et al. The epidemiology of ankle sprains in the United States. J Bone Joint Surg Am 2010;92(13):2279-84.
5. Yeung MS, Chan KM, So CH, et al. An epidemiological survey on ankle sprain. Br J Sports Med 1994;28(2):112-6.
6. Anandacoomarasamy A, Barnsley L. Long term outcomes of inversion ankle injuries. Br J Sports Med 2005;39(3):e14; discussion e14.
7. Delahunt E, Coughlan GF, Caulfield B, et al. Inclusion criteria when investigating
insufficiencies in chronic ankle instability. Med Sci Sports Exerc 2010;42(11):2106-21. 8. Hertel J. Functional instability following lateral ankle sprain. Sports Med 2000;29(5):361-71. 9. Freeman MA. Instability of the foot after injuries to the lateral ligament of the ankle. J Bone
Joint Surg Br 1965;47(4):669-77.
10. Fousekis K, Tsepis E, Vagenas G. Intrinsic risk factors of noncontact ankle sprains in soccer: a prospective study on 100 professional players. Am J Sports Med 2012;40(8):1842-50. 11. Kaminski TW. Examining Relative Risk Ratios Between Measures of Lower Leg Strength
and Ankle Sprain in a Collegiate Athletic Population. J Athl Train 2015;50(6(Supplement)).
12. de Noronha M, Refshauge KM, Herbert RD, et al. Do voluntary strength, proprioception, range of motion, or postural sway predict occurrence of lateral ankle sprain? Br J Sports Med 2006;40(10):824-8; discussion 28.
13. Baumhauer JF, Alosa DM, Renstrom AF, et al. A prospective study of ankle injury risk factors. Am J Sports Med 1995;23(5):564-70.
15. de Noronha M, Franca LC, Haupenthal A, et al. Intrinsic predictive factors for ankle sprain in active university students: a prospective study. Scand J Med Sci Sports 2013;23(5):541-7. 16. Beynnon BD, Murphy DF, Alosa DM. Predictive Factors for Lateral Ankle Sprains: A
Literature Review. J Athl Train 2002;37(4):376-80.
17. Tropp H, Ekstrand J, Gillquist J. Stabilometry in functional instability of the ankle and its value in predicting injury. Med Sci Sports Exerc 1984;16(1):64-6.
18. Hartley E. Are Baseline Measures of Balance and Functional Movement Associated with Incidence of Ankle Sprains? J Athl Train 2015;50(6(Supplement)).
19. Peck K. The Utility of a Modified Balance Error Scoring System for Identifying Athletes at Increased Risk of Ankle Sprain. J Athl Train 2015;50(6(Supplement)).
20. Liu K P-DP, Kaminski TW. Examining Relative Risk Ratios Between Measures of Dynamic Stability and Ankle Sprain in a Collegiate Athletic Population. Journal of Athletic
Training 2015.
21. Hertel J, Braham RA, Hale SA, et al. Simplifying the star excursion balance test: analyses of subjects with and without chronic ankle instability. J Orthop Sports Phys Ther
2006;36(3):131-7.
22. Olmsted LC, Carcia CR, Hertel J, et al. Efficacy of the Star Excursion Balance Tests in Detecting Reach Deficits in Subjects With Chronic Ankle Instability. J Athl Train 2002;37(4):501-06.
23. Nakagawa L, Hoffman M. Performance in static, dynamic, and clinical tests of postural control in individuals with recurrent ankle sprains. Journal of Sport Rehabilitation 2004;13(3):255-68.
24. de la Motte S, Arnold BL, Ross SE. Trunk-rotation differences at maximal reach of the star excursion balance test in participants with chronic ankle instability. J Athl Train
2015;50(4):358-65.
25. Pozzi F, Moffat M, Gutierrez G. Neuromuscular Control during Performance of a Dynamic Balance Task in Subjects with and without Ankle Instability. Int J Sports Phys Ther 2015;10(4):520-9.
26. Choi HS, Shin WS. Postural control systems in two different functional movements: a comparison of subjects with and without chronic ankle instability. J Phys Ther Sci 2016;28(1):102-6.
28. Hoch MC, Farwell KE, Gaven SL, et al. Weight-Bearing Dorsiflexion Range of Motion and Landing Biomechanics in Individuals With Chronic Ankle Instability. J Athl Train 2015;50(8):833-9.
29. De Ridder R, Willems T, Vanrenterghem J, et al. Multi-segment foot landing kinematics in subjects with chronic ankle instability. Clin Biomech (Bristol, Avon) 2015;30(6):585-92. 30. Caulfield BM, Garrett M. Functional instability of the ankle: differences in patterns of ankle
and knee movement prior to and post landing in a single leg jump. Int J Sports Med 2002;23(1):64-8.
31. Caulfield B, Garrett M. Changes in ground reaction force during jump landing in subjects with functional instability of the ankle joint. Clin Biomech (Bristol, Avon)
2004;19(6):617-21.
32. De Ridder R, Willems T, Vanrenterghem J, et al. Lower limb landing biomechanics in subjects with chronic ankle instability. Med Sci Sports Exerc 2015;47(6):1225-31. 33. Brown CN, Ko J, Rosen AB, et al. Individuals with both perceived ankle instability and
mechanical laxity demonstrate dynamic postural stability deficits. Clin Biomech (Bristol, Avon) 2015.
34. Gribble P, Robinson R. Differences in spatiotemporal landing variables during a dynamic stability task in subjects with CAI. Scand J Med Sci Sports 2010;20(1):e63-71. 35. Wikstrom EA, Tillman MD, Borsa PA. Detection of dynamic stability deficits in subjects
with functional ankle instability. Med Sci Sports Exerc 2005;37(2):169-75.
36. Ross SE, Guskiewicz KM, Yu B. Single-leg jump-landing stabilization times in subjects with functionally unstable ankles. J Athl Train 2005;40(4):298-304.
37. Gribble PA, Robinson RH. Alterations in knee kinematics and dynamic stability associated with chronic ankle instability. J Athl Train 2009;44(4):350-5.
38. Ross SE, Guskiewicz KM. Examination of static and dynamic postural stability in individuals with functionally stable and unstable ankles. Clin J Sport Med 2004;14(6):332-8.
39. Liu K, Glutting J, Wikstrom E, et al. Examining the diagnostic accuracy of dynamic postural stability measures in differentiating among ankle instability status. Clin Biomech (Bristol, Avon) 2013;28(2):211-7.
41. Brown CN, Padua DA, Marshall SW, et al. Variability of motion in individuals with mechanical or functional ankle instability during a stop jump maneuver. Clin Biomech (Bristol, Avon) 2009;24(9):762-8.
42. Delahunt E, Monaghan K, Caulfield B. Changes in lower limb kinematics, kinetics, and muscle activity in subjects with functional instability of the ankle joint during a single leg drop jump. J Orthop Res 2006;24(10):1991-2000.
43. Rosen A, Swanik C, Thomas S, et al. Differences in lateral drop jumps from an unknown height among individuals with functional ankle instability. J Athl Train 2013;48 (6):773-81.
44. Terada M, Pietrosimone B, Gribble PA. Individuals with chronic ankle instability exhibit altered landing knee kinematics: potential link with the mechanism of loading for the anterior cruciate ligament. Clin Biomech (Bristol, Avon) 2014;29(10):1125-30.
45. Padua DA, Marshall SW, Boling MC, et al. The Landing Error Scoring System (LESS) Is a valid and reliable clinical assessment tool of jump-landing biomechanics: The JUMP-ACL study. Am J Sports Med 2009;37(10):1996-2002.
46. Padua DA, DiStefano LJ, Beutler AI, et al. The Landing Error Scoring System as a Screening Tool for an Anterior Cruciate Ligament Injury-Prevention Program in Elite-Youth Soccer Athletes. J Athl Train 2015;50(6):589-95.
47. Doherty C, Delahunt E, Caulfield B, et al. The incidence and prevalence of ankle sprain injury: a systematic review and meta-analysis of prospective epidemiological studies. Sports Med 2014;44(1):123-40.
48. Soboroff SH, Pappius EM, Komaroff AL. Benefits, risks, and costs of alternative approaches to the evaluation and treatment of severe ankle sprain. Clin Orthop Relat Res
1984(183):160-8.
49. Konradsen L, Bech L, Ehrenbjerg M, et al. Seven years follow-up after ankle inversion trauma. Scand J Med Sci Sports 2002;12(3):129-35.
50. Hintermann B, Boss A, Schafer D. Arthroscopic findings in patients with chronic ankle instability. Am J Sports Med 2002;30(3):402-9.
51. Sugimoto K, Takakura Y, Okahashi K, et al. Chondral injuries of the ankle with recurrent lateral instability: an arthroscopic study. J Bone Joint Surg Am 2009;91(1):99-106. 52. Valderrabano V, Hintermann B, Horisberger M, et al. Ligamentous posttraumatic ankle
53. Lee M, Kwon JW, Choi WJ, et al. Comparison of Outcomes for Osteochondral Lesions of the Talus With and Without Chronic Lateral Ankle Instability. Foot Ankle Int
2015;36(9):1050-7.
54. Golditz T, Steib S, Pfeifer K, et al. Functional ankle instability as a risk factor for
osteoarthritis: using T2-mapping to analyze early cartilage degeneration in the ankle joint of young athletes. Osteoarthritis Cartilage 2014;22(10):1377-85.
55. Hertel J. Functional Anatomy, Pathomechanics, and Pathophysiology of Lateral Ankle Instability. J Athl Train 2002;37(4):364-75.
56. Hiller CE, Kilbreath SL, Refshauge KM. Chronic ankle instability: evolution of the model. J Athl Train 2011;46(2):133-41.
57. Hertel J. Sensorimotor deficits with ankle sprains and chronic ankle instability. Clin Sports Med 2008;27(3):353-70, vii.
58. Gribble PA, Delahunt E, Bleakley C, et al. Selection criteria for patients with chronic ankle instability in controlled research: a position statement of the International Ankle
Consortium. J Orthop Sports Phys Ther 2013;43(8):585-91.
59. Wikstrom EA, Brown CN. Minimum reporting standards for copers in chronic ankle instability research. Sports Med 2014;44(2):251-68.
60. Ekstrand J, Gillquist J. Soccer injuries and their mechanisms: a prospective study. Med Sci Sports Exerc 1983;15(3):267-70.
61. Liu K P-DP, Kaminski TW. Examining Relative Risk Ratios Between Measures of Dynamic Stability and Ankle Sprain in a Collegiate Athletic Population. J Athl Train
2015;50(6(Supplement)).
62. Hubbard TJ, Kramer LC, Denegar CR, et al. Correlations among multiple measures of functional and mechanical instability in subjects with chronic ankle instability. J Athl Train 2007;42(3):361-6.
63. Plisky PJ, Rauh MJ, Kaminski TW, et al. Star Excursion Balance Test as a predictor of lower extremity injury in high school basketball players. J Orthop Sports Phys Ther
2006;36(12):911-9.
64. Fusionetics. Fusionetics Home. Secondary Fusionetics Home 2016.
http://www.fusionetics.com/.
66. Onate J, Cortes N, Welch C, et al. Expert versus novice interrater reliability and criterion validity of the landing error scoring system. J Sport Rehabil 2010;19(1):41-56. 67. PhysiMax. Real-Time Athletic Movement Assessment. Secondary Real-Time Athletic
Movement Assessment 2015. http://pmax.co.
68. Mauntel TP, DA; Stanley, LE. Automated Quantification of the Landing Error Scoring System with a Markerless Motion Capture System.
69. Simon J, Donahue M, Docherty C. Development of the Identification of Functional Ankle Instability (IdFAI). Foot Ankle Int 2012;33(9):755-63.
70. Gurav RS, Ganu SS, Panhale VP. Reliability of the Identification of Functional Ankle Instability (IdFAI) Scale Across Different Age Groups in Adults. N Am J Med Sci 2014;6(10):516-8.
71. Carcia CR, Martin RL, Drouin JM. Validity of the Foot and Ankle Ability Measure in athletes with chronic ankle instability. J Athl Train 2008;43(2):179-83.
72. Martin RL, Irrgang JJ, Burdett RG, et al. Evidence of validity for the Foot and Ankle Ability Measure (FAAM). Foot Ankle Int 2005;26(11):968-83.