Eric A. Brewer
University of California, Berkeley, and Inktomi Corporation
Lessons from
Giant-Scale Services
Giant Web services require new tools and methods for issues
of scale, availability, and evolution.
W
eb portals and ISPs such asAOL, Microsoft Network, and Yahoo have grown more than tenfold in the past five years. Despite their scale, growth rates, and rapid evo-lution of content and features, these sites and other “giant-scale” services like instant messaging and Napster must be always available. Many other major Web sites such as eBay, CNN, and Wal-Mart, have similar availability requirements. In this article, I look at the basic model for such services, focusing on the key real-world challenges they face — high avail-ability, evolution, and growth — and developing some principles for attacking these problems.
This is very much an “experience” arti-cle. Few of the points I make here are addressed in the literature, and most of my conclusions take the form of principles and approaches rather than absolute quantita-tive evaluations. This is due partly to my focus on high-level design, partly to the newness of the area, and partly to the pro-prietary nature of some of the information (which represents 15-20 very large sites). Nonetheless, the lessons are easy to under-stand and apply, and they simplify the design of large systems.
The Basic Model
I focus on “infrastructure services” — Internet-based systems that provide instant messaging, wireless services such as iMode, and so on. These services pri-marily reside remotely from the user, although they might include local access software, such as a browser. My discus-sion is limited primarily to single-site, single-owner, well-connected clusters, which may be part of a larger service, as in the case of e-mail servers. I do not cover wide-area issues such as network partitioning, low or intermittent band-width, or multiple administrative domains. There are many other important challenges that I do not address here, including service monitoring and config-uration, network quality of service (QoS), security, and logging and log analysis.
This article is essentially about bridg-ing the gap between the basic buildbridg-ing blocks of giant-scale services and the real-world scalability and availability they require. It focuses on high availability and the related issues of replication, graceful degradation, disaster tolerance, and online evolution.
Database management systems (DBMs) are an important part of many large sites,
Scalable Internet Services
Copyright 2001, IEEE Computer
Do not distribute.
but I intentionally ignore them here because they are well studied elsewhere and because the issues in this article are largely orthogonal to the use of databases.
Advantages
The basic model that giant-scale services follow provides some fundamental advantages:
■ Access anywhere, anytime. A ubiquitous infra-structure facilitates access from home, work, airport, and so on.
■ Availability via multiple devices. Because the infrastructure handles most of the processing, users can access services with devices such as set-top boxes, network computers, and smart phones, which can offer far more functionali-ty for a given cost and battery life.
■ Groupware support. Centralizing data from many users allows service providers to offer group-based applications such as calendars, tele-conferencing systems, and group-management systems such as Evite (http://www.evite.com/).
■ Lower overall cost. Although hard to measure, infrastructure services have a fundamental cost advantage over designs based on stand-alone devices. Infrastructure resources can be multi-plexed across active users, whereas end-user devices serve at most one user (active or not). Moreover, end-user devices have very low uti-lization (less than 4 percent), while infrastruc-ture resources often reach 80 percent utiliza-tion. Thus, moving anything from the device to the infrastructure effectively improves effi-ciency by a factor of 20. Centralizing the administrative burden and simplifying end devices also reduce overall cost, but are harder to quantify.
■ Simplified service updates. Perhaps the most powerful long-term advantage is the ability to upgrade existing services or offer new services without the physical distribution required by traditional applications and devices. Devices such as Web TVs last longer and gain useful-ness over time as they benefit automatically from every new Web-based service.
Components
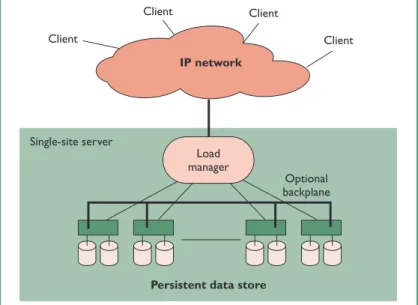
Figure 1 shows the basic model for giant-scale sites. The model is based on several assumptions. First, I assume the service provider has limited control over the clients and the IP network. Greater control might be possible in some cases, however, such as with intranets. The model also
assumes that queries drive the service. This is true for most common protocols including HTTP, FTP, and variations of RPC. For example, HTTP’s basic primitive, the “get” command, is by definition a query. My third assumption is that read-only queries greatly outnumber updates (queries that affect the persistent data store). Even sites that we tend to think of as highly transactional, such as e-commerce or financial sites, actually have this type of “read-mostly” traffic1: Product evaluations
(reads) greatly outnumber purchases (updates), for example, and stock quotes (reads) greatly out-number stock trades (updates). Finally, as the side-bar, “Clusters in Giant-Scale Services” (next page) explains, all giant-scale sites use clusters.
The basic model includes six components:
■ Clients, such as Web browsers, standalone e-mail readers, or even programs that use XML and SOAP initiate the queries to the services.
■ The best-effort IP network, whether the public Internet or a private network such as an intranet, provides access to the service.
■ The load managerprovides a level of indirection between the service’s external name and the servers’ physical names (IP addresses) to preserve the external name’s availability in the presence of server faults. The load manager balances load among active servers. Traffic might flow through proxies or firewalls before the load manager.
■ Serversare the system’s workers, combining CPU, memory, and disks into an easy-to-repli-cate unit.
Client Client
Client
Load manager
Persistent data store
Client
IP network
Single-site server
Optional backplane
Figure 1.The basic model for giant-scale services. Clients connect via the Internet and then go through a load manager that hides down nodes and balances traffic.
■ The persistent data storeis a replicated or par-titioned “database” that is spread across the servers’ disks. It might also include network-attached storage such as external DBMSs or systems that use RAID storage.
■ Many services also use a backplane. This
optional system-area-network handles inter-server traffic such as redirecting client queries to the correct server or coherence traffic for the persistent data store.
Nearly all services have several other service-spe-cific auxiliary systems such as user-profile data-bases, ad servers, and site management tools, but we can ignore these in the basic model.
Load Management
Load management has seen rapid improvement since around 1995. The original approach used “round-robin DNS,” which distributes different IP addresses for a single domain name among clients in a rotating fashion. Although this
approach balances load well, it does not hide inactive servers; a client with a down node’s address will continue to try to use it until the DNS mapping expires, which might take several hours. (Short “time-to-live” settings have short-er outages, but require the client to make more DNS lookups.) Many browsers exacerbate the problem by mishandling DNS expiration.
Fortunately, many vendors now sell “layer-4” switches to solve load management (for example, Cisco’s CSS 11800 content switch, F5 Networks’ Big-IP enterprise switch, and Foundry Networks’ ServerIron Web switch). Such transport-layer switches understand TCP and port numbers, and can make decisions based on this information. Many of these are “layer-7” (application layer) switches, in that they understand HTTP requests and can actually parse URLs at wire speed. The switches typically come in pairs that support hot failover — the ability for one switch to take over for another automatically — to avoid the obvious single point of failure, and can handle throughputs
Clusters are collections of commodity servers that work together on a single problem. Giant-scale services use clusters to meet scalability requirements that exceed those of any single machine.Table A shows some representative clusters and their traffic.
Other examples include some of Exo-dus Communications’ data centers, which house several thousand nodes that support hundreds of different services; and AOL’s recently added US$520 million data center, which is larger than three football fields and filled almost entirely with clusters. Although I assume that all giant-scale ser-vices use clusters, it is useful to review the driving forces behind their use.
■ Absolute scalability.A successful
net-work service must scale to support a substantial fraction of the world’s population. Users spend increasingly more time online each day, and analysts predict that about 1.1 billion people will have some form of infrastructure access within the next 10 years.
■ Cost and performance. Although a traditionally compelling reason for using clusters, hardware cost and performance are not really issues for giant-scale services. No alternative to clusters can match the required scale, and hardware cost is typically dwarfed by bandwidth and operational costs.
■ Independent components. Users expect 24-hour service from systems that consist of thousands of hardware and
software components. Transient hardware failures and software faults due to rapid system evolution are inevitable, but clusters simplify the problem by providing (largely) independent faults.
■ Incremental scalability. Clusters should allow for scaling services as needed to account for the uncertainty and expense of growing a service. Nodes have a three-year depreciation lifetime, for example, and should generally be replaced only when they no longer justify their rack space compared to new nodes. Given Moore’s law, a unit of rack space should quadruple in computing power over three years, and actual increases appear to be faster due to improvements in packaging and disk size.
Given these advantages, we view commodi-ty nodes as the basic building blocks for giant-scale services. The goal is then to exploit these advantages, particularly inde-pendent faults and incremental scalability, into our higher-level goals of availability, graceful degradation, and ease of evolution.
Clusters in Giant-Scale Services
Table A. Example clusters for giant-scale services.
Service Nodes Queries Nodes
AOL Web cache >1,000 10B/day 4-CPU DEC 4100s Inktomi search engine >1,000 >80M/day 2-CPU Sun Workstations Geocities >300 >25M/day PC Based
above 20 Gbits per second. They detect down nodes automatically, usually by monitoring open TCP connections, and thus dynamically isolate down nodes from clients quite well.
Two other load-management approaches are typically employed in combination with layer-4 switches. The first uses custom “front-end” nodes that act as service-specific layer-7 routers (in soft-ware).2 Wal-Mart’s site uses this approach, for
example, because it helps with session manage-ment: Unlike switches, the nodes track session information for each user.
The final approach includes clients in the load-management process when possible. This general “smart client” end-to-end approach goes beyond the scope of a layer-4 switch.3It greatly simplifies
switching among different physical sites, which in turn simplifies disaster tolerance and overload recovery. Although there is no generic way to do this for the Web, it is common with other systems. In DNS, for instance, clients know about an alter-native server and can switch to it if the primary disappears; with cell phones this approach is implemented as part of roaming; and application servers in the middle tier of three-tier database systems understand database failover.
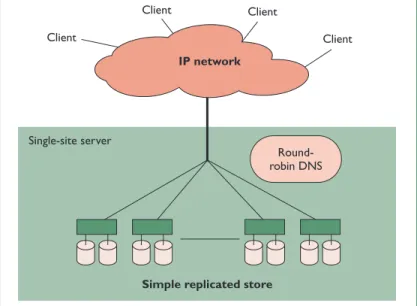
Figures 2 and 3 illustrate systems at opposite ends of the complexity spectrum: a simple Web farm and a server similar to the Inktomi search engine cluster. These systems differ in load management, use of a backplane, and persistent data store.
The Web farm in Figure 2 uses round-robin DNS for load management. The persistent data store is implemented by simply replicating all con-tent to all nodes, which works well with a small amount of content. Finally, because all servers can handle all queries, there is no coherence traffic and no need for a backplane. In practice, even simple Web farms often have a second LAN (back-plane) to simplify manual updates of the replicas. In this version, node failures reduce system capac-ity, but not data availability.
In Figure 3, a pair of layer-4 switches manages the load within the site. The “clients” are actually other programs (typically Web servers) that use the smart-client approach to failover among different physical clusters, primarily based on load.
Because the persistent store is partitioned across servers, possibly without replication, node failures could reduce the store’s effective size and overall capacity. Furthermore, the nodes are no longer identical, and some queries might need to be directed to specific nodes. This is typically accomplished using a layer-7 switch to parse
URLs, but some systems, such as clustered Web caches, might also use the backplane to route requests to the correct node.4
High Availability
High availability is a major driving requirement behind giant-scale system design. Other
infra-Client Client
Client
Round-robin DNS
Simple replicated store
Client
IP network
Single-site server
Figure 2. A simple Web farm. Round-robin DNS assigns different servers to different clients to achieve simple load balancing. Persis-tent data is fully replicated and thus all nodes are identical and can handle all queries.
Program Program
Program
Load manager
Partitioned data store
Program
IP network
Single-site server
Myrinet backplane
Figure 3. Search engine cluster. The service provides support to other programs (Web servers) rather than directly to end users.These pro-grams connect via layer-4 switches that balance load and hide faults. Persistent data is partitioned across the servers, which increases aggregate capacity but implies there is some data loss when a server is down. A backplane allows all nodes to access all data.
structures — such as the telephone, rail, and water systems — aim for perfect availability, a goal that should apply to IP-based infrastructure services as well. All these systems plan for component failures and natural disasters, but information systems must also deal with constantly evolving features and unpredictable growth.
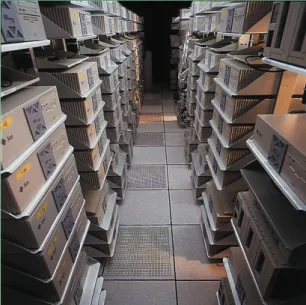
Figure 4 shows a cluster designed for high availability: It features extreme symmetry, no peo-ple, very few cables, almost no external disks, and no monitors. Each of these design features reduces the number of failures in practice. In addition, Ink-tomi manages the cluster from offsite, and con-tracts limit temperature and power variations.
Availability Metrics
The traditional metric for availability is uptime, which is the fraction of time a site is handling traf-fic. Uptime is typically measured in nines, and tra-ditional infrastructure systems such as the phone system aim for four or five nines (“four nines” implies 0.9999 uptime, or less than 60 seconds of downtime per week). Two related metrics are mean-time-between-failure (MTBF) and mean-time-to-repair (MTTR). We can think of uptime as:
uptime = (MTBF – MTTR)/MTBF (1)
Following this equation, we can improve uptime either by reducing the frequency of failures or reducing the time to fix them. Although the for-mer is more pleasing aesthetically, the latter is much easier to accomplish with evolving systems.
For example, to see if a component has an MTBF of one week requires well more than a week of testing under heavy realistic load. If the compo-nent fails, you have to start over, possibly repeat-ing the process many times. Conversely, measur-ing the MTTR takes minutes or less and achievmeasur-ing a 10-percent improvement takes orders of magni-tude less total time because of the very fast debug-ging cycle. In addition, new features tend to reduce MTBF but have relatively little impact on MTTR, which makes it more stable. Thus, giant-scale sys-tems should focus on improving MTTR and simply apply best effort to MTBF.
We define yieldas the fraction of queries that are completed:
yield = queries completed/queries offered (2) Numerically, this is typically very close to uptime, but it is more useful in practice because it directly maps to user experience and because it correctly reflects that not all seconds have equal value. Being down for a second when there are no queries has no impact on users or yield, but reduces uptime. Similarly, being down for one second at peak and off-peak times generates the same uptime, but vastly different yields because there might be an order-of-magnitude difference in load between the peak second and the minimum-load second. Thus we focus on yield rather than uptime. Because these systems are typically based on queries, we can also measure query completeness — how much of the database is reflected in the answer. We define this fraction as the harvestof the query:
harvest = data available/complete data (3) A perfect system would have 100 percent yield and 100 percent harvest. That is, every query would complete and would reflect the entire data-base. Similarly, we can extend this idea to the fraction of features available; systems such as eBay can have some features, such as seller pro-files, unavailable while the rest of the site works perfectly.
The key insight is that we can influence whether faults impact yield, harvest, or both. Replicated systems tend to map faults to reduced capacity (and to yield at high utilizations), while partitioned systems tend to map faults to reduced harvest, as parts of the database temporarily dis-appear, but the capacity in queries per second remains the same.
Figure 4. 100-node 200-CPU cluster. Key design points include extreme symmetry, internal disks, no people, no monitors, and no visible cables.
DQ Principle
The DQ Principle is simple:
Data per query ×queries per second →constant (4) This is a principle rather than a literal truth, but it is remarkably useful for thinking about giant-scale systems. The intuition behind this principle is that the system’s overall capacity tends to have a par-ticular physical bottleneck, such as total I/O band-width or total seeks per second, which is tied to data movement. The DQ value is the total amount of data that has to be moved per second on aver-age, and it is thus bounded by the underlying physical limitation. At the high utilization level typical of giant-scale systems, the DQ value approaches this limitation.
Various systems have used versions of this principle for a long time. For example, the query optimizer in System R used the number of I/O operations as the metric of optimization.5The DQ
principle focuses more on bandwidth than on the number of I/Os (or seeks) — mainly because I have found that it correlates better with capaci-ty and seems easier to affect gracefully. On a more intuitive level, service work corresponds to the amount of data moved because of data copy-ing, presentation layers, and the many indepen-dent connections that tend to make these sys-tems more network-bound than disk-bound. Also, the workload distribution tends to be fair-ly stable overall because of the scale (we are aggregating over thousands of connections), which means the ratio of bandwidth to I/Os is fairly consistent. Thus, either would be a good metric for most systems.
The DQ value is measurable and tunable. Adding nodes or implementing software optimizations increases the DQ value, while the presence of faults reduces it. The absolute value is not typically that important, but the relative value under various changes is very predictive. Thus, the first step is to define the specific DQ metric for the service by defining the target workload and using a load gen-erator to measure a given combination of hardware, software, and database size against this workload. Every node has a DQ capacity that depends on this combination. Different nodes might have different values if they were bought separately; knowing the relative DQ values tells you how unevenly to do partitioning or load balancing.
Given the metric and load generator, it is then easy to measure the (relative) DQ impact of faults,
database sizes, and hardware and software upgrades. Overall, DQ normally scales linearly with the number of nodes, which means a small test cluster is a good predictor for DQ changes on the production system. For example, Inktomi has been able to use four-node clusters to predict per-formance improvements on 100-node clusters due to software optimizations. The DQ impact can and should be evaluated for all proposed hardware and software changes prior to deployment. Similarly, the best case under multiple node faults is a linear reduction in overall DQ.
We can translate future traffic predictions into future DQ requirements and thus into hardware and software targets. This lets us convert traffic predictions into capacity planning decisions, tak-ing into account any expected hardware or soft-ware improvements.
In terms of availability, these principles are espe-cially valuable for analyzing fault impact. As I mentioned, the best we can do is
to degrade DQ linearly with the number of (node) faults. The design goal for high availability is thus to control how DQ reduc-tions affect our three availability metrics. The obvious limit of this principle is that it is for data-intensive sites. Computation-bound sites (such as simulation engines) or sites with long-laten-cy external actions (such as chat sites) behave differently. The vast
majority of the top 100 sites are data intensive, however, which is not surprising given that the Internet is primarily a communication medium.
Replication vs. Partitioning
Replication is a traditional technique for increas-ing availability, and I will compare it to parti-tioning from the perspective of DQ and our availability metrics. Consider a two-node clus-ter: The replicated version has traditionally been viewed as “better” because it maintains 100 per-cent harvest under a fault, whereas the parti-tioned version drops to 50 percent harvest. Dual analysis shows that the replicated version drops to 50 percent yield, however, while the parti-tioned version remains at 100 percent yield. Fur-thermore, both versions have the same initial DQ value and lose 50 percent of it under one fault: Replicas maintain D and reduce Q (and thus yield), while partitions keep Q constant and reduce D (and thus harvest).
Absolute value is
not typically that
important, but
relative value is
very predictive.
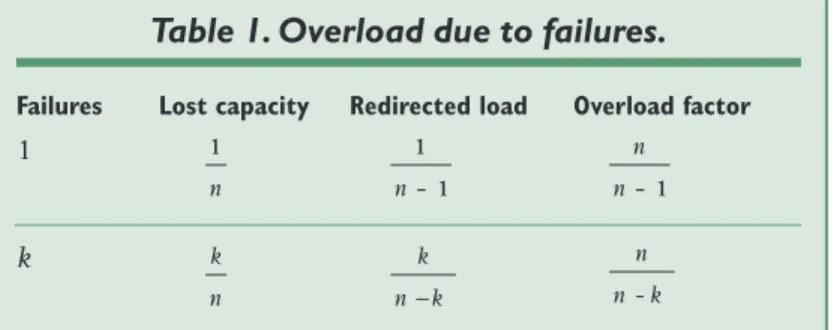
The traditional view of replication silently assumes that there is enough excess capacity to prevent faults from affecting yield. We refer to this as the load redirection problem because under faults, the remaining replicas have to handle the queries formerly handled by the failed nodes. Under high utilization, this is unrealistic.
Table 1 generalizes this analysis to replica groups with nnodes. Losing two of five nodes in a replica group, for example, implies a redirected load of 2/3 extra load (two loads spread over three remaining nodes) and an overload factor for those nodes of 5/3 or 166 percent of normal load.
The key insight is that replication on disk is cheap, but accessing the replicated data requires DQ points. For true replication you need not only another copy of the data, but also twice the DQ value. Conversely, partitioning has no real savings over replication. Although you need more copies of the data with replication, the real cost is in the DQ bottleneck rather than storage space, and the DQ constant is independent of whether the data-base is replicated or partitioned. An important exception to this is that replication requires more DQ points than partitioning for heavy write traf-fic, which is rare in giant-scale systems.
According to these principles, you should always use replicas above some specified through-put. In theory, you can always partition the data-base more thinly and avoid the extra replicas, but with no DQ difference, it makes more sense to replicate the data once the partitions are a conve-nient size. You will enjoy more control over har-vest and support for disaster recovery, and it is easier to grow systems via replication than by repartitioning onto more nodes.
We can vary the replication according to the data’s importance, and generally control which data is lost in the presence of a fault. For example, for the cost of some extra disk space we can repli-cate key data in a partitioned system. Under nor-mal use, one node handles the key data and the rest provide additional partitions. If the main node fails, we can make one of the other nodes serve the
key data. We still lose 1/nof the data, but it will always be one of the less important partitions. This combined approach preserves the key data, but also allows us to use our “replicated” DQ capacity to serve other content during normal operation.
Finally, we can exploit randomization to make our lost harvest a random subset of the data, (as well as to avoid hot spots in partitions). Many of the load-balancing switches can use a (pseudo-random) hash function to partition the data, for example. This makes the average and worst-case losses the same because we lose a random subset of “average” value. The Inktomi search engine uses partial replication; e-mail systems use full replica-tion; and clustered Web caches use no replication. All three use randomization.
Graceful Degradation
It would be nice to believe that we could avoid sat-uration at a reasonable cost simply by good design, but this is unrealistic for three major reasons.
■ The peak-to-average ratio for giant-scale sys-tems seems to be in the range of 1.6:1 to 6:1, which can make it expensive to build out capacity well above the (normal) peak.
■ Single-event bursts, such as online ticket sales for special events, can generate far above-aver-age traffic. In fact, moviephone.com added 10x capacity to handle tickets for “Star Wars: The Phantom Menace” and still got overloaded.
■ Some faults, such as power failures or natural disasters, are not independent. Overall DQ drops substantially in these cases, and the remaining nodes become saturated.
Given these facts, mechanisms for graceful degra-dation under excess load are critical for delivering high availability. The DQ principle gives us new options for graceful degradation: We can either limit Q (capacity) to maintain D, or we can reduce D and increase Q. We can focus on harvest through admission control (AC), which reduces Q, or on yield through dynamic database reduction, which reduces D, or we can use a combination of the two. Temporarily cutting the effective database size in half, for instance, should roughly double our capacity. Some giant-scale services have just start-ed applying the latter strategy.
The larger insight is that graceful degradation is simply the explicit process for managing the effect of saturation on availability; that is, we explicitly decide how saturation should affect uptime, harvest, and quality of service. Here are
Table 1. Overload due to failures.
Failures Lost capacity Redirected load Overload factor
1
k
1
n
1 1
n
-n n- 1
k n
k n−k
n n-k
some more sophisticated examples taken from real systems:
■ Cost-based AC.Inktomi can perform AC based on the estimated query cost (measured in DQ). This reduces the average data required per query, and thus increases Q. Note that the AC policy affects both D and Q. Denying one expensive query could thus enable several inexpensive ones, giving us a net gain in har-vest and yield. (Although I know of no exam-ples, AC could also be done probabilistically — perhaps in the style of lottery scheduling, so that retrying hard queries eventually works.)
■ Priority- or value-based AC. Datek handles stock trade requests differently from other queries and guarantees that they will be exe-cuted within 60 seconds, or the user pays no commission. The idea is to reduce the required DQ by dropping low-value queries, indepen-dently of their DQ cost.
■ Reduced data freshness. Under saturation, a financial site can make stock quotes expire less frequently. This reduces freshness but also reduces the work per query, and thus increas-es yield at the expense of harvincreas-est. (The cached queries don’t reflect the current database and thus have lower harvest.)
As you can see, the DQ principle can be used as a tool for designing how saturation affects our availability metrics. We first decide which met-rics to preserve (or at least focus on), and then we use sophisticated AC to limit Q and possibly reduce the average D. We also use aggressive caching and database reduction to reduce D and thus increase capacity.
Disaster Tolerance
Disaster tolerance is a simple combination of man-aging replica groups and graceful degradation. A disaster can be defined as the complete loss of one or more replicas. Natural disasters can affect all the replicas at one physical location, while other disasters such as fires or power failures might affect only one replica.
Under the giant-scale services model, the basic question is how many locations to establish and how many replicas to put at each. To examine the load redirection problem, I return to Table 1. With two replicas at each of three locations, for exam-ple, we expect to lose 2/6 of the replicas during a natural disaster, which implies that each of the
remaining sites must handle 50 percent more traf-fic. This will almost certainly saturate the site, which will employ graceful-degradation tech-niques to recover. For Inktomi, the best plan would be to dynamically reduce D by 2/3 (to get 3/2 Q) on the remaining replicas. The current plan actu-ally reduces D to 50 percent for any disaster, which is simpler, but not as aggressive.
Load managementpresents a harder problem for disaster recovery. Layer-4 switches do not help with the loss of whole clusters, so the external site name might become unavailable during a disaster. In that case, you must resort to DNS changes or smart clients to redirect traffic to the other repli-cas. As I mentioned, however, DNS might have a very slow failover response time of up to several hours. With a smart-client approach, clients can perform the higher-level redirection automatical-ly and immediateautomatical-ly, which seems the most com-pelling reason to use smart clients.
Online Evolution and Growth
One of the traditional tenets of highly available systems is minimal change. This directly conflicts with both the growth rates of giant-scale services and “Internet time” — the practice of frequent product releases. For these services, we must plan for continuous growth and frequent functionality updates. Worse still, the frequency of updates means that in practice, software is never perfect; hard-to-resolve issues such as slow memory leaks and nondeterministic bugs tend to remain unfixed. The prevailing design philosophy aims to make the overall system tolerant of individual node failures and to avoid cascading failures. Thus, “acceptable” quality comes down to soft-ware that provides a target MTBF, a low MTTR, and no cascading failures.We can think of maintenance and upgrades as controlled failures, and the “online evolution” process — completing upgrades without taking down the site — is important because giant-scale services are updated so frequently. By viewing online evolution as a temporary, controlled reduction in DQ value, we can act to minimize the impact on our availability metrics. In gener-al, online evolution requires a fixed amount of time per node, u, so that the total DQ loss for n
nodes is:
∆DQ = n· u· average DQ/node = DQ · u (5) That is, the lost DQ value is simply the total DQ value multiplied by the upgrade time per node.
Upgrade time is essentially recovery time, and depends on the kind of change. Software upgrades are most common and can be handled quickly with a staging area, which allows both the new and old versions to coexist on the node. System administrators can do a controlled reboot (at worst) to upgrade the node within the normal MTTR. Without sufficient workspace, the down-time is much greater because the administrator must move the new version onto the node while the system is down. Staging also simplifies return-ing to the old version, which is helpful because live traffic tends to expose new bugs. Other upgrades, such as hardware, operating system, database schema, or repartitioning, require significantly more downtime.
Three main approaches are used for online evolution:
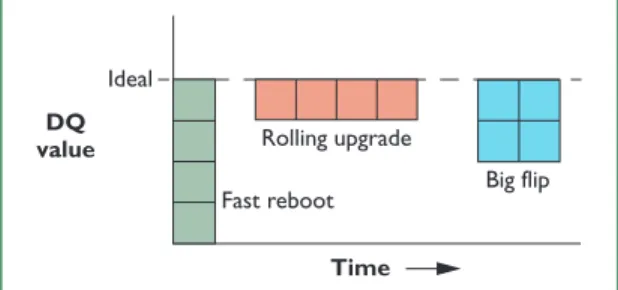
■ Fast reboot.The simplest approach is to quick-ly reboot all nodes into the new version. The fast reboot is straightforward, but it guarantees some downtime. Thus, it is more useful to mea-sure lost yield rather than downtime. By upgrading during off-peak hours, we can reduce the yield impact. In practice, this requires a staging area because the upgrades all occur at the same time and thus need to be highly automated.
■ Rolling upgrade.In this approach, we upgrade nodes one at a time in a “wave” that rolls through the cluster. This minimizes the overall impact because only one node is down at a time. In a partitioned system, harvest will be reduced during the nupgrade windows, but in a replicated system we expect 100 percent yield and 100 percent harvest because we can update one replica at a time, and we probably have enough capacity (in off hours) to prevent lost yield. One disadvantage with the rolling upgrade is that the old and new versions must
be compatible because they will coexist. Exam-ples of incompatible versions include changes to schema, namespaces, or (intracluster) proto-cols. Neither of the other two approaches has this restriction.
■ Big flip.The final approach is the most com-plicated. The basic idea is to update the clus-ter one half at a time by taking down and upgrading half the nodes at once. During the “flip,” we atomically switch all traffic to the upgraded half using a layer-4 switch. After waiting for connections to the old half to dis-sipate (the switch only affects new connec-tions), we then upgrade the second half and bring those nodes back into use. As with fast reboot, only one version runs at a time. Note that the 50 percent DQ loss can be translated into either 50 percent capacity for replicas (which might be 100 percent off-peak yield) or 50 percent harvest for partitions.
The big flip is quite powerful and can be used for all kinds of upgrades, including hardware, OS, schema, networking, and even physical relocation. When used for relocating a cluster, the big flip must typically use DNS changes, and the upgrade time includes physically moving the nodes, which means the window of 50 percent DQ loss might last several hours. This is manageable over a week-end, however, and Inktomi has done it twice: first, when moving about 20 nodes from Berkeley to Santa Clara, California, (about an hour apart) using DNS for the flip; and second, when moving about 100 nodes between two cages in the same data center using a switch for the flip.
All three approaches have the same DQ loss (for a given upgrade), so we can plot their effective DQ level versus time, which is shown in Figure 5. The three regions have the same area, but the DQ loss is spread over time differently. All three approaches are used in practice, but rolling upgrades are eas-ily the most popular. The heavyweight big flip is reserved for more complex changes and is used only rarely. The approaches differ in their handling of the DQ loss and in how they deal with staging areas and version compatibility, but all three ben-efit from DQ analysis and explicit management of the impact on availability metrics.
Conclusions
From my experience with several giant-scale ser-vices, I have defined several tools for designing and analyzing giant-scale services. Starting with the basic architectural model leads to novel ways
Big flip Rolling upgrade
Fast reboot
Time DQ
value
Ideal
Figure 5.Three approaches to upgrades.The shad-ed regions map DQ loss (down from the ideal value) over time for a four-node cluster. Note that the area of the three regions is the same.
to think about high availability, including the DQ principle and the use of harvest and yield. Expe-rience has helped us develop several ways to con-trol the impact of faults through combinations of replication and partitioning. These tools are use-ful for graceuse-ful degradation, disaster tolerance, and online evolution.
I’ve learned several major lessons for develop-ing giant-scale services:
■ Get the basics right. Start with a professional data center and layer-7 switches, and use sym-metry to simplify analysis and management.
■ Decide on your availability metrics. Everyone should agree on the goals and how to measure them daily. Remember that harvest and yield are more useful than just uptime.
■ Focus on MTTR at least as much as MTBF. Repair time is easier to affect for an evolving system and has just as much impact.
■ Understand load redirection during faults. Data replication is insufficient for preserving uptime under faults; you also need excess DQ.
■ Graceful degradation is a critical part of a high-availability strategy. Intelligent admission control and dynamic database reduction are the key tools for implementing the strategy.
■ Use DQ analysis on all upgrades. Evaluate all proposed upgrades ahead of time, and do capacity planning.
■ Automate upgrades as much as possible. Develop a mostly automatic upgrade method, such as rolling upgrades. Using a staging area will reduce downtime, but be sure to have a fast, simple way to revert to the old version. These techniques seem to get to the core issues in practice and provide ways to think about avail-ability and fault tolerance that are predictable, analyzable, and measurable.
Current solutions are essentially ad hoc appli-cations of these ideas. Techniques for online
evo-lution and graceful degradation, for example, could be greatly automated. Similarly, future sys-tems could provide more direct ways to integrate simple application information, such as a query’s cost or value, into availability and load manage-ment mechanisms. Finally, better use of smart clients could simplify disaster recovery, online evolution, and graceful degradation.
References
1. A. Wolman et al., “On the Scale and Performance of Cooperative Web Proxy Caching,” Proc. 17th Symp. Operating Systems Principles 1999, ACM Press, New York, 1999, pp. 16-31.
2. A. Fox et al., “Cluster-Based Scalable Network Services,”
Proc. 16th Symp. Operating System Principles, ACM Press, New York, 1997, pp. 78-91.
3. C. Yoshikawa et al., “Using Smart Clients to Build Scalable Services,” Proc. Usenix Annual Technical Conf., Usenix Assoc., Berkeley, Calif., Jan. 1997.
4. Traffic Server Technical Specification, Inktomi Corpora-tion, Foster City, Calif., 2001; http://www.inktomi.com/ products/cns/products/tscclass.html.
5. M.M. Astrahan et al., “System R: A Relational Approach to Database Management,” ACM Trans. Database Systems, ACM Press, New York, June 1976, p. 97.
Eric A. Brewer is founder and Chief Scientist of Inktomi and an associate professor of computer science at UC Berkeley. He received a PhD in computer science from MIT. His research interests include mobile and wireless computing, scalable servers, and application- and system-level security. Brew-er founded the FedBrew-eral Search Foundation in 2000, which helped create the first U.S. government-wide portal, First-Gov.gov, for which he won the 2001 Federal CIO Council’s Azimuth Award.
Readers can contact the author at [email protected].
For further information on this or any other computing topic, please visit our Digital Library at http://computer.org/ publications/dlib/.