In PartnershIP wIth: wIth suPPort from:
a rePort by:
the Greenest building:
Quantifying the environmental
Value of building reuse
research Project team
Preservation Green Lab
Liz Dunn, Consulting Director, Preservation Green Lab Ric Cochran, Project Manager, Preservation Green Lab
CasCadia Green buiLdinG CounCiL
Katie Spataro, Research Director Jason F. McLennan, CEO
Green buiLdinG serviCes
Ralph DiNola, Principal
Nina Tallering, Senior Consultant
Eric McDaniel, Senior Technical Consultant
skanska
Dan Haas, Preconstruction Manager Beth Heider, Senior Vice President
Steve Clem, Vice President-Preconstruction
Quantis
Amanda Pike, Life Cycle Analyst Jon Dettling, Project Manager
Sebastien Humbert, Quality Control
Special thanks to Pascal Lesage, PhD at CIRAIG, a leading LCA research group housed at the University of Montréal’s École Polytechnique de Montréal, for his technical review of this document and to Mark Frankel, Technical Director of the New Buildings Institute, for his input on the study’s energy methodology and assumptions. Thank you also to Mike Jackson, Division Manager for the State of Illinois’ Preservation Services, and Martha Stevenson, independent consultant, for their helpful review of the study.
about the Project Partners
This research was made possible by a generous grant from the Summit Foundation to the National Trust for Historic Preservation. The project was coordinated by the Preservation Green Lab, a programmatic office of the National Trust.
Preservation Green Lab
(www.preservationnation.org/issues/sustainability/green-lab/)
Launched in March of 2009, the Seattle-based Preservation Green Lab advances research that explores the value that older buildings bring to their communities, and pioneers policy solutions that make it easier to reuse and green older and historic buildings. The Green Lab seeks to minimize carbon impacts from the built environment through direct emissions reductions from older building retrofits and reuse, and to conserve character-rich and human-scale communities that attract people to more sustainable, urban living patterns.
CasCadia Green buiLdinG CounCiL
(www.cascadiagbc.org)
Cascadia, the leading green building organization in the Pacific Northwest, is dedicated to making deep and lasting change within the building industry for positive environmental impact. A chapter of both the U.S. and Canada Green Building Councils, Cascadia is a cross-border education, research and advocacy organization that brings a bioregional approach to problem solving and market transformation. Cascadia is housed within the International Living Future Institute (ILFI), a U.S.-based NGO committed to catalyzing a global transfor-mation toward true sustainability.
Green buiLdinG serviCes
(www.greenbuildingservices.com)
Green Building Services (GBS) is a recognized leader in the global green building movement. Since 2000, GBS has provided consulting services to major corporations, institutions, developers and design professionals domestically and abroad. From individual buildings, to portfolios of buildings, new construction or existing facilities, GBS expertise spans the entire life cycle of the built environment. GBS consultants provide innovative solutions that benefit the triple bottom line including facilitation, training, LEED project management, energy audits, energy modeling, daylight analysis and commissioning.
skanska
(usa.skanska.com)
Skanska USA is one of the largest, most financially sound construction networks in the country serving a broad range of industries including healthcare, education, sports, data centers, government, aviation, transportation, and water/wastewater. Headquartered in New York with 35 offices across the country, Skanska USA employs approximately 7,000 employees who are committed to sustainable construction and an injury-free workplace.
Quantis
(www.quantis-intl.com)
Quantis is a leading life cycle assessment (LCA) consulting firm specialized in supporting companies to measure, understand and manage the environmental impacts of their prod-ucts, services and operations. Quantis is a global company with offices in the United States, Canada, Switzerland and France and employs close to 70 people, amongst which several are internationally renowned experts in the LCA field.
tabLe of contents
Executive Summary
VI
1. Introduction
13
2. Understanding Building Energy Use
16
operating energy of buildings 16
embodied energy of building 20
3.
Life Cycle Assessment Approach
22
4.
Study Approach and Methodology
25
Project Phases 25
LCa scope and Methodology 26
Life Cycle inventory data sources and assumptions 29
data Collection 30
key assumptions 30
sensitivity analysis 32
Methodology for determining building operating energy 34
LCa impact Categories 38
5. Case Study Scenarios
39
single-Family residential 39
Multifamily residential 44
urban village Mixed-use 49
Commercial office building 53
elementary schools 57
6.
Results and Key Findings
63
Index of terms
btu: british therMaL unit
Co2: Carbon dioxide
doQ: oreGon dePartMent oF environMentaL QuaLity
eeM: enerGy eFFiCienCy Measure
eoL: end-oF-LiFe
eia: us enerGy inForMation adMinistration
ePa: us environMentaL ProteCtion aGenCy
eui: enerGy use intensity
GhG: Greenhouse Gas eMissions
iCe: inventory oF Carbon eMissions
isC: internationaL orGanization For standardization
LCa: LiFe CyCLe assessMent
MJ: MeGaJouLe
nC: new ConstruCtion
reCs: residentiaL enerGy ConsuMPtion survey
rr: rehabiLitation and retroFit
executIVe summary
Until now, little has been known about the climate change reductions that might be offered by reusing and retrofitting existing buildings rather than demolish-ing and replacdemolish-ing them with new construction. This groundbreakdemolish-ing study concludes that building reuse almost always offers environmental savings over demolition and new construction. Moreover, it can take between 10 and 80 years for a new, energy-efficient building to overcome, through more efficient operations, the negative climate change impacts that were created during the construction process. However, care must be taken in the selection of construc-tion materials in order to minimize environmental impacts; the benefits of reuse can be reduced or negated based on the type and quantity of materials selected for a reuse project.
This research provides the most comprehensive analysis to date of the poten-tial environmental impact reductions associated with building reuse. Utilizing a Life Cycle Analysis (LCA) methodology, the study compares the relative environmental impacts of building reuse and renovation versus new construc-tion over the course of a 75-year life span. LCA is an internaconstruc-tionally recognized approach to evaluating the potential environmental and human health impacts associated with products and services throughout their respective life cycles.1 This study examines indicators within four environmental impact categories,
including climate change, human health, ecosystem quality, and resource depletion. It tests six different building typologies, including a single-family home, multifamily building, commercial office, urban village mixed-use build-ing, elementary school, and warehouse conversion. The study evaluates these building types across four U.S. cities, each representing a different climate zone, i.e., Portland, Phoenix, Chicago, and Atlanta. A summary of life cycle environmental impacts of building reuse, expressed as a percentage of new construction impacts, is shown in the following figure (Summary of Results).
Key fIndInGs and anaLysIs
buiLdinG reuse aLMost aLways yieLds Fewer environMentaL iMPaCts than new ConstruCtion when CoMParinG buiLdinGs oF siMiLar size and FunCtionaLity.2
The range of environmental savings from building reuse varies widely, based on building type, location, and assumed level of energy efficiency. Savings from reuse are between 4 and 46 percent over new construction when comparing buildings with the same energy performance level. The warehouse-to-multifam-ily conversion – one of the six typologies selected for study – is an exception: it
This research
provides the most
comprehensive analysis
to date of the potential
environmental impact
reductions associated
with building reuse.
Summary of Results – The Greenest Building: Quantifying the Environmental Value of Building Reuse
EnvironmEntal impacts of rEnovation as a pErcEntagE of nEw construction
A full description of each impact category and the methods used to evaluate them is located in the Technical Appendices. Base Case = average energy performance; see Section 4 on methodology for determining energy use. Advanced Case = 30% more efficient than Base Case.
-8% -16% -9% -10% -12% -11% -11% -13% -15% -9% -10% -12% -13% -12% -13% -14% -15% -14% -12% -15% -15% -14% -12% -14% -20% -20% -24% -27% -14% -14% -16% -17% -6% -13% -6% -7% -7% -9% -9% -10% -10% +6% +5% +4% +5% +5% +5% +4% +5% +1% +1% +1% +1% -1% -1% -1% -1% -7% -7% -8% -8% -11% -12% -13% -9% -14% -9% -11% -10% -12% -12% -14% -13% -17% -14% -12% -15% -20% -18% -15% -18% -24% -23% -27% -30% -28% -27% -31% -33% -9% -10% -11% -11% -12% -13% -14% -10% -17% -10% -11% -11% -15% -16% -17% -17% -21% -18% -14% -19% -26% -23% -19% -24% -29% -28% -30% -33% -32% -31% -33% -35% -10% -11% -11% -12% -15% -16% -16% -7% -12% -7% -8% -9% -9% -9% -10% -12% -9% -7% -6% -8% -11% -9% -7% -10% -11% -10% -11% -13% -12% -11% -13% -14% -7% -7% -8% -10% -9% -9% -10% -4% -9% -4% -5% -6% -5% -6% -7% -8% -7% -6% -5% -7% -9% -8% -7% -8% -7% -7% -8% -9% -8% -8% -9% -10% -5% -5% -6% -7% -7% -7% -8% -15% -25% -15% -18% -20% -18% -19% -22% -24% -33% -29% -26% -30% -38% -34% -31% -35% -34% -34% -41% -44% -39% -38% -44% -46% -16% -17% -19% -21% -20% -20% -23% Re so ur ce D ep leti o n Advanced Case
Warehouse to Office
Commercial Office Mixed-Use Elementary School Single-Family Multifamily Warehouse to Multifamily
Advanced Case
Base Case Chicago Atlanta Phoenix Portland Chicago Atlanta Phoenix Portland Chicago Atlanta Phoenix Portland Chicago Atlanta Phoenix Portland Chicago Atlanta Phoenix Portland Base Case Chicago Atlanta Phoenix Portland
Base Case Chicago Atlanta Phoenix Portland
Base Case Chicago Atlanta Phoenix Portland Advanced Case Advanced Case H um an H ea lt h C lim at e C ha ng e E co sy st em Q ua lt y Legend Chicago New Construction (represents 100%) Rehabilitation + Retrofit in:
Atlanta Phoenix Portland -8% -16% -9% -10% -12% -11% -11% -13% -15% -9% -10% -12% -13% -12% -13% -14% -15% -14% -12% -15% -15% -14% -12% -14% -20% -20% -24% -27% -14% -14% -16% -17% -6% -13% -6% -7% -7% -9% -9% -10% -10% +6% +5% +4% +5% +5% +5% +4% +5% +1% +1% +1% +1% -1% -1% -1% -1% -7% -7% -8% -8% -11% -12% -13% -9% -14% -9% -11% -10% -12% -12% -14% -13% -17% -14% -12% -15% -20% -18% -15% -18% -24% -23% -27% -30% -28% -27% -31% -33% -9% -10% -11% -11% -12% -13% -14% -10% -17% -10% -11% -11% -15% -16% -17% -17% -21% -18% -14% -19% -26% -23% -19% -24% -29% -28% -30% -33% -32% -31% -33% -35% -10% -11% -11% -12% -15% -16% -16% -7% -12% -7% -8% -9% -9% -9% -10% -12% -9% -7% -6% -8% -11% -9% -7% -10% -11% -10% -11% -13% -12% -11% -13% -14% -7% -7% -8% -10% -9% -9% -10% -4% -9% -4% -5% -6% -5% -6% -7% -8% -7% -6% -5% -7% -9% -8% -7% -8% -7% -7% -8% -9% -8% -8% -9% -10% -5% -5% -6% -7% -7% -7% -8% -15% -25% -15% -18% -20% -18% -19% -22% -24% -33% -29% -26% -30% -38% -34% -31% -35% -34% -34% -41% -44% -39% -38% -44% -46% -16% -17% -19% -21% -20% -20% -23% Re so ur ce D ep leti o n Advanced Case
Warehouse to Office
Commercial Office Mixed-Use Elementary School Single-Family Multifamily Warehouse to Multifamily
Advanced Case
Base Case Chicago Atlanta Phoenix Portland Chicago Atlanta Phoenix Portland Chicago Atlanta Phoenix Portland Chicago Atlanta Phoenix Portland Chicago Atlanta Phoenix Portland Base Case Chicago Atlanta Phoenix Portland
Base Case Chicago Atlanta Phoenix Portland
Base Case Chicago Atlanta Phoenix Portland Advanced Case Advanced Case H um an H ea lt h C lim at e C ha ng e E co sy st em Q ua lt y Legend Chicago New Construction (represents 100%) Rehabilitation + Retrofit in:
Atlanta Phoenix Portland
reuse-based impact reductions may seem small when considering a single building. however, the absolute carbon-related impact reductions can be substantial when these results are scaled across the building stock of a city. For example, if the city of Portland were to retrofit and reuse the single-family homes and commercial office buildings that it is otherwise likely to demolish over the next 10 years, the potential impact reduction would total approximately 231,000 metric tons of CO2 – approximately 15% of their county’s total CO2 reduction tar-gets over the next decade.4 When scaled up even further to capture the poten-tial for carbon reductions in other parts of the country, particularly those with a higher rate of demolition, the potential for savings could be substantial. Given these potential savings, additional research and analysis are needed to help communities design and employ public-policy tools that will remove obstacles to building reuse.
reuse oF buiLdinGs with an averaGe LeveL oF enerGy PerForManCe ConsistentLy oFFers iMMediate CLiMate-ChanGe iMPaCt reduCtions CoMPared to More enerGy-eFFiCient new ConstruCtion.
It is often assumed that the CO2-reduction benefits gained by a new, energy efficient building outweigh any negative climate change impacts associated with the construction of that building. This study finds that it takes 10 to 80 years for a new building that is 30 percent more efficient than an average-per-forming existing building to overcome, through efficient operations, the nega-tive climate change impacts related to the construction process.5 As indicated in the following table, an exception also exists here for the warehouse-to-mul-tifamily building conversion. Upon analysis, this adaptive use scenario does not offer the carbon savings provided by other reuse scenarios.
building reuse alone cannot fulfill the urgent task of reducing climate change emissions. The summary of results of this study, shown on the previous
page, documents how reuse and retrofitting for energy efficiency, together, offer the most significant emissions reductions in the categories of climate change, human health, and resource impact. Certainly, the barriers to retrofits are numerous. However, a variety of organizations are presently working to address the obstacles to greening existing buildings. This study finds that reuse and retrofit are particularly impactful in areas in which coal is the dominant energy source and more extreme climate variations drive higher energy use.
MateriaLs Matter: the Quantity and tyPe oF MateriaLs used in a buiLdinG renovation Can reduCe, or eveN NegaTe, the beneFits oF reuse.
In general, renovation projects that require many new materials – for example, an
This study finds that it
takes 10 to 80 years
for a new building
that is 30 percent
more efficient than an
average-performing
existing building to
overcome, through
efficient operations,
the negative climate
change impacts related
to the construction
process.
5Although warehouse conversions and school additions require more material inputs than other types of renovation projects, reusing these buildings is still more environmentally responsible – in terms of climate change and resource impacts – than building anew, particularly when these buildings are retrofitted to perform at advanced efficiency levels. Better tools are needed to aid designers in selecting materials with the least environmental impacts. Such resources would benefit new construction and renovation projects alike.
study objectIVes and aPProach
Every year, approximately 1 billion square feet of buildings are demolished and replaced with new construction in the United States.6 The Brookings Institution projects that some 82 billion square feet of existing space will be demolished and replaced between 2005 and 2030 – roughly one-quarter of today’s existing building stock.7 Yet, few studies to date have sought to exam-ine the environmental impacts of razing old buildings and erecting new struc-tures in their place. In particular, the climate change implications of demoli-tion and new construcdemoli-tion, as compared to building renovademoli-tion and reuse, remain under-examined.
Year Of Carbon Equivalency For Existing Building Reuse Versus
New Construction
This study finds that it takes between 10 to 80 years for a new building that is 30 percent more efficient than an average-performing existing building to overcome, through efficient operations, the negative climate change impacts related to the construction process. This table illustrates the numbers of years required for new, energy efficient new buildings to overcome impacts.
Building Type chicago Portland
Urban Village Mixed Use 42 years 80 years Single-Family Residential 38 years 50 years
Commercial Office 25 years 42 years
Warehouse-to-Office
Conversion 12 years 19 years
Multifamily Residential 16 years 20 years
Elementary School 10 years 16 years
Warehouse-to-Residential
Conversion* Never Never
*The warehouse-to-multifamily conversion (which operates at an average level of efficiency) does not offer a climate change impact savings compared to new construction that is 30 percent more efficient. These results are driven by the amount and kind of materials used in this particular building conversion. As evidenced by the study’s summary of results, as shown on page VII, the warehouse-to-residential conversion does offer a climate change advantage when energy performance for the new and existing building scenarios are assumed to be the same. This suggests that it may be especially important to retrofit warehouse buildings for improved energy performance, and that care should be taken to select materials that will maximize environmental savings.
Warehouse
conversions and
school additions
require large
materials inputs,
however reusing
these buildings still
has lower climate
change and resource
impacts.
Although awareness about the need to reduce near-term climate change impacts is growing, a greater understanding of the potential environmental savings that can be offered by reusing existing buildings rather than developing new buildings is still needed. This study compares the environmental impacts of building demo-lition and new construction relative to building renovation and reuse. The study has three key objectives:
• To compute and compare the life-cycle environmental impacts of buildings undergoing rehabilitation to those generated by the demolition of existing buildings and their replacement with new construction;
• To determine which stage of a building’s life (i.e. materials production, construction, occupancy) contributes most significantly to its environmental impacts, when those impacts occur, and what drives those impacts; and • To assess the influence of building typology, geography, energy performance,
electricity-grid mix, and life span on environmental impacts throughout a building’s life cycle.
In examining these themes, the authors consider potential opportunities to reduce carbon emissions and other negative environmental impacts through building reuse and explore how differences in building type, climate, and energy-efficiency levels affect these opportunities.
This research is intended to serve as a resource for those who influence and shape the built environment, including policy makers, building owners, develop-ers, architects, enginedevelop-ers, contractors, real estate professionals, and non-profit environmental, green building and preservation advocacy groups. To that end, the study identifies key environmental considerations and challenges related to new construction, retrofits and reuse. Findings from this study should be con-sidered in light of the myriad realities that affect development decisions, such as building codes, zoning, financing, demographics, and design trends.
concLusIons
For those concerned with climate change and other environmental impacts, reusing an existing building and upgrading it to maximum efficiency is almost always the best option regardless of building type and climate. Most climate scientists agree that action in the immediate timeframe is crucial to stave off the worst impacts of climate change. Reusing existing buildings can offer an important means of avoiding unnecessary carbon outlays and help communities achieve their carbon reduction goals in the near term.
This report sets the stage for further research that could augment and refine the findings presented here. Study results are functions of the specific buildings chosen for each scenario and the particular type and quantity of materials used in construction and rehabilitation. Great care was taken to select scenarios that would be representative of typical building reuse or conversion projects. How-ever, environmental impacts will differ for building conversions that use different types and amounts of materials. Others are encouraged to repeat this research using additional building case studies; replicating this analysis will enhance our collective understanding of the range of impact differences that can be expected between new construction and building reuse projects.
This study introduces important questions about how different assumptions related to energy efficiency affect key findings. In particular, further research is needed to clarify how impacts are altered if a new or existing building can be brought to a net-zero level using various technologies, including renewable energy.
about the Project team
This research was made possible by a generous grant from the Summit Foun-dation to the National Trust for Historic Preservation. The project was coordi-nated by the Preservation Green Lab, a programmatic office of the National Trust, which is dedicated to advancing research that explores the sustainability value of older and historic buildings and identifying policy solutions that help communities leverage their built assets. The project team includes Cascadia Green Building Council, Quantis LLC, Skanska, and Green Building Services.
Most climate scientists
agree that action
in the immediate
timeframe is crucial
to stave off the worst
impacts of climate
change. Reusing
existing buildings can
offer an important
means of avoiding
unnecessary carbon
outlays and help
communities achieve
their carbon reduction
goals in the near term.
endnotes
1. section 1 of this report explains Life Cycle assessment (LCa) in greater detail.
2. where energy performance for renovated and new buildings is assumed to be the same.
3. the warehouse-to-multifamily conversion required significantly more new materials than other reuse scenarios tested in this study. the table on page ix provides additional details.
4. based on demolition rates between 2003-2011 provided by City of Portland bureau of Planning and Co2 emission targets as outlined by the City of Portland and Multnomah County 2009 Climate action Plan. reduction in Co2 emissions assumes both the new and the existing buildings are consid-ered to be of the same size and functionality.
5. in this study, energy-use figures for average-performing existing buildings, also known as the ‘base Case,’ were established using national survey data and other recent research. More details are pro-vided in section 4 of the for the report. For purposes of this study, the term ‘new, efficient buildings,’ or the ‘advanced Case,’ refers to new buildings that achieve 30 percent greater energy efficiency over base Case energy performance.
6. national figures tracking demolition are out-of-date. however, a 1998 study by the u.s. environmental Protection agency (ePa) provides a sense of the annual scale of demolition nationwide; it estimates that approximately 925 million square feet of residential and nonresidential space were demolished in 1996. u.s. environmental Protection agency: office of solid waste, “Characterization of building-related Construction and demolition debris in the united states,” ePa530-r-98-010. (washington: u.s.environmental Protection agency, June 1998).
7. arthur C. nelson, “toward a new Metropolis: the opportunity to rebuild america” (washington: brookings institution, 2004).
1. IntroductIon
During the first decade of the 21st century, green building in the United States grew from a nascent movement into a mainstream phenomenon. Today, the nation’s green building sector supports environmentally responsible and resource-efficient building design with the aim of reducing greenhouse gas emissions and other negative environmental impacts. During its short history, the sector has been particularly concerned with those impacts associated with the design and operation of buildings. This focus reflects an acute crisis within the U.S. construction industry; building operations account for approximately 41 percent of the nation’s primary energy consumption, 72 percent of electricity consumption, 38 percent of carbon dioxide (CO2) emissions, and 13 percent of potable water use.1
Though less understood, the extraction of natural resources for construction purposes and the production of building goods are also energy-intensive pro-cesses that release significant CO2 emissions, among other negative impacts. While there is increasing discussion in various green building forums about the potential environmental benefit of reusing buildings, to date few studies have sought to quantify the differences between the environmental impacts of build-ing reuse versus new construction. The handful of existbuild-ing studies that explore this topic are of limited relevance to much of the U.S. building stock in several respects. First, dramatic changes in U.S. and global manufacturing, transporta-tion, and building practices have rendered many older studies inapplicable in the modern context. Second, recent British and Canadian studies that other-wise offer relevant results lack U.S.-specific industry data for comparison. Third, many of these studies are inadequate in scope, addressing single buildings while overlooking potential differences across multiple building typologies.
Thus, the existing body of research in this area provides relatively little instruc-tive data and analysis on building reuse. Understanding the potential savings associated with reuse is of critical importance, since the demolition and replace-ment of buildings is a relatively common practice in the United States. While national figures tracking demolition are out-of-date, a 1998 study from the U.S. Environmental Protection Agency provides some sense of the annual scale of demolition in the United States. It estimates that approximately 925 million square feet of residential and nonresidential space were demolished in 1996.2 The Brookings Institution estimates that significantly more square footage will
be torn down in coming decades, projecting that upwards of 25 percent of our existing building stock – or 82 billion square feet – will be demolished and replaced between 2005 and 2030.3
The environmental impacts of this cycle of demolition and construction – and opportunities to gain carbon and other environmental savings through build-ing reuse and retrofit – remain poorly understood. While some demolition and replacement will undoubtedly remain a necessity to meet contemporary needs, several questions persist: Are there significant opportunities to reduce carbon emissions by reusing buildings rather than constructing anew? Under what
To date few studies
have sought to
quantify the
differences between
the environmental
impacts of building
reuse versus new
construction.
conditions is building reuse environmentally preferable to demolition and new construction? Do benefits differ by region and building type? Is it misguided to assume that the benefits of new “green” buildings will quickly overtake any negative environmental effects associated with new construction, due to their anticipated energy efficiency?
This study tackles these questions by comparing the relative environmental impacts of new construction to building reuse across different climate regions and building typologies. It is intended to serve as a resource for those who influ-ence and shape the built environment, including policy makers, building owners, developers, architects, engineers, contractors, real estate professionals, and non-profit environmental, green building, and preservation advocacy groups. To that end, this report identifies key environmental considerations and challenges related to new construction, retrofits, and reuse. Findings from this study must be considered in light of myriad realities that affect development decisions, such as building codes, zoning, financing, demographics, and fashion. This study is organized as follows:
• section 1 provides an introduction to the study and outlines key study questions;
• section 2 provides an overview of modern approaches to analyzing energy consumption by buildings;
• section 3 explains the life cycle assessment (LCA) approach to understanding the potential environmental impacts of buildings; • section 4 describes the phases, scope, objectives, methodological
framework, and data parameters for this study;
• section 5 features case studies of six different building typologies (single-family residential; multifamily residential; commercial office; urban village mixed use; elementary school; and warehouse); explains the normalization process applied in this study; and describes the application of energy efficiency measures (EEMs) to each building type;
• section 6 provides an overview of the results and key findings from the LCA study;
• section 7 analyzes the results and identifies further research needs; and • the technical appendices describes the technical methods used in this
study; it includes the full LCA results and assumptions, methodology for determining building energy usage, and bill of materials for each case study building used in the analysis.
LIfe cycLe assessment (Lca) as a tooL for
understand-InG buILdunderstand-InGs and enVIronmentaL ImPacts
defined by the International Organization for Standardization (ISO) 14040-14044 standards (ISO 14040 2006; ISO 14040-14044 2006).
This LCA study evaluates the numerous discrete actions related to materials manufacture, transport, construction, operation and the demolition and disposal of common building types. This analysis provides comparable data expressed in terms of environmental impact categories – such as climate change and human health impacts – with the aim of informing current understandings of the value of building reuse relative to new construction. The LCA framework enables an in-depth look at how key variables such as building life span and operating energy efficiency may affect the decision to reuse buildings versus build new.
the IntersectIon of PreserVatIon and enVIronmentaL
adVocacy
As the nation’s premier advocacy organization for the conservation of older and historic buildings, the National Trust for Historic Preservation is particularly interested in understanding the environmental value that may be associated with building reuse. There are many compelling reasons to preserve a structure; it may tell a significant American story, serve as a tangible link to the past, or act as an economic engine within its community. However, aside from these cultural and economic values, environmental factors may also weigh in favor of building conservation. As communities around the country begin to take steps to reduce greenhouse gas emissions associated with buildings, it is increasingly important to understand the potential advantages and disadvantages of build-ing reuse and retrofit.
Reuse and retrofit of existing buildings offers immediate oppor-tunities to address climate change impacts.
2. understandInG buILdInG enerGy use
Building development and operation involves significant energy consumption and has major environmental consequences. In order to effectively evaluate strategies for reducing energy use and minimizing environmental impacts, it is essential to understand the ways in which buildings use energy. Embodied energy, operating energy, and building transportation energy are three main categories of building-related energy consumption.• embodied energy is required to produce a building. It includes the up-front energy investment for extraction of natural resources, manufacturing, transportation, and installation of materials, referred to as initial embodied energy. recurring embodied energy is needed over time to maintain, repair, or replace materials, components or systems during the life of a building. • operating energy is needed to operate a building and includes the energy
required to heat, cool, and provide electrical services to a building over its life span.
• Building transportation energy is the energy utilized to transport occupants to and from a building.
Considerable focus is given in this study to the energy used in building opera-tion and construcopera-tion. For purposes of this analysis, however, transportaopera-tion energy is assumed to be equal for both new construction and reuse scenarios and is not included in this evaluation. Section 7 discusses the importance of fur-ther research regarding building transportation energy, particularly as it relates to the benefits of added density to a site and reduced Vehicle Miles Traveled by occupants.
oPeratInG enerGy of buILdInGs
Operating energy is a prime factor in evaluating building-related energy impacts. As buildings continue to use more energy than ever before, accurate analyses of
building operating energy and related impacts have become increasingly vital. In 2006, the operating energy of residential and commercial buildings in the United States constituted roughly 39 percent of total energy consumed nationwide, or about 39 quadrillion BTU – roughly the equivalent of 6.5 billion barrels of oil.4 The operating energy of buildings varies greatly. It is determined by building envelope and system performance, as well as building management and main-tenance, occupant behavior and building life span. Thus, the ratio of buildings’ annual operating energy to total embodied energy can diverge substantially – between 5:1 and 30:1.5
THE GREENEST BUILDING: QUANTIFYING THE ENVIRONMENTAL VALUE OF BUILDING REUSE 17 appliances and equipment use less energy on a per unit basis than in the past,
effi-ciency improvements are often offset by greater quantities of electronics in homes and buildings.6 Even so, space heating and cooling remain the dominant energy end uses in residential homes, as they have been historically. Figure 1 depicts typi-cal energy end-use profiles for residential and commercial buildings in 2011.7 This study evaluates the life cycle impacts of two subsets of residential
build-ings: Single-family and multifamily residential buildings.
CoMMerCiaL buiLdinGs
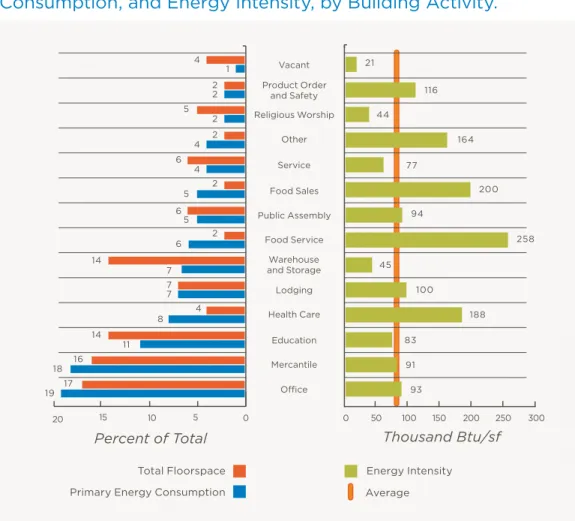
The energy-use profile for commercial buildings in the United States is radically different from that of residential buildings. Energy use by commercial buildings is dominated by electric lighting loads. On a square foot basis, food service build-ings and healthcare facilities consume the greatest amounts of energy, as shown in Figure 2, due to the energy-intensive processes and equipment these buildings typically require. For all commercial building types, heating and cooling loads are heavily dependent on geographical location and regional climate characteristics. This study evaluates three types of commercial buildings that encompass a large portion of the nation’s non-residential building stock: offices, warehouse-to-office conversions, mercantile buildings (mixed-use village), and educational buildings.
Figure 1: Energy Use by Sector
source: u.s. energy information administration and u.s. department of energy
29% Transport
ation
41% Buildings 30%
Industrial
2
Figure X. Ener
gy Use b
y Sect
or
Source: US DOE
Buildings 41% Industrial
30%
Transportation 29%
22% Residential
26.5% Space Heating 15.8% Space Cooling 13.2% Water Heating 10.0% Lighting 6.3% Refrigeration 4.8% Electronics 4.6% Wet Cleaning* 2.6% Cooking 2.5% Computers 13.5% Other
19% Commercial
17.4% Lighting 13.7% Space Heating 10.1% Space Cooling 8.7% Ventilation 6.7% Refrigeration 4.5% Electronics 4.3% Water Heating 3.6% Computers 1.4% Cooking 13.8% Other
15.7% Adjust to SEDS**
*Wet cleaning includes washing machines, dryers and dishwashers.
evaLuatinG oPeratinG enerGy
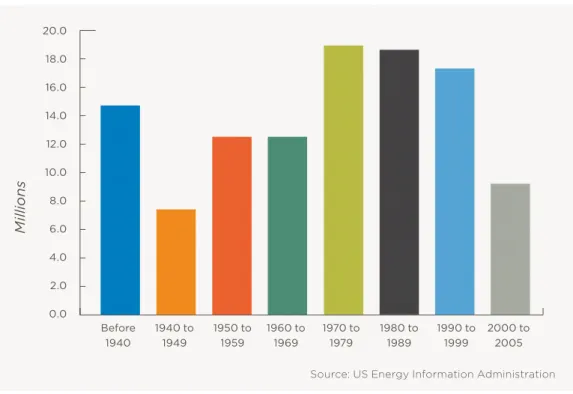
Building owners, developers, policy makers, and green-building experts often assume that it is preferable to build a new, energy-efficient building than to retrofit an older building to the same level of efficiency. Yet myriad examples exist of retrofits of older buildings that have achieved substantial energy sav-ings. What is more, national data on building energy performance indicates that some existing buildings, particularly those from the early 20th-century, perform as well as, or better than, modern-day buildings. For example, data from the U.S. Energy Information Administration (EIA) demonstrates that commercial buildings constructed before 1920 use less energy, per square foot, than
build-Figure 2: Commercial Building Floorspace, Energy
Consumption, and Energy Intensity, by Building Activity.
0 5
10 15
20 0 50 100 150 200 250 300
21 4
4 4
4 1 2 2 2 2
2
2 5
5 5 6
6 6 7
8 7 7 14
14 16 18
19 17
11
116 44
45 100
188 83
91 93
164 77
200
258 94
Vacant Product Order
and Safety
Food Sales
Lodging
Office
Total Floorspace Energy Intensity Average Primary Energy Consumption
Religious Worship
Public Assembly
Health Care Other
Food Service
Education Service
Warehouse and Storage
Mercantile
Percent of Total Thousand Btu/sf
options. These characteristics include passive design (older buildings designed before energy was cheap and abundant); passive survivability (the ability to operate without energy inputs for key functions, such as during a power failure); and adjacency to other buildings, which minimizes heat loss from exterior walls. Unfortunately, attempts to measure the operating energy performance of U.S. building stock are currently complicated by limitations on data and variations between buildings. While some buildings are inherently energy efficient, or are operated and maintained to the highest performance standards, others lag far behind due to poor design or inadequate maintenance.
In some instances, systems are not optimized for performance or tenant behavior is unpredictable. There is a budding policy movement to incentivize or require building owners to track and record the energy use of their buildings, as well as a growing demand on the part of real estate investors and tenants for transparent and consistent data about building performance. Still, many existing buildings in the United States are not bench-marked against established baselines.
Figure 3: Commercial Building Energy Use by Vintage
0 50 100 150 200 250
Before 1920
1946 to 1969 1920 to
1945
1970 to 1989
1990 to 2003
Source: U.S. Energy Information Administration, Commercial Buildings Energy Consumption Survey (2003).
Space Heating Lighting
Cooling Computers
Ventilation
Other (Refrigeration, Cooking, Office Equipment, Misc.)
Water Heating Building vintage
Th
o
usa
n
d
B
tus
/s
Despite gaps in data and research, several factors regarding operating energy performance are well-accepted. For example, regardless of a building’s age, occupant behavior and building maintenance play huge roles in a building’s operating energy performance, so much so that the energy consumption of any building type can easily be skewed based on these factors.
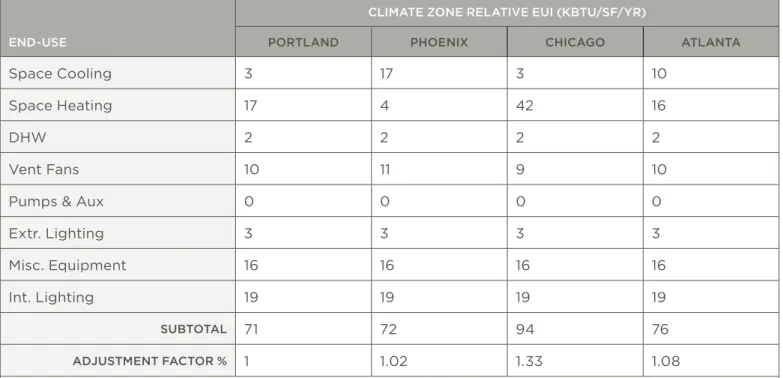
This study seeks to control the aforementioned variables by using normalized, industry-accepted data for energy use based on building type and location (explained further in this document and in the Technical appendices). By doing so, a clearer picture can be provided to evaluate the role of both oper-ating energy and embodied energy and how they factor into decision making regarding building reuse versus demolition and new construction.
embodIed enerGy of buILdInGs
embodied energy is the initial energy investment required to produce a mate-rial or product. It includes the energy needed for the extraction of natural resources, manufacturing, transportation, and installation. Thus, the embodied energy of a building reflects the total energy needed to produce all materials or assemblies, transport them to a building site, and assemble a building.
The 1970s and 1980s marked the beginning of efforts to quantify the environ-mental value of building reuse in the United States. These analyses focused on calculations of embodied energy in buildings. Among these was a report released by the Advisory Council on Historic Preservation during the peak of the energy crisis in 1979, which utilized embodied energy averages, on a per square foot basis, for over a dozen building types and allowed users to gener-ate embodied energy estimgener-ates for nearly any building.8 At the time, the case was often made that saving buildings was tantamount to saving energy. For example, Seattle’s 80,000 square-foot Grand Central Arcade in the Pioneer Square Historic District was estimated to have 131 Billion BTUs embodied in the existing structure, and thus, it was argued that the same number of BTUs would be saved by conserving the building.
avoided iMPaCts aPProaCh
In recent times, many building and environmental scientists have been dismis-sive of the embodied energy approach to quantifying the benefits of building preservation; energy embedded in an existing building is often viewed as a ‘sunk cost.’ That is, it is often argued that there is no inherent current or future energy savings associated with preserving a building, because the energy expendi-tures needed to create a building occurred in the past, as did the environmen-tal impacts associated with creating the building. In this view, the only value
The “avoided impacts”
approach measures
environmental impacts
avoided by choosing
not
to contruct new
buildings.
of prior studies. A 2008 study by the U.K-based Empty Homes Agency, for instance, utilizes the avoided impacts approach to understand the environmen-tal value of existing homes.9 Using data from the University of Bath’s Inventory of Carbon Emissions (ICE) database, the report compares the embodied CO2 resulting from new home construction to that resulting from refurbishment of old properties. The six case studies featured in the study represent the most common housing types in England. CO2 emissions from these homes were projected over a fifty-year period into the future. Key findings from the analysis reveal that the reuse of empty homes could yield an initial savings of 35 tons of CO2 per property if the embodied energy related to new building materials and construction were eliminated.
The study finds that, when carbon emissions are looked at over time, it takes 35 to 50 years for a new, energy efficient home to recover through efficient opera-tions all of the carbon that was expended during the initial construction process. Studies of embodied and operating energy are necessary steps in evaluating the environmental impacts of a building. However, other relevant factors – such as impacts to health, habitat, and air pollution – must also be considered. Con-sequently, the life cycle assessment (LCA) framework is a valuable tool towards understanding the importance of building energy consumption and related environmental concerns.
3. LIfe cycLe assessment (Lca) aPProach
Life cycle assessment (LCA) is an internationally recognized approach to evaluating the potential environmental and human health impacts associated with products and services throughout their life cycles, beginning with raw material extraction and including transportation, production, use, and end-of-life treatment. Among other applications, LCA can identify opportunities to improve the environmental performance of products at various points in their respective life cycles; inform decision making; and support marketing and communication efforts. LCA is increasingly being employed by the construc-tion industry to evaluate the environmental performance of buildings, building materials, and construction practices.10A full description of the LCA methods used in this study is contained in the Technical appendices.
Figure 4: Life Cycle Stages
End of Life Use Distribution
Transformation Manufacture
Extraction
Extraction Transformation Manufacture
End of Life Use Distribution
extraction of raw materials for production of both new and replacement materials. transformation and
refinement of raw materials. manufacture of products and distribution to suppliers. transportation of products to
building site.
use of building including construction-related activities and operating energy of the building over its lifespan. end of Life disposal of materials, including transportations, to landfill, recycling or incineration.
This study expands upon previous LCA investigations into building reuse and retrofit practices. However, the goals and scope of this analysis differ from those of past studies. Previous LCA studies set out to ascertain the relative
a. Lca study of embodIed effects for exIstInG hIstorIc
buILdInGs
In 2009, the Athena Sustainable Materials Institute used LCA to assess the environmental impacts of four commercial and mixed-use historic buildings in Canada.11 The project team used the ATHENA® EcoCalculator for building assem-blies, in order to compare the effects of retaining buildings versus building new structures in the same location. Four options for each of the following case stud-ies were modeled: the renovated building; the best-renovated building (which assumed the best energy performance that could be achieved by an existing building); the typical new building; and the best new building (which assumed the best energy performance that could be achieved by a new building).
For each of these case studies, the project team obtained architectural drawings and renovation histories. For the ‘best-renovated’ option, the team developed a series of projected measures to improve the energy performance of the older buildings. The ‘typical new building’ and ‘best new building’ models were also inputted into the ATHENA® EcoCalculator. The impacts associated with building retrofit were then compared to the impacts associated with new construction. Primary energy use and global warming potential were estimated and analyzed. The study found that the initial avoided impacts associated with the reuse of the existing buildings ranged from a savings of 185 to 1,562 tons of carbon dioxide and between 2.6 million to 43 million MJ of primary energy.12
b. Lca and systems thInKInG for resIdentIaL buILdInGs
A 2010 report by the Oregon Department of Environmental Quality (DEQ) examines the life cycle impacts of over twenty green building practices, from design to construction techniques and material selections.13 The analysis, which assumes a building life span of 70 years, indicates that the majority of impacts occurred during building occupancy and that materials represented only 14 per-cent of life cycle greenhouse gas emissions. Also, of the material reduction and reuse practices evaluated, reductions in home size and multifamily living were found to achieve the largest greenhouse gas reductions.The project team for this study drew on the DEQ’s research as the basis for sev-eral of its initial assumptions. However, this report expands on the DEQ analysis by including both commercial and residential buildings in various climate zones.
c. the buchanan buILdInG, unIVersIty of brItIsh coLumbIa
In 2006, the University of British Columbia studied the environmental impacts that could be expected from the replacement of the Buchanan building, which is located on the University’s campus. The LCA analysis used the Athena Institute’s Environmental Impact Estimator life cycle analysis tool to model the impacts that would be avoided by retaining the Buchanan building rather than replac-ing it with a new buildreplac-ing. The analysis assessed the structure, envelope, and operational usage of the nearly 200,000 square-foot building and included an assessment that included raw material extraction, manufacturing of construc-tion materials, construcconstruc-tion of the structure and envelope, and associated trans-portation effects.14Significantly, the project team concluded that reusing the Buchanan building would result in major environmental savings. It determined that, over an 80-year period, total carbon emissions for the new building were merely 5 percent lower. Furthermore, it would take approximately 38 years for a new, energy efficient building to recover the carbon that was expended during the construction pro-cess and begin to accumulate carbon savings. In other words, net carbon emis-sions savings for the replacement building would begin only after 38 years.
Previous research shows it can take decades for new, energy efficient buildings to overcome the carbon expended during the construction process.
4. study aPProach and methodoLoGy
This report builds on existing research by casting a wider net than, andexpand-ing the boundaries of, previous studies. Here, actual case-study buildexpand-ings are used for both renovation and new-construction scenarios to derive materials inputs required for the LCA. (However, it should be noted that actual case study buildings were not used to generate projected energy usage. This is described further in the Methodology for Determining Building Operating Energy section, below.) This study also quantifies the amount of time needed for a newly constructed building to recover impacts expended in the construction process through efficient build-ing operations. It is anticipated that the comprehensiveness of this study will allow for a broad application of results and thus be useful to policy leaders and decision makers across U.S. sectors, particularly in the building industry.
Project Phases
This investigation was conducted in three phases:
Phase i: buiLdinG industry Market Context
The initial phase of the study included a review of existing literature on building LCA, energy use, and U.S. building stock, along with interviews with thought-lead-ers in the field of preservation and reuse. This phase also included the development of the LCA methodology; a pilot LCA was set up to test the methodology, evaluate assumptions, and determine effective inputs and outputs for delivering results. This pilot LCA study is included in the Technical Appendices.
Phase ii: sCenario deveLoPMent
Phase II of the project was informed by the pilot LCA and involved careful con-sideration of the building types to be used in the study. The following six build-ing types were selected:
• Single-Family Residential • Multifamily Residential • Commercial Office • Urban Village Mixed-Use • Elementary School • Warehouse
Buildings were selected from around the United States, for both the renovation and new construction scenarios. Material quantities were estimated based on available project data. The selected case studies were comparable in terms of program, size, and construction type.15 Differences between buildings were nor-malized in order to improve the accuracy of comparisons. In addition, a method-ology informed by national survey data and peer-reviewed engineering analysis was established for evaluating building energy use, including the selection of energy efficiency measures (EEMs) appropriate to each building.
A full explanation of the methodology employed for the normalization and energy analysis approaches is contained in the Technical appendices.
Phase iii: LiFe CyCLe thinkinG and anaLysis
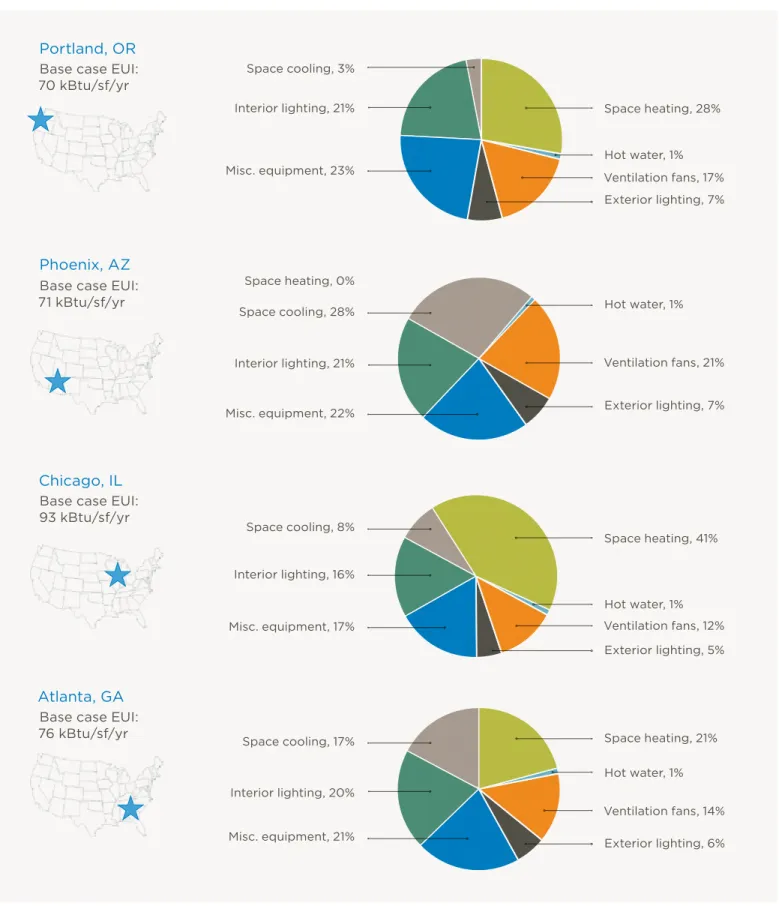
Phase III of the study involved an in-depth analysis of each of the building sce-narios. Full LCAs were run on each reuse/renovation and demolition-and-new-construction scenario across four cities, each representing a different climate region: Portland, Phoenix, Chicago, and Atlanta.
‘Sensitivity analyses’ were conducted to test how specific changes to inputs – such as energy use, variations in fuel mix by region, or building life span – affect final LCA results. Conclusions were then drawn to highlight key findings from the study.
Lca scoPe and methodoLoGy
This investigation aims to identify conditions under which the rehabilitation and retrofit of a building are environmentally preferable to demolition and new con-struction. The objectives of this LCA do not include any definitive comparison of specific products or materials, or specific design or construction practices. Rather, this study examines the aggregate impact of an entire building rather than undertaking a product-by-product comparison.
researCh obJeCtives
• To compute and compare the life cycle environmental impacts of buildings undergoing rehabilitation to those generated by the demolition of existing buildings and new construction;
• To determine which stage of a building’s life (i.e., materials production, construction, occupancy) contributes most significantly to its
environmental impacts, when those impacts occur, and what drives those impacts; and
• To assess the influence of building typology, geography, energy
performance, electricity-grid mix, and life span on environmental impacts throughout a building’s life cycle.
the ProJeCt teaM
The project team for this study included experts in the fields of building design and construction, energy performance and modeling, and life cycle assessment. A leading, national building contractor handled data collection on material quantities for the various scenarios explored by the team.
Peer review
This report has undergone critical review by Pascal Lesage, PhD at CIRAIG, a leading LCA research group housed at the University of Montréal’s École Poly-technique de Montréal. His comments are provided in the Technical Appendices. Note that Dr. Lesage’s feedback is not intended to be a full ISO-compliant review; the cost of a fully compliant ISO review was deemed to be prohibitive. Additional peer review feedback was offered by several LCA, green building, and preserva-tion industry leaders.
MethodoLoGy
The project team had anticipated that designing this study would present many challenges, given the complexities inherent in framing reuse and construction scenarios. A central challenge was the fact that a building may either be demol-ished and newly constructed or rehabilitated and retrofitted, but not both. Spe-cifically, the use of modeled versus real buildings also raised many questions; in the case of the former, modeled buildings could be designed to be as represen-tative as possible of an ‘average’ building type, thereby making study results as generalizable as possible. ‘Real world’ case studies, however, would offer greater certainty in terms of the quantification of materials used for construction and would offer a significant project cost savings.
Ultimately, the project team determined that comparing the reuse of an extant building to an actual, new construction project would offer more data reliabil-ity, and as the less expensive option, would offer an opportunity to test more building typologies. Thus, the methodology employed in this LCA uses empiri-cal data for two comparable case study projects, across six building typologies. Great care was taken to ensure that the case study buildings selected represent common existing and new construction typologies and that the equivalence of functionality between the two projects was maximized.
The case study buildings were, at the time of selection, either fully constructed or under development in the United States. The material inputs, construction/demo-lition activities, and operating energy for these projects were quantified over a 75-year life span.16 While the precise functionality of the buildings in this study vary somewhat, the general functionality within a building category (e.g., office build-ing) is assumed to be equivalent between the ‘existing’ and ‘new’ building models. In some cases, a normalization process was used in the investigation in order to equalize the buildings in function. In these instances, theoretical calibra-tions were made to either the existing or new building so that it more closely matched the function of the other–for example, by excluding a parking garage if one building included parking and the other did not. Case study buildings were not normalized based on their size. Instead, life cycle impacts for these buildings were calculated based on their respective building designs and an appropriate ‘intensity,’ calculated by dividing impacts over the total aggregate floor area to arrive at an ‘impact per square foot’ metric. This approach allowed for the study of a wider range of projects and enabled comparison of two buildings of differ-ent sizes in a meaningful way.17
This study compares
equivalent new and
existing buildings on a
square foot basis over
a 75-year life span.
sCoPe oF the anaLysis
The scope of analysis includes the following:
• Rehabilitated and newly constructed buildings are assessed from the extraction and processing of raw materials onward, through the end-of-life of all building components.
• The ‘new construction’ scenarios include the complete demolition of previ-ously existing structures and the erection of new buildings.
• The ‘rehabilitation-and-retrofit’ scenarios include any demolition necessary for building improvements, renovation and retrofitting activities that exist-ing buildexist-ings underwent durexist-ing their respective rehabilitation phases. • In both scenarios, energy use and the replacement of materials due to
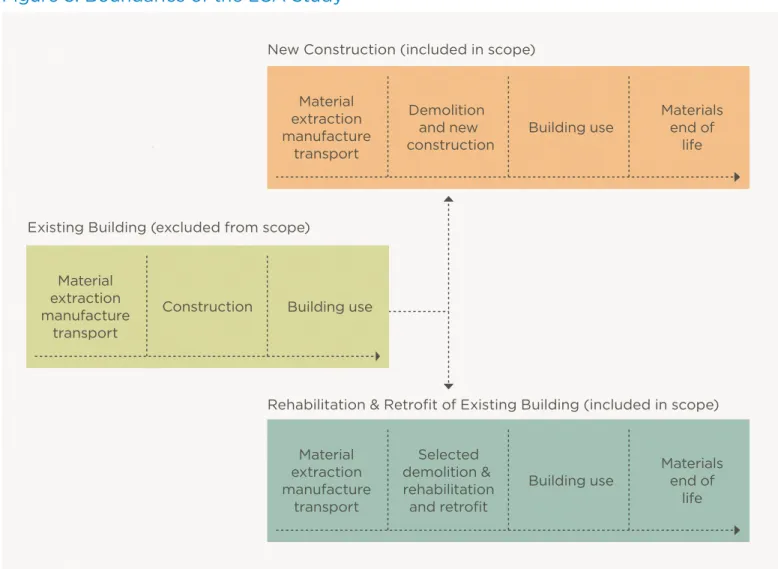
nor-mal wear and tear are included throughout the assumed 75-year life span. Figure 5 depicts the activities included within the boundaries of this study.
Figure 5: Boundaries of the LCA Study
Existing Building (excluded from scope)
Rehabilitation & Retrofit of Existing Building (included in scope) New Construction (included in scope)
Material extraction manufacture
transport
Demolition and new
construction Building use
Materials end of
life
Material extraction manufacture
transport
Construction Building use
Material extraction manufacture
Selected demolition &
rehabilitation Building use
Materials end of
In this study, ‘NC’ refers to the ‘new construction’ scenario. ‘RR’ refers to the rehabilitation and retrofit scenario. In both scenarios, the boundaries of the study include the following life cycle stages:
• Original materials production;18
• Replacement materials production needed over the life of the building; • Material transportation to the building site;
• Demolition/selected demolition in reused building; • Construction/rehabilitation and retrofit activities; • Energy use during building occupancy; and • Materials end-of-life.
Note that the boundaries of this study do not account for impacts related to mate-rials that remain in situ in an existing building. This study seeks to understand the difference in impacts between reuse and new construction in the current day. The impacts associated with in situ materials occurred in the past and are not of inter-est in this study. Only the new materials and activities related to the reuse and ren-ovation of an existing building and those related to demolition and new construc-tion are considered here. This is consistent with the avoided impacts approach. Some activities or materials are not within the scope of this study, as they are assumed to be identical in the NC and RR scenarios. The following items are beyond the scope of this study:
• Water consumption during building occupancy;
• Materials in the existing building that remain on-site during renovation; • Building furnishings (i.e. any items not ‘nailed down,’ including appliances
and furniture);
• Direct occupation of land by the building (i.e., the impact of a building on a specific site);
• Equipment operation associated with final demolition of the buildings, which is assumed to be the same for both buildings;
• The impact of individuals using the building (e.g., transport to and from the building); and
• Variations in material replacement rates between the RR and NC scenarios.19 In addition, impacts to human health related to material off-gassing and the resulting effects on indoor air quality are excluded from this study. Currently, the complexity of this topic requires resources and expertise beyond the capa-bilities of life cycle science, and further research is needed to determine how indoor air quality impacts compare between rehabilitated and newly con-structed buildings.
LIfe cycLe InVentory data sources and assumPtIons
The quality of data used in LCA evaluations determines the usefulness of LCAresults. This study utilizes the most credible and representative information available to the project team. The following sections summarize the team’s data collection process and key underlying assumptions of this investigation.
The Technical appendices describes the life cycle inventory, data collection pro-cess, and applicable assumptions in greater detail.
data coLLectIon
All life cycle inventory data are drawn from the ecoinvent database v2.2 (SCLCI 2010). While life cycle inventory information for many building materials is pro-vided in this source, information describing assemblies (i.e. building materials made up of multiple components) is less readily available. In order to maintain consistency and efficacy in data sources, the LCA models assemblies as a com-bination of their material components.20
Data was collected for each building to quantify materials and other inputs, including:
• Quantification of the materials used in each case study project;21
• Estimated equipment use, electricity consumption, and labor required for demolition/selected demolition and construction/rehabilitation activities; and
• Energy use during the buildings’ operations, based on national survey data and multiple building energy performance studies.
Key assumPtIons of the Lca
Several important assumptions have guided this investigation, including those concerning:
• Building life span;
• Material replacement rates; • Materials transportation;
• Building energy performance; and
• End-of-Life (EOL) management of materials.
buiLdinG LiFe sPan
According to the Pacific Northwest National Lab, the median building lifetime in the United States is 75 years. This measure is used here as the baseline life span for each of the scenarios investigated. It is assumed that, after this period, a building is demolished and materials are transported to their EOL fates. In real-ity, some buildings have life spans that are much shorter or longer than 75 years. Therefore, the project team tested variations in lifetime in order to evaluate their
impacts on environmental outcomes.
MateriaL rePLaCeMent rates