6. Does the computer make a difference?
The reaction of candidates to a computer-based
versus a traditional hand-written form of the
IELTS Writing component: effects and impact
Authors
Cyril Weir
Barry O’Sullivan
University of Bedfordshire, UK
Roehampton University, UK
Jin Yan
Stephen Bax
Jiao Tong University, China
Canterbury Christ Church University, UK
CONTENTS
Abstract ... 2
Author biodata ... 3
1 Introduction ... 4
2 Review of the literature... 4
2.1 Computer-based tests compared with P&P tests: the importance of assessing equivalence... 4
2.2 Achieving construct equivalence between CBA and P&P tests in education... 5
3 Research design and data collection ... 9
3.1 Research questions... 9
3.2 Research design ... 9
3.3 Data collection... 12
4 Data analysis ... 13
4.1 Analysis of the test data ... 13
4.2 Analysis of the CFQ data... 18
4.3 Analysis of the CPQ data ... 21
5 Conclusions and recommendations... 24
5.1 Summary ... 24
5.2 Discussion ... 25
5.3 Future research ... 26
References ... 27
Appendix 1: Test Tasks ... 29
Appendix 2: Frequencies for test scores and band scales ... 30
Appendix 3: Multi-dimensional scaling for test scores on PP and computer ... 31
Appendix 4: Frequency count for the CFQ ... 32
Appendix 5: Responses to CFQ and performances in the tests... 33
Appendix 6: Frequencies for the CPQ-PP ... 35
Appendix 7: Frequencies for the CPQ-computer ... 36
ABSTRACT
Grant awarded Round 8, 2002
This study investigates whether there are meaningful differences in candidates’
internal cognitive processing and their test scores where an English for Academic
Purposes (EAP) writing test is presented in two modes – pencil-and-paper and
computer.
This study investigates whether there are meaningful differences in candidates’ internal cognitive processing and their test scores where an English for Academic Purposes (EAP) writing test is presented in two modes – pencil-and-paper and computer. Analysis of the test data of 262 candidates provides strong evidence to support the claim that there were no significant differences between the scores awarded by two independent examiners for candidates’ performances on the tests taken under two conditions. Analysis of the computer familiarity and anxiety questionnaire data shows that these students in general are familiar with computer usage and their overall reactions towards working with a computer are positive. Candidates’ reactions to the computer were also examined with respect to their fair mean average scores in the tests and it was found that the effect of computer familiarity on their performances in the two modes was negligible for most of the items in the questionnaire. However, differences of up to half a band were detected in two areas: accessibility of public
computers and frequency of word processing activity. Analysis of candidates’ responses to a theory-based questionnaire survey, which inquired about the internal processing undertaken during the two task performances, indicated a similar pattern between the cognitive processes involved in writing on a computer and writing with paper-and-pencil.
Overall results of the study are, in general, encouraging for the computerisation of the writing test, though further replication or expansion of this study using a larger and more balanced population is necessary. A more in-depth investigation of the data will then throw new light on the establishment of equivalence in EAP writing assessment.
AUTHOR BIODATA
CYRIL WEIR
Cyril Weir is the author of Communicative Language Testing, Understanding and Developing Language Tests and Language Testing and Validation: an evidence based approach. He is the co-author of Evaluation in ELT, An Empirical Investigation of the Componentiality of L2 Reading in English for Academic Purposes, Empirical Bases for Construct Validation: the College English Test -a c-ase study, and Reading in a Second Language. Cyril Weir has taught short courses, lectured and carried out consultancies in language testing, evaluation and curriculum renewal in over 50 countries worldwide. With Mike Milanovic of UCLES, he is the series editor of The Studies in Language Testing series published by Cambridge University Press and on the editorial board of Language Assessment Quarterly and Reading in a Foreign Language. Cyril Weir is currently Powdrill Professor in English Language Acquisition at the University of Bedfordshire.
BARRY O’SULLIVAN
Barry O’Sullivan has a PhD in language testing and is particularly interested in issues related to performance testing, test validation and test-data management and analysis. He has lectured for many years on various aspects of language testing, and is currently Director of the Centre for Language Assessment Research (CLARe) at Roehampton University, London. Barry’s publications have appeared in a number of international journals and he has presented his work at international
conferences around the world. His book Issues in Business English Testing: the BEC Revision Project, was published in 2006 by Cambridge ESOL and Cambridge University Press in the Studies in
Language Testing series. His next book is due to appear later this year. Barry is active in language testing around the world and currently works with government ministries, universities and test developers in Europe, Asia, the Middle East and Central America. In addition to his work in the area of language testing, Barry taught in Ireland, England, Peru and Japan before taking up his current post.
JIN YAN
Dr Jin is Professor of Applied Linguistics at the School of Foreign Languages, Shanghai Jiaotong University. In addition to her teaching and research at the university, she has been involved in the design and development of the College English Test (CET), a standardised EFL test with an annual testee population of more than 10 million, for 16 years. Dr Jin was
appointed Chair of the CET Committee in June 2004 by the Higher Education Department of the Ministry of Education. Over the past decade, Dr Jin has published many papers and books on topics related to test design and development.
STEPHEN BAX
Dr Stephen Bax is Principal Lecturer at Canterbury Christ Church University in the UK.
He specialises in the use of ICT for language teaching, learning and assessment, and also researches into discourse, methodology and teacher education. He has worked in Africa, Asia and Latin America, and extensively in the Arab world. He has published extensively on the use of ICT in language teaching, as well as on methodology. He has also developed online assessment and teaching materials with the BBC World Service and government organisations.
1
INTRODUCTION
It is important that receiving institutions can depend on the results of language tests as valid indicators of the English language proficiency of overseas students with respect to the academic courses they are going to follow. The growth in influence of computer technology in the key life skill areas of study, work and leisure, is beginning to emerge in language testing with the introduction by some providers of computer delivered tests and/or testlets. One key validation area, that has only recently begun to receive attention in language testing research, is the comparison of performance on computer-based and traditional pencil-and-paper (P&P) tests of writing.
2
REVIEW OF THE LITERATURE
This review examines the literature on the testing of writing skills through computer mediation with a view to identifying the key areas of equivalence which need to be considered when we use computers in the testing of writing and aim at equivalence with pencil-and-paper tests. Our ultimate purpose is to ensure that the results of computer-based assessment (CBA) in writing in the future are as statistically equivalent as possible and as theoretically valid as possible as compared to the results from pencil and paper tests.
2.1 Computer-based tests compared with P&P tests: the importance of assessing equivalence
Equivalence of P&P tests and CBA in general
Much of the research into the general equivalence of CBA and P&P tests has been undertaken in the field of psychology. Early reviews warned that equivalence was not by any means clear cut
(eg Honaker, 1988), and suggested caution. However, Mead and Drasgow’s often quoted meta-analysis of 159 correlations from published and non-published research in psychology found ‘strong support for the conclusion that there is no medium effect for carefully constructed power tests’ (Mead and Drasgow, 1993, pp 457). Power tests, in these writers’ definition, are those which have no time limits; their analysis therefore suggests that when candidates have no time limits imposed, their performances on CBA and the P&P tests are essentially equivalent, with no difference attributable to the different media.
By contrast, in what they term ‘speeded tests’, in which ‘stringent time limitations are imposed and so the test measures processing speed’ (ibid, pp 450), they found ‘a substantial medium effect’ (ibid, pp 457). This suggests that where candidates are severely restricted in time – and the test is in part measuring their ability to work within time limitations – their performance is adversely affected by the medium of the computer. In fact the authors note that:
Considerable caution should be exercised when comparing scores from paper-and-pencil speeded tests with scores from their computerised versions. Empirically established validity of inferences made from a paper-and-pencil speeded test should not be assumed to automatically generalise to a corresponding computerised test.
(Mead and Drasgow, 1993, pp 453)
This has obvious implications for CBA in language education, suggesting that power tests could be used in CBA mode without affecting equivalence, while more caution is needed in speeded tests. This offers a useful starting point, but we will see when we consider CBA in education that further complications arise.
Equivalence of P&P tests and CBA in education
Given that the predominant medium for testing writing for many centuries has been P&P, when we introduce a new medium in the form of CBA the issue of equivalence immediately comes to the fore. As Van de Vijver & Harsveld (1994), and also McDonald (2002) warn, we must never make
assumptions about the equivalence of CBA and P&P tests: ‘equivalence should not be assumed, but always needs to be demonstrated’ (McDonald, 2002, pp 300).
This rule is often broken. De Beer and Visser observe that:
In practice it is often too easily accepted, without empirical verification, that a computerised version of a test will provide exactly the same results as the paper-and-pencil version. (de Beer & Visser, 1998, pp 25)
Given that P&P and CBA will coexist possibly for some years, this issue of equivalence cannot simply be ignored or assumed. In fact, McDonald points out that the issue of equivalence has still to emerge as a central issue in language testing research.
CBA and P&P tests are likely to co-exist for the foreseeable future, with some tests existing in both formats. The issue of equivalence is therefore very significant and… is probably yet
to come to the fore. (McDonald, 2002, pp 301)
McDonald (2002) draws on Mead and Drasgow’s work to identify two fundamental types of equivalence which CBA in education needs to consider. The first relates to the metric on which test results are placed – the tester needs to demonstrate that these are equivalent in a P&P test and its CBA counterpart so that the two figures are properly comparable. Statistical equivalence needs to be demonstrated. McDonald then argues that a second type of equivalence needs to be considered, namely in the underlying construct that is being measured.
Such constructs might include, for example, the test taker’s ability to use the computer effectively. We recall that in the speeded tests studied by Mead and Drasgow the equivalence of the P&P tests and the CBA tests was possibly vitiated by this factor, as the lack of correspondence between the CBA results and the P&P results was possibly related to the medium used. This demonstrates that in any analysis of the equivalence of the two modes of test it is essential to ensure that the constructs being measured are as far as possible equivalent.
McDonald summarises the importance of ensuring equivalence in these two areas, and emphasises their importance in high stakes educational testing:
Where a P&P test has been translated into CBA form or where parallel CBA and P&P tests are in use, it is necessary to establish score and construct equivalence if scores from the two are to be interchangeable and, in the case of a translated test, established test statistics used. This is particularly important in high-stakes educational testing and testing for
diagnostic purposes where cut-scores are established. (McDonald, 2002, pp 301) 2.2 Achieving construct equivalence between CBA and P&P tests in education:
context validity
Weir (2005 Chapter 6) identifies a number of aspects of context validity which the test developer needs to provide evidence for in arguing for test equivalence. Given that the P&P and CBA tasks in this study were exactly the same in respect of such features as topic, discourse mode, length, purpose, known marking criteria, time constraints, writer-reader relationships, nature of information, content and language knowledge required, there is no need to establish context validity in respect of these variables. The main difficulties for achieving test equivalence in terms of context validity are likely to arise in the area of response format.
We clearly need to establish which affective dimensions the test developer needs to consider to ensure that no test bias is occasioned by the CBA response format with the consequential effects this might have on a test’s construct validity (see Weir 2005, Chapter 5). McDonald (2002) focuses on three main areas of concern, as follows, and notes that they overlap:
1. computer experience and familiarity 2. computer anxiety
3. computer attitudes (including motivation and affect).
We now consider each in turn to determine how, in developing a test of writing, these featuresmight help us to achieve construct equivalence.
Computer experience and familiarity
Early studies, and anecdotal beliefs, assumed that the use of computers produced worse results than the use of P&P tests in testing writing. This quotation from Daiute gives a flavour of those
assumptions:
Writers who comment on the effects of computers on society have noted that writing done on the computer tends to be sloppier than writing done with traditional tools. The few studies of writing quality have shown that writing on the computer is sometimes rated lower than writing
done by the same people with traditional tools. (Daiute 1985. pp 113)
Daiute conceded that this was relatively unproven, but nonetheless went on to argue that computers lead to more ‘sloppy’ errors and therefore lower scores. Of course, Daiute was writing in an era when the use of computers was relatively new. By contrast, in one of the best known recent studies (and among the few to compare P&P and CBA modes experimentally in the testing of writing) Russell and Haney (1997) provided generally convincing evidence to show that, on the contrary, the use of computers led their subjects to achieve significantly higher scores than in P&P mode. The difference is obviously that Russell and Haney’s students were now competent and experienced computer users, even to the extent that their penmanship may have been suffering.
This demonstrates that anyone seeking to compare P&P and CBA modes when testing writing must take into account both possibilities, that testees might be disadvantaged by unfamiliarity with
computers, or advantaged when using them. This is a variable which cannot be ignored. In fact Russell, in a follow-up study, conceded that in their first study he and Haney had been unable fully to cater for this important issue in their preparation:
[in the earlier study] [n]o information regarding the extent to which students used computers or the proficiency with which students used computers was available… Thus it was not possible to study the mode of administration effect across varied levels of previous
computer use. (Russell 1999)
Russell did not in fact find that computer familiarity had much bearing on the results in writing tests, and this seems to hold true in other areas of testing as well. Taylor et al(1998, 1999), looking at the computer-basedTOEFL test, report similar findings concerning the area of testees’ familiarity. In the earlier study it was reported that:
after administration of a computer tutorial, and controlling for language ability, no evidence of adverse effects on TOEFL CBT performance were found due to lack of prior computer
experience. (Taylor et al, 1998)
Computer anxiety
Besides these issues of computer ability and familiarity, research suggests that anxiety over computer use could be an important factor militating against statistical equivalence. This is argued to be the same construct as computer confidence (McDonald, 2002, pp 305).
It is noted that mere quantity of exposure to computers is not sufficient to decrease anxiety (McDonald, citing Smith et al,1999) – it is important that users have a high quality of exposure also. In addition, it is argued that to some extent anxiety can have beneficial effects on scores (eg Vogel, 1994).
In a study particularly pertinent to our review, Shermis and Lombard (1998) looked at reading, mathematics and also writing on computer. Writing was evaluated through a one-hour essay with a choice of questions. Prior to the tests, self-report surveys were administered to see how anxious testees were in various test situations, with answers on a 4 point scale (1=almost never and 4=almost always). Another survey to assess how anxious they were when using computers – also in self-report mode – was similarly applied.
In the case of the writing test ‘none of the independent variables were effective in predicting scores’ (Shermis and Lombard, 1998, pp 120). In other words, there was no clear link between results and anxiety. But it is worth noting that there was quite a degree of flexibility in the written test – testees were allowed to choose their question and draw on personal experiences. In addition, the topics chosen were current social issues. In the mathematics and reading tests, by contrast, there was less choice available. This suggests support for the argument that allowing ‘perceived control’ (McDonald, 2002, pp 306) and flexibility (Mead and Drasgow, 1993, pp 451) in the testing environment can reduce anxiety, as can the provision of practice facilities in, perhaps, self-access mode (Thelwell, 2000, pp 47).
Computer attitudes (including motivation and effect)
As with the above issues, the question of effect and motivation is complex, as illustrated by this quotation:
When evaluating or comparing different media for instruction and assessment, the newer medium may simply be perceived as being more interesting, engaging, and challenging by the students. This novelty effect seems to disappear as rapidly as it appears. However, in research studies conducted over a relatively short time span, for example, a few days or months at the most, this effect may still linger and affect the evaluation by enhancing the
impact of the more novel medium. (Federico, 1991, pp 346)
In other words, motivational effects may be short term, or temporary, or may linger for longer. However, a number of studies (such as Singleton 2001, with school children, and Zandvliet and Farragher 1997, with adults) do report strong preference among testees for computerised tests, and in the latter case ‘the strength of this preference increased with usage of the tests’ (Zandvliet and Farragher, 1997, pp 436). This supports the general view, summarised comprehensively by Russell (1999), that pupils seem to write better on computers than with P&P in their writing in class, and seem to show more enthusiasm, eg writing more extensively, correcting more carefully, and so on.
An interesting experiment linking the teaching of writing with the testing of writing on computers is that of Hertz-Lazarowitz & Bar-Natan (2002). They comment:
The present study deliberately studied perceptions and attitudes related to writing because psychological factors might affect students’ willingness to engage in and enjoyment of writing with the computer. We know very little about the effect of the above on the process of writing with the use of computer technology and CMC. Also nor is the impact of different learning environments on students’ writing strategies adequately studied … . The assumption that technology will affect students’ perceptions about writing has often been expressed, but not
They are correct to note that this area needs extensive further study – in addition to the areas they mention, namely the impact of different learning environments, perceptions and attitudes and so on, and McDonald also rightly notes that more research is needed to identify attitudes towards different aspects of the computer-based tests (McDonald, 2002, pp 308).
As well as equivalence in terms of context validity, equivalence in terms of theory-based validity, the cognitive and meta-cognitive processing involved in task completion in both formats (see Weir 2005, Chapter 7), must also be demonstrated.
Theory based validity
Weir (2005) notes how construct validity was viewed from a purely statistical perspective in much of the American testing literature of the 1980s (see Bachman and Palmer, 1981). It was seen principally as a matter of the after the event, a posterioristatistical validation of whether a test had measured a construct, which had a reality independent of other constructs. The concern was much more with the a posteriori relationship between a test and the abilities which it had measured than with a priori investigation of what should be elicited by the test before its actual administration.
Weir (2005) argues that there is a need for validation at the a priori stage of design and implementation, believing that it is self-evident that the more fully we are able to describe the construct we are attempting to measure at the a priori stage, the more meaningful might be the statistical procedures contributing to construct validation that can subsequently be applied to the results of the test. Statistical data do not in themselves generate conceptual labels. We can never escape from the need to define what is being measured, just as we are obliged to investigate how adequate a test is in operation. This position reflects that of Cronbach (1971, pp 443), who believed that ‘Construction of a test itself starts from a theory about behaviour or mental organisation derived from prior research that suggests the ground plan for the test.’ Kelly (1978, pp 8) supported this view, commenting that: ‘…the systematic development of tests requires some theory, even an informal, inexplicit one, to guide the initial selection of item content and the division of the domain of interest into appropriate sub-areas’.
Messick (1995) sees two major threats to validity in ‘construct under-representation’ and ‘construct irrelevance’. We need to ensure the constructs we are eliciting are those we intend to and that these are not contaminated by other irrelevant constructs. Accordingly test developers need to be aware of prevailing theories concerning the language processing which underlies the various operations required in real life language use. Where such use is to be operationalised in a test, the underlying cognitive processing should be replicated as far as is possibleto ensure theory based validity, ie processing in the test should match as far as possible real life processing.
Weir (2005) argues that establishing theory-based validity in writing is concerned with evaluating the activation of executive resources and executive processes prompted by the task. These ‘Executive Resources’ involve communicative language ability and content knowledge which is already possessed by the candidate through developed schemata or is available in information supplied in task input. The ‘Executive Process’ refers to cognitive processing and includes the procedures of goal setting, topic & genre modifying, generating, organising, translating and reviewing (see Figure 1).
In determining test equivalence we need to establish that the processing in CBA and P&P mode are similar in terms of theory-based validity.
Figure 1: The elements of theory-based validity (Weir 2005)
3
RESEARCH DESIGN AND DATA COLLECTION
3.1 Research questions
The issue of whether different output modes result in significantly different performance is of central importance to test validity (Weir 2005). The fact that there has been no systematic effort to investigate the theory-based validity of such writing tests in the past, leaves open the possibility that differences in performance on the two output modes may mean that they are essentially incomparable as measures. The different modes may be activating different executive processing within the candidate – therefore making performance different in terms of interactional authenticity.
Our review of the literature suggests that before decisions can be made on the introduction of tests which allow for alternative output modes (in this case paper-and-pencil versus computer), we need to gain a greater understanding of the underlying cognitive processes activated by these modes – in other words, we need to investigate the theory-based validity of test formats employing these modes. In order to do this, we should gather data on the pre-writing and during-writing behaviour of candidates, as well as essential baseline data on their computer readiness.
The research questions can be stated:
̇ Are there significant differences in the scores awarded by independent raters for performances on the two modes?
̇ Do test candidates use different cognitive processes when writing on a computer to when they write using paper-and-pencil?
̇ Are any of the independent variables (computer familiarity, anxiety, etc) effective in predicting test scores? (ie Is there any clear link between results and computer familiarity or anxiety, etc?)
3.2 Research design
In order to investigate these questions, this study employs a mixture of quantitative and qualitative methods as appropriate, including performances on the tests, self report by test takers on computer familiarity and self report on the cognitive processes they employed in performing under the two conditions.
A total of 262 undergraduate non-native speakers of English aged between 18 and 22 in China, Turkey and Britain performed two comparable writing tasks (Task A and Task B) under the two different conditions. The Chinese students were mainly in undergraduate science faculties, the Turkish students were in a preparatory undergraduate English language program prior to studying in faculties across the subject range, and the small group of multinational students in Britain was similarly spread out across subject areas.
Both tasks are retired versions of existing IELTS tests – for which data existed to indicate that they were similar in terms of difficulty (as measured by test scores achieved by candidates). Immediately before taking the test, candidates were required to complete a computer familiarity questionnaire to establish the baseline data related to their computer familiarity. Immediately after each test, candidates completed a specially developed cognitive processing questionnaire, which focused on the processing engendered by each test task. All administration of the instruments was conducted under strict exam conditions. The development of these instruments is described below.
The development of the Computer Familiarity Questionnaire (CFQ)
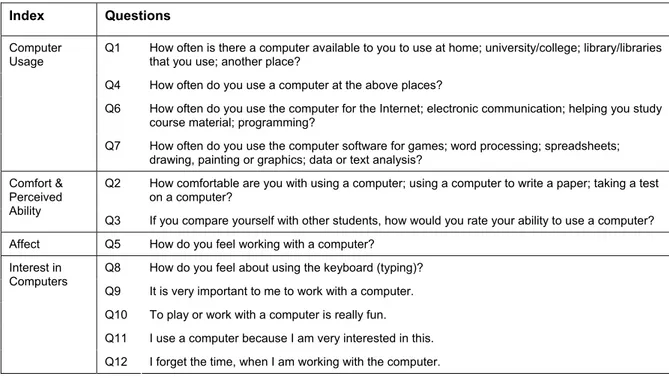
The Computer Familiarity Questionnaire (CFQ) is based on two previously validated instruments from the literature. The first of these is an instrument developed for the Program for International Student Assessment (PISA), a project supported by the Organisation for Economic Co-operation and Development (OECD) in a three-year survey of the knowledge and skills of 15-year-olds in the principal industrialised countries. The survey was conducted first in 2000 and it is planned that it will be repeated every three years. In the first study, 265,000 students from 32 countries sat pencil-and-paper assessments in their schools. These assessments were supported by responses to specifically designed questionnaires completed by students and their principals. The instrument was devised to reflect major indices of computer familiarity: Computer Usage, Comfort and Perceived Ability, Interest in Computers, and Affect. Table 1 shows the items that are designed to elicit data related to these indices.
Index Questions
Q1 How often is there a computer available to you to use at home; university/college; library/libraries that you use; another place?
Q4 How often do you use a computer at the above places?
Q6 How often do you use the computer for the Internet; electronic communication; helping you study course material; programming?
Computer Usage
Q7 How often do you use the computer software for games; word processing; spreadsheets; drawing, painting or graphics; data or text analysis?
Q2 How comfortable are you with using a computer; using a computer to write a paper; taking a test on a computer?
Comfort & Perceived Ability
Q3 If you compare yourself with other students, how would you rate your ability to use a computer? Affect Q5 How do you feel working with a computer?
Q8 How do you feel about using the keyboard (typing)? Q9 It is very important to me to work with a computer. Q10 To play or work with a computer is really fun. Q11 I use a computer because I am very interested in this. Interest in
Computers
Q12 I forget the time, when I am working with the computer.
Since the original instrument was designed for use with 15-year olds, a number of relatively minor amendments were considered necessary. Most of these amendments related to references either to peers (‘other 15 year olds’ was changed to ‘other students’) or to places of study (‘school’ was changed to ‘university/college’). The most substantial change was made to Item 6(e), where the reference to ‘educational software’ was changed to ‘Data or text analysis (eg SPSS ® or NUD*IST)’. This was done to reflect the greater likelihood that the candidature for which the questionnaire was being revised would be more likely to use such specific software rather than the general reference made in the original.
The second instrument is the Computer Attitude Questionnaire (CAQ v5.14) developed by Knezek and Christensen (1995, 1997) at the Texas Centre for Educational Technology originally for use with young learners. The complete instrument consists of eight indices, though the only part of the original used here is a modified (again to reflect the age of the participants) version of the ‘Anxiety’ section. This is included as Question 5 in the instrument.
The CFQ was revised and trialled to ensure that the changes made did not result in any significant changes to the information being sought, ie that the revised version results in the same three-factor profile as the original.
The development of the Cognitive Processing Questionnaire (CPQ)
The Cognitive Processing Questionnaire (CPQ) was designed to reflect the underlying concepts identified in the framework of theory-based validity outlined above. These concepts can be seen as reflecting both the Executive Processes and the Executive Resources identified in the framework (Weir, 2005) and it is hypothesised that these will be reflected in a number of phases.
In the opening phases (01 & 02), the candidate is concerned with pre-writing activities such as goal setting and modifying the topic and genre according to their individual schemata. When this has been done, the candidate enters the planning phases (03 & 04) where ideas for inclusion (or structuring) are formulated and noted – either formally in terms of a written outline, or conceptualised in the form of unwritten ‘mental’ notes. Finally, candidates are expected to translate these initial ideas into written language and to review this language once committed to paper or screen. Throughout these phases, the Executive Resources available to the candidate are thought to include both linguistic and content knowledge and each phase of the cognitive process may be subject to review. Table 2 shows the different phases and the items designed to elicit how the candidates behaved (refer to Appendix 8 for the questions).
Candidates completed a questionnaire for each of the two tasks they performed. Therefore, any differences in the cognitive processes employed in the completion of the tasks under the two
conditions (operationalised by alternating the output mode from paper-and-pencil to computer) would be highlighted.
The questionnaire was initially developed by Weir, Xiu, O’Sullivan and Hawkey in the Centre for Research in Testing, Evaluation and Curriculum, University of Roehampton, UK, using the framework as the conceptual model. This was discussed at an ‘expert panel’ group meeting, comprising the researchers and four additional researchers in the field. The first version of the questionnaire was trialled by Xiu using a group of approximately 80 undergraduates in China in March 2003. Following this trial a number of modifications were made – mainly in terms of structure and individual item wording and the questionnaire was re-trialled, again in China. A final trial of the CPQ followed, this time with a relatively small cohort (N = 45) of teachers in Turkey. This trial led to very minor modifications in the final version of the questionnaire.
Question No. Phase 01: Goal setting
Setting goals and purpose 1, 2, 3, 4, 5
Phase 02: Topic & genre modifying
Topic relevance 6, 7
Genre relevance 8, 9
Phase 03: Generating
Write down ideas or retrieve content from memory 10, 11, 13, 14, 15
Phase 04: Organising
Grouping ideas 12, 16
Putting ideas in order 17, 18, 19
Phase 05: Translating
Putting ideas into appropriate language 20, 21, 22, 23, 24 Putting ideas into cohesive and coherent language 25, 26
Phase 06: Reviewing
Evaluating and revising text development 27, 36, 38 Evaluating and revising content development 28, 29, 30, 31 Evaluating and revising written thoughts and statements 32, 33, 34, 35 Evaluating and revising unwritten thought and statements 37
Table 2: Different phases of writing and the items designed to elicit candidates’ behavior
3.3 Data collection
In the study, all the participants took both a computer version of one task and a paper-and-pencil version of the other task. Both are retired Part B tasks of existing IELTS versions supplied by
Cambridge ESOL (see Appendix 1) – for which data exists to indicate that they are similar in terms of difficulty (as measured by test scores achieved by candidates). For each task, two versions were created for the study, a computer version and the traditional paper-and-pencil version. Thus we ended up with four types of tasks – Task A computer, Task A paper-and-pencil, Task B computer, and Task B paper-and-pencil. A group of trained and experienced IELTS examiners was selected as raters. These examiners were known to the researchers from previous research projects and had shown themselves to be consistent and reliable, both intra- and inter-rater.
Apart from the tests, participants were required to complete a computer familiarity questionnaire (CFQ) before the test and a cognitive processing questionnaire (CPQ) immediately following each test
Phase Instrument Analysis Participants 1 Computer Familiarity
Questionnaire Qualitative and quantitative All
2
Test Occasion 1 P&P Version Computer Version
All rated and scores analysed quantitatively
All – though a balanced design, so half take one version and the others take the second version
3 Performance Questionnaire Qualitative and quantitative All
4
Test Occasion 2 P&P Version Computer Version
All rated and scores analysed quantitatively
All – though a balanced design, inverse of previous phase
5 Performance Questionnaire Qualitative and quantitative All
Table 3: Design of the experiment: research instruments
The original plan was to have approximately 25% of the candidates sit each of the four possible combinations of tasks. Operational needs meant we could not achieve this exactly, though we finally arrived at a reasonably balanced data set, 122 candidates sat Task A P&P version and Task B computer version, 140 candidates satTask B P&P version and Task A computer version. Arrangements were made to guard against any possible order effect (see Table 4).
Group A: 25% of students* B: 25% of students* C: 25% of students* D: 25% of students*
Step 1 CFQ Questionnaire
2 Task A pp Task B pp Task A computer Task B computer
3 CPQ pp CPQ pp CPQ computer CPQ computer
4 Task B computer Task A computer Task B pp Task A pp
5 CPQ computer CPQ computer CPQ pp CPQ pp * Approximate estimate only, due to operational limitations
Table 4: Design of the experiment: participants and activities
4
DATA ANALYSIS
4.1 Analysis of the test data
The analysis of the test data aimed to answer the question: Are there significant differences in the scores awarded by independent raters for performances on the two modes, one paper-and-pencil and the other computer?
Fair mean average scores were derived from Multi-Faceted Rasch (MFR) analysis of the raw data generated by the two raters and used throughout the analyses. The descriptive data (Table 5) shows that the mean of the test scores is higher on the computer version than on the paper-and-pencil version, though the difference is very small, only 0.046 out of a total of 9. The standard deviations of the two versions are also very close, implying that the scores are spread out to a very similar degree for the tests taken under two different conditions. The medians, modes, and quartiles of the two versions are exactly the same, indicating a very similar pattern of distribution of scores on the two versions.
The Paired Sample T-test (Table 6) shows that the difference between the two versions is statistically not significant, ie there is no statistical evidence to support the claim that one set of scores is
significantly higher or lower than the other. Statistics
262 262
0 0
4.927 4.973
.0491 .0488
5.000 5.000
5.0 5.0
.7942 .7898
1.0 2.0
6.5 8.0
4.500 4.500
5.000 5.000
5.500 5.500
Valid Missing N
Mean
Std. Error of Mean Median
Mode Std. Deviation Minimum Maximum
25 50 75 Percentiles
PPNEW CBTNEW
Table 5: Descriptive statistics (PP vs Computer)
Paired Samples Test
-.046 .8840 .0546 -.153 .062 -.839 261 .402
PPNEW - CBTNEW Pair 1
Mean Std. Deviation
Std. Error
Mean Lower Upper
95% Confidence Interval of the
Difference Paired Differences
t df Sig. (2-tailed)
Table 6: Paired sample T-Test (PP vs CBT)
Since tasks used in the experiment were retired IELTS items, which were comparable in terms of difficulty, any significant or non-significant difference between the P&P and CBA versions should be attributed to the mode used in the test delivery. However, a post hoc comparison of the two tasks was considered necessary in case the difficulty level of the tasks was affected by the truncated sample used in this experiment. Descriptive data were, therefore, calculated for candidates’ performances on Task A and Task B irrespective of the conditions under which they took the test.
The descriptive data (Table7) shows that the medians, modes, and quartiles of the two tasks are exactly the same, indicating a very similar pattern of distribution of scores on the two tasks. The mean score, however, is marginally higher on Task B than on Task A, with a difference of 0.195. Though the difference is statistically significant (Table 8), given the difference is less than a quarter of a band even when the standard error of mean is taken into consideration, it would not affect the band score that a candidate is given on the 0 to 9 IELTS proficiency scale inwriting. In addition, a test of association conducted on the results indicates that the 2 is 0.03, which suggests that while the differences may be statistically significant they are unlikely to be meaningful (Hatch and Lazaraton, 1991, pp 266-67).
Statistics
262 262
0 0
4.8531 5.0477 .04598 .05104 5.0000 5.0000 5.00 5.00 .74431 .82618 1.00 2.00 8.00 7.50 4.5000 4.5000 5.0000 5.0000 5.5000 5.5000 Valid
Missing N
Mean
Std. Error of Mean Median
Mode Std. Deviation Minimum Maximum
25 50 75 Percentiles
TASKA TASKB
Table 7: Descriptive statistics (Task A vs Task B)
Paired Samples Test
-.1947 .86342 .05334 -.2997 -.0896 -3.649 261 .000 TASKA - TASKB
Pair 1
Mean Std. Deviation
Std. Error
Mean Lower Upper 95% Confidence
Interval of the Difference Paired Differences
t df Sig. (2-tailed)
Table 8: Paired sample T-Test (Task A vs Task B)
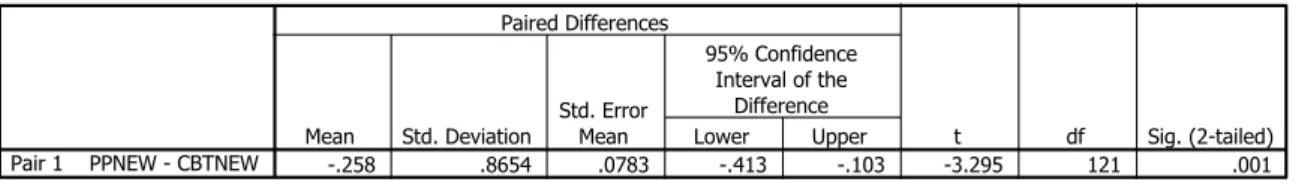
Since performance on the computer version is slightly better than on the P&P version and Task B is slightly easier than Task A for these candidates, it is likely that the greatest difference would occur in the group who did Task A P&P and Task B computer. This was confirmed by a closer look at the means of different groups for each version of each task (Table 9), which suggests that the difference is 0.258 for Task A P&P versus Task B computer and 0.139 for Task A computer versus Task B P&P. T-tests (Table 10 and 11) show that the difference is statistically significant for the former scenario but not significant for the latter. Though the difference is statistically significant for the first group, given the difference is approximately only a quarter of a band even when the standard error of mean is taken into consideration, for the vast majority of candidates this would not affect the band score that a candidate is awarded.
Task N means Sd. deviation
Task A P&P 122 4.78 .821
Task A computer 140 4.92 .666
Task B P&P 140 5.06 .748
Task B computer 122 5.03 .911
Task A P&P – Task B computer -0.258 Task A computer –Task B P&P -0.139
Paired Samples Test
-.258 .8654 .0783 -.413 -.103 -3.295 121 .001
PPNEW - CBTNEW Pair 1
Mean Std. Deviation
Std. Error
Mean Lower Upper
95% Confidence Interval of the
Difference Paired Differences
t df Sig. (2-tailed)
Table 10: Paired sample T-Test (Task A P&P vs Task B computer)
Paired Samples Test
.139 .8610 .0728 -.005 .283 1.914 139 .058 PPNEW - CBTNEW
Pair 1
Mean Std. Deviation
Std. Error
Mean Lower Upper 95% Confidence
Interval of the Difference Paired Differences
t df Sig. (2-tailed)
Table 11: Paired sample T-Test (Task A computer vs Task B P&P)
The Pearson correlation (Table 12) provides evidence for a statistically significant correlation between the test scores of the paper-and-pencil version and the computer version, though the correlation is not as high as we would expect. The low correlation could be due to the truncated sample in terms of the proficiency level of the candidates used in the study, who, as mentioned before, were mostly EFL undergraduates of relatively weak language proficiency, as indicated by the mean scores on the two versions, which were both less than 5.0.
Correlations
1 .377**
. .000
262 262
.377** 1
.000 .
262 262
Pearson Correlation Sig. (2-tailed) N
Pearson Correlation Sig. (2-tailed) N
PPNEW
CBTNEW
PPNEW CBTNEW
Correlation is significant at the 0.01 level (2 il d)
**.
Table 12: Pearson correlation
For a criterion referenced test like the IELTS, however, as Weir (2005) points out, criterion related decision consistency should be the major concern for test developers, ie the consistency in judgements of whether a set criterion has been met, rather than consistency of scoring per se. Therefore, a
frequency count for the test scores on the two versions, as well as for the band differences between the two versions (Appendix 2), was conducted with a view to taking a closer look at students’
The results indicate that the number of candidates, as well as the percentage, who were awarded the same score (or rather the same band) on both versions of the test, is so close that if a cut-band or cut-score were to be set for this group of candidates, approximately the same number or percentage of the candidates (see cumulative percentage column in Appendix 2) would be granted a pass in either mode. What is more, 60.7% of the candidates were awarded the same or half a band more or less, and for 87% of them, the difference between the bands awarded to their performances on the two versions falls within one band.
The above results were confirmed by the Multi-Faceted Rasch (MFR) analysis in which the candidate, the mode (response format) and the rater were identified as the facets. The analysis indicates a low spread of candidates in terms of ability; that there is no meaningful difference between the two modes; and that the two raters were similar in terms of harshness (though Rater 2 was very slightly more lenient, awarding scores on average 0.2 bands higher than Rater 1). Further analysis indicated that the differences in ‘fair average’ score for the two modes was 0.04, supporting the above results, and also indicating that the raters were both highly consistent.
As a further check on the underlying structure of the ability being tested by the tests delivered under two conditions, Multidimensional Scaling (Oltman and Stricker, 1990; Chalhoub-Deville, 2001, pp 210-228) was employed to examine the likelihood that comparable language ability structures underlie test-takers’ performance ratings across the two versions of the writing tests (see Appendix 3). Since the data consists of only one Euclidean distances matrix, the simplest kind of multi-dimensional scaling (MDS), the Classical MDS (CMDS) model was used for the analysis. The distances were created from the data in the matrix, in which the columns were 262 candidates and the rows were the raters’ global score, sub scores of CQ (communicative quality), AIE (arguments, ideas and evidence) and VSS (vocabulary and sentence structure). Since raters may differ in their harshness or leniency, though this was proved by MFR analysis to have little effect on students’ scores, two analyses were run, one for each rater.
For Rater 1, the iteration history shows the s-stress for the first iteration is 0.073. The Kruskal’s stress is 0.077 and the squared correlation coefficient (RSQ), the amount of variance accounted for by their corresponding distances, is .973. ‘Different people have different standards regarding the amount of stress to tolerate. The rule of thumb we use is that anything under 0.1 is excellent and anything over 0.15 is unacceptable.’ (http://www.analytictech.com/borgatti/mds.htm)
The low stress index together with the high squared correlation (RSQ) here, therefore, shows a very satisfying goodness of fit for CMDS model (Euclidean distance model) and provides evidence to support the similarity of the language ability structures underlying test-takers’ performance ratings on the two versions. In other words, it is highly plausible that the two versions were testing the same construct.
Results for Rater 2 are very similar to those of Rater 1. The iteration history shows the s-stress for the first iteration is 0.095. The Kruskal’s stress is .082 and the squared correlation coefficient is .982. Again, the low stress index and the high RSQ support the similarity of the writing skill structure underlying test-takers’ performance ratings on the two versions.
4.2 Analysis of the CFQ data
The CFQ was designed to elicit data related to
̇ candidates’ familiarity with computer usage (Questions 1, 4, 6, 7) ̇ the comfort with using a computer for various purposes (Question 2) ̇ their perceived ability to use a computer (Question 3)
̇ the anxiety felt by the candidates while using a computer (Question 5) ̇ their interest in computer usage (Questions 8, 9, 10, 11, 12).
A descriptive summary (Table 13) is provided below based on the frequency data (Appendix 4) with respect to these major aspects of computer usage addressed by the questionnaire.
Major Aspects
Que Responses
1 88.4% have frequent access to computers at university; 59.7% at home 4 84.3% use computers frequently at university; 56.4% at home
6 95.7% frequent use for surfing the net; 89.9% for electronic communication; 59.7% to help study course materials
Familiarity with computer usage
7 68.0% use word processing frequently Comfort with
using a computer
2 79.0% feel comfortable (very or somewhat) using a computer 67.5% feel comfortable using a computer to write a paper 53.0% feel comfortable taking a test on a computer BUT 47% feel uncomfortable taking a test on a computer Perceived
ability to use a computer
3 49.0% very good or good at using a computer; 42.9% fairly good at using a computer
ONLY 8.0% have no confidence in their ability to use a computer
Anxiety felt while using a computer
5 83.5% feel comfortable working with a computer 85.3% are not scared of using computers at all 88.5% do not think computers are difficult to use ONLY:
13.8% agree that using a computer is very frustrating
14.0% would get a sinking feeling thinking of trying to use a computer 15.3% would feel nervous working with a computer
24.6% would choose to do as little work with computers as possible
31.4% agree that it would take a long time to finish when they use a computer 8 71.1% think typing is not a problem for them
69.9% do not find it difficult to use the keyboard 37.2% think they can type as fast as they can write 9 84.8% consider it very important to work with a computer 10 86.7% play or work with a computer is really fun
11 67.6% use a computer because they are very interested in this. Interest in
computer usage
12 66.7% would forget the time when working with the computer
Having established candidates’ reactions towards using a computer and their familiarity with computer usage, we investigated whether these factors would have any effect on their performances in the tests. Before embarking on inferential data analysis (eg factor analysis), descriptive statistics were
calculated for the performances of participants who chose either of the extreme ends of the options for each question, eg strongly disagree (1) versus strongly agree (5), or almost every day (1) versus never (5), because differences between performances were expected to be more likely to occur between these candidates (see Appendix 5).
Most of the differences are negligible (less than 0.3 out of a total of 9). Some are reasonable and within the researchers’ expectation (between 0.3 to 0.5). For example, for the candidates who reported that they never have access to computers at university, their scores are 0.41 lower on the computer version and 0.32 higher on the P&P version than those who reported that they have access to
computers at university almost every day. For those who feel comfortable with using a computer, their scores on the computer version are 0.37 higher than those who did not feel comfortable at all using a computer.
For a few questions (eg some sub-items in Q6, Q7 and Q8), however, the differences are more noticeable (above 0.5). A closer look at these items suggests that some of the differences occur by chance because very few (only 1 or 2) candidates opted for those extreme choices (eg, 6a, 6b, 8g, 8h). When candidates who chose either ‘agree’ or ‘disagree’ were also included in the analysis (see shaded columns in Appendix 5), it was found that the differences decreased to an acceptable range
(within 0.5). Though the practice of selecting only the extreme end of the responses was broken in these cases and the contrast might not be so striking, this seemed to be a more logical and sensible way of analysing these particular data.
After further analysis, it was found that the effect of computer familiarity on performances on the two modes is negligible for most items in the questionnaire. For item 8f concerning relative speeds of typing and handwriting, a difference of 0.68 in scores is found in the P&P where those who think their handwriting is quicker than typing perform better. In the computer version, those who think they can type better than write manually score more. Therefore, this is not considered as an area for concern. However, of potentially greater interest are the differences of up to half a band, which were detected in two areas: accessibility of public computers (Q1c) and frequency of word processing activity (Q7b). The data show that:
̇ The average on the computer version for those who can access computers in the library almost every day is 0.55 higher (approximately half a band on the IELTS writing proficiency scale of 0–9) than that of the candidates who never have access to computers in the library. The old adage that the more you do something the better you get would seem to hold true in this instance.
̇ The average on the computer version for those who use word processing almost every day is 0.59 higher than that of the candidates who never use word processing. This again might have been expected.
When looking for a factorial structure of the responses to the CFQ, preliminary analysis suggested that a four factor solution would best describe the data for the entire group. The analysis also suggested that the final four items were not functioning as predicted (possibly due to the difference in format, these were simple yes/no items, while all the others were Likert-type). These items were removed from the final analysis, as were items 4B and 6A, which appeared to load equally on more than one factor. This final analysis accounts for a total of 47% of the variance, and results in an interpretable matrix (Table 14).
Component
1 2 3 4
CFQ1A .093 .627 -.074 -.040
CFQ1B -.036 -.077 .431 .497
CFQ1C -.008 .129 .029 .735
CFQ1D .128 .175 -.125 .723
CFQ2A .113 .482 .164 .085
CFQ2B .066 .558 .181 .011
CFQ2C .088 .467 .137 .081
CFQ3 .335 .522 .176 .025
CFQ4A .100 .632 -.056 -.064
CFQ4C -.001 -.050 .291 .635
CFQ4D .264 .078 .110 .538
CFQ5A -.578 -.272 -.121 -.111
CFQ5B .684 .205 .124 -.010
CFQ5C .615 .169 .143 .128
CFQ5D -.672 -.032 .028 -.151
CFQ5E .756 .256 .085 .026
CFQ5F .742 .165 .010 .004
CFQ5G .640 -.105 .114 -.034
CFQ5H .715 .281 .135 .090
CFQ6B .155 .186 .530 .320
CFQ6C .118 .080 .597 .179
CFQ6D .012 .089 .712 .011
CFQ7B .093 .284 .590 .189
CFQ7C .114 .165 .724 .047
CFQ7D .108 .140 .690 .032
CFQ7E .111 .026 .717 -.094
CFQ8F -.041 -.657 -.119 -.120 CFQ8G -.176 -.635 -.109 -.154
CFQ8H .239 .668 .171 .083
While there are some differences between this representation of the underlying factors and that suggested in Table 1, the differences are relatively minor, and examination of the actual items that appear to come together makes this solution viable (Table 15).
Factor Questions
Affect 5
Familiarity 1A; 2; 3; 4A; 8
Computer usage 6; 7
Availability and use outside of home 1B, 1C, 1D; 4C, 4D
Table 15: Suggested four factor solution
This analysis suggests that the questionnaire is working well though future administrations would benefit from minor changes based on these results (ie consolidating the items which load on specific factors).
4.3 Analysis of the CPQ data
The CPQ investigated the cognitive processes participants employed in performing under the two conditions of the test, that is, whether test candidates accessed different cognitive processes when writing on a computer to when they wrote using paper-and-pencil?
Frequencies were calculated for each version of the questionnaire (Appendices 6 and 7). To gain a clearer picture of the agreement or disagreement with the statements in the questionnaire, we take a further look at the data by drawing a line for 60% agreement (or disagreement) reflecting an average response greater than 3 and 40%-60% agreement (or disagreement) with each statement. The results are presented in Table 16.
According to the frequency data and the comparison of the responses to the pp and CPQ-computer presented below, a similar pattern was found in participants’ self-reported cognitive processes for taking the paper-and-pencil version and the computer version test.
Before writing the essay CPQ-pp CPQ-computer
agreement ≥ 60% 1,2,3,5,12,16,18 1,2,3,5,16
60%≥agreement≥40% 4,8,11,13,14,17 4,8,12,13,14,17,18
disagreement ≥ 60%
60%≥disagreement≥40% 7,15 7,12,15
While writing the essay CPQ-pp CPQ-computer
agreement ≥ 60% 22,25,30,32,34 22,24,25,28,30,32,34
60%≥agreement≥40% 19,24,26,27,28,29 19,21,23,26,27,29
disagreement ≥ 60% 36 36
For further confirmation, differences between the means of students’ responses to the CPQ-pp and the CPQ-computer were calculated and illustrated in a chart (see Figure 2 below). It can be seen again that there are no major differences in the general tendency of agreement or disagreement with each
statement for the two versions of the tests indicating that similar cognitive processes are most probably being employed in completing the writing tasks under different delivery conditions.
-0.3 -0.25 -0.2 -0.15 -0.1 -0.05 0 0.05 0.1 0.15 0.2
1 2 3 4 5 6 7 8 9 10 11 12 13 14 15 16 17 18 19 20 21 22 23 24 25 26 27 28 29 30 31 32 33 34 35 36 37 38 39 Series1
Figure 2: Differences between means of responses to CPQ-PP and CPQ-computer
Below we provide a phase-by-phase description (refer to Table 2 above and Appendix 8 for details of questions and the phases they were related to) of the processes involved in writing the essay under two different conditions as reported by the students in the surveys.
Phase 01: Goal setting
In this phase, there is a very high degree of agreement among the participants, who, in general, first read the title and instructions very carefully and then interpret them by thinking of what and how to write in order to meet the requirements. They did not seem to have major problems understanding the instructions. Although the percentage of agreement with Question 4 does not seem to be as high as those of the others, a closer look at the statistics suggests that quite a number of students opted for ‘no view’ for this question, probably because they did not think of how to satisfy readers or examiners in their preparation for the writing. But the disagreement rate is very low, only 16.1% and 15.0% respectively for the P&P and computer versions. So for those who underwent this process at this stage of writing, a majority of them agree that they were trying to satisfy readers or examiners.
Phase 02: Topic and genre modifying
In this phase, only statement 08 exhibits a strong degree of agreement, suggesting that about half of the students know a lot about this type of essay, ie an argumentative essay. Agreement over familiarity with the topic and other types of essays, eg descriptive, narrative, is quite low, implying unfamiliarity with the topic and a less developed background knowledge of the essay types. This is possibly due to the fact the topics of both tasks are from the Arts, which is not particularly relevant to the field of study of the Chinese group, who are from a university of science and technology. The Turkish candidates, another major group of candidates, were participating in a language improvement course and were therefore not expected to have a good knowledge of the essay types.
Phase 03 and 04: Generating ideas and organising ideas
In the phase of generating ideas, there is no consensus as to whether ideas occurring to them at the beginning are complete or not for both groups. Neither is there a strong consensus among the students as to whether the ideas occurring to them are well organised or not.
With regard to the process of outline planning, about two thirds of the candidates reported that they planned an outline on paper or in their heads before starting to write. The ‘biggest’ mean difference (0.27) occurs in Question 14 suggesting that when using a computer they were fractionally more likely to think of most of their ideas while planning an outline (see Figure 2 above). All other differences between means of responses to the questionnaire were less than 0.2 and in all cases except 1 less than 0.15 (see Figure 2).
The responses to Question 15 suggests that mother tongue was frequently used for generating ideas while writing the essay because less than one third of the students thought of the ideas only in English. A majority of the students reported that, while writing the essay, they were able to prioritise the ideas and remove some ideas while putting them in good order, though not all of them agree that this is an easy job.
Phase 05: Translating
In this phase, about 40% of the candidates agree that they were able to express ideas using the appropriate words, but only half of them felt it was easy to do this. A higher percentage (about 60%) agree that they were able to express ideas using correct sentence structures, but not all of them agree this is an easy job. Most of them thought of their ideas for the essay WHILE they were actually writing it. Coherence and cohesion do not seem to be a big problem for them because about two thirds agree that they were able to develop paragraphs by putting sentences in logical order in the paragraph and to connect their ideas smoothly in the whole essay.
Phase 06: Reviewing
In this final phase, more than half of the students tried not to write more than the required number of words. A consistently higher percentage of the students reviewed the correctness of the contents and their order, the appropriateness of the contents and their order, the correctness of sentences, and the appropriateness of words WHILE writing the essay than that of the students who did the reviews AFTER finishing the essay. This is a good indication of the use of monitoring strategy in the process of writing.
Most of them were unable to write a draft essay in this test before writing it again neatly within the given time. A majority of them did not feel it was easy to review or revise the whole essay.
To summarise, the analysis of the data suggests that no major differences can be identified for most of the processes at various stages of writing under the two different conditions.
5
CONCLUSIONS AND RECOMMENDATIONS
5.1 SummaryThis study set out to investigate whether there were meaningful differences either in scores achieved for written performance or in the internal processing of candidates where a language test is presented in two modes – pencil-and-paper and computer. Participants were asked to sit for a test consisting of two equivalent tasks in all respects except that one was written directly onto computer, and the other written on paper. The resulting scripts were later rated by trained and experienced IELTS examiners working independently. Before the test, candidates completed a computer familiarity and anxiety questionnaire (CFQ), and immediately after each task completed a cognitive processing questionnaire (CPQ) which was meant to gather evidence of the internal processing undertaken during the two task performances.
The most important conclusion from the study is that there are no significant differences in the scores awarded by two independent raters for candidates’ performances on the tests taken under two
conditions, one paper-and-pencil and the other computer. Major supporting statistics for the conclusion include:
̇ The difference between the means of test scores in two modes is 0.046 for the whole group; paired Sample T-test shows the difference for the whole group is statistically not significant.
̇ Multi-Faceted Rasch analysis confirmed this result, and demonstrated that the intra-rater reliability was acceptable.
̇ Among these students, 60.7% of the candidates were awarded the same or half a band more or less, and for 87% of them, the difference between the bands awarded to their performances on the two versions falls within one band.
̇ The multidimensional scaling data shows low stresses and high RSQs for both raters’ scores on two versions of the test, which provides evidence to support the similarity of the language ability structures underlying test-takers’ performance ratings on the two versions, that is, it is highly plausible that the two versions were testing the same language ability.
CFQ survey shows that these students in general are familiar with computer usage and their overall reactions towards working with a computer are positive. Statistics show that a majority of them:
̇ have frequent access to and use computers very frequently at university and at home
̇ use computers for surfing the internet, electronic communication and word processing
̇ have confidence in their ability to use computers and use the keyboard for typing. To find out if computer familiarity has any effect on students’ performances on the two modes, descriptive statistics were calculated for the scores of participants who chose the extreme ends of the options for each question in the CFQ. The results show that the effect of computer familiarity on their performances on the two modes is negligible for most of the items in the questionnaire. However, differences of up to half a band were detected in two areas: accessibility of public computers and frequency of word processing activity.
Factor analysis of the questionnaire data suggests that there are four factors, which can be identified. These factors are: affect; familiarity; computer usage; and access to computers outside the home. With respect to the cognitive processes students employ in performing under the two conditions of the test, results of the CPQ survey indicate a similar pattern between the cognitive processes involved in
5.2 Discussion
The most important contribution of this study may be that the methodology adopted here offers a useful addition to the equivalence debate (eg McDonald, 2002), by operationalising our definition of construct to include an understanding of equivalence in terms of internal processing (theory-based validation).
The results we arrived at in the study appear to add to the confused state of the literature reported earlier. The score data appear to support the findings of Neuman & Baydoun (1998) who found no significant difference in scores achieved even under ‘speeded’ conditions. The discussion over which mode results in higher scores (Daiute, 1985, argued that computer mode would result in lower scores, while Russell and Haney, 1997, argued the opposite) is confounded by these results, where it was very clear that there was no significant difference overall.
Finally, the results from the familiarity and anxiety questionnaire suggest an agreement with the findings of Shermis and Lombard (1998) who found no link between performance on computerised tests and computer anxiety – though it should be pointed out that the high levels of computer
accessibility and low levels of computer anxiety reported here may have skewed the results somewhat. The nature of this type of study, in particular the difficulty in recruiting a large number of
participants for two quite different task performances, means that the overall population is relatively small. However, the population is large enough for us to make relatively definitive statements about their performance. What is more worrying is the relatively low level of language ability of the candidates, and clearly any future replication or expansion of this study should include candidates at the upper end of the ability range.
A further complication is that task difficulty is not a feature of the task itself but is affected by the interaction between test-takers and the task and is therefore sample dependent as are all reliability and correlation coefficients (Sawilowsky, 2000). What this means is that though two tasks may exhibit equivalence with one population, this may not necessarily hold true for another. Equivalence needs to be checked for any administration of tests for research or other purposes. In research designs such as the one used in this study, achieving complete equivalence of task may not be possible unless anchor groups take both forms of the test in each mode. In the study reported here, where it was inappropriate for a candidate to do the same test in both modes, we took the view that establishing acceptable boundaries of equivalence within which we could have confidence was a suitable modus operandi. A limitation of this study lies in the rating process. While trained and experienced raters were used who demonstrated a high degree of intra and inter-rater consistency, there is nevertheless some concern over the possible contaminating effect of handwritten versus typed scripts. To investigate this potential source of construct irrelevant variance a follow up study is recommended in the next section.
5.3 Future research
Further investigations that need to be carried out, if the CBA version is to be in real use, either as a surrogate of the paper-and-pencil version or as an independent test, include:
̇ running SEM analysis based on the results of factor analysis to identify possible structural patterns of effects of computer familiarity on students’ performances
̇ the analysis of candidates’ writing scripts to find out if there are substantive differences in written output (in terms of text length, rhetorical structure and mechanical control) between the two output modes
̇ an introspection study to tap, in a more direct manner, the cognitive processes involved in writing in the two modes as a triangulation of the CPQ survey data
̇ retrospection (questionnaire) from raters on both versions for their views of any format effect
̇ inputting of pencil-and-paper tests to computer files to enable us to investigate the effect on the rating process of using the two modes.