R E S E A R C H
Open Access
Eye-tracking and artificial intelligence to
enhance motivation and learning
Kshitij Sharma
1*, Michail Giannakos
1and Pierre Dillenbourg
2* Correspondence:kshitij.sharma@ ntnu.no
1Department of Computer Science,
Norwegian University of Science and Technology, Trondheim, Norway
Full list of author information is available at the end of the article
Abstract
The interaction with the various learners in a Massive Open Online Course (MOOC) is often complex. Contemporary MOOC learning analytics relate with click-streams, keystrokes and other user-input variables. Such variables however, do not always
capture users’learning and behavior (e.g., passive video watching). In this paper, we
present a study with 40 students who watched a MOOC lecture while their eye-movements were being recorded. We then proposed a method to define stimuli-based gaze variables that can be used for any kind of stimulus. The proposed
stimuli-based gaze variables indicate students’content-coverage (in space and time)
and reading processes (area of interest based variables) and attention (i.e.,
with-me-ness), at the perceptual (following teacher’s deictic acts) and conceptual levels
(following teacher discourse). In our experiment, we identified a significant mediation effect of the content coverage, reading patterns and the two levels of with-me-ness
on the relation between students’motivation and their learning performance. Such
variables enable common measurements for the different kind of stimuli present in distinct MOOCs. Our long-term goal is to create student profiles based on their performance and learning strategy using stimuli-based gaze variables and to provide students gaze-aware feedback to improve overall learning process. One key
ingredient in the process of achieving a high level of adaptation in providing gaze-aware feedback to the students is to use Artificial Intelligence (AI) algorithms for prediction of student performance from their behaviour. In this contribution, we also present a method combining state-of-the-art AI technique with the eye-tracking data to predict student performance. The results show that the student performance can be predicted with an error of less than 5%.
Keywords:Eye-tracking, Motivation, Learning, MOOCs, Video based learning, Multimodal analytics, Massive open online courses, Deep learning
Introduction
We present a study to investigate how well stimuli-based gaze analytics can be utilized to enhance motivation and learning in Massive Open Online Courses (MOOCs). Our work seeks to provide insights on how gaze variables can provide students with gaze-aware feedback and help us improve the design, interfaces and analytics used as well as provide a first step towards gaze-aware design of MOOCs to amplify learning.
The evidence for understanding and supporting users’ learning is still very limited, considering the wide range of data produced when the learner interacts with a system (e.g., gaze Prieto, Sharma, Dillenbourg, & Jesús, 2016). Devices like eye-trackers have become readily available and have the capacity to provide researchers with unprece-dented access to users’attention Sharma, Jermann, & Dillenbourg,2014). Thus, besides commonly used variables coming from users’ click-streams, keywords and preferences, we can also use eye-tracking variables to accurately measure students’attention during their interaction with learning materials (e.g., MOOC lectures).
A multitude of factors affect academic performance of the students: previous grades (Astin, 1971), students’ efforts and motivation (Grabe & Latta, 1981), socioeconomic differences (Kaplan, 1982), quality of schooling (Wiley,1976), attention (Good & Beck-erman, 1978) and participation (Finn, 1989). In this contribution, we address the gen-eral question ofhow gaze-variables (related to students’reading and attention) can help students to watch MOOC videos more efficiently? We tackle this question from a teacher’s perspective (how much student follows the teacher) and call it this gaze-based measure “with-me-ness”. With-me-ness is defined in two levels: (1) perceptual (follow-ing teacher’s deictic acts) and (2) conceptual (following teacher discourse). Specifically, in this contribution, we address the following two questions:
1. How eye-tracking behaviour mediates the relationship between students’
mo-tivation and learning within a MOOC?.
2. How well we can predict the learning gain and motivation from the
eye-tracking data in its most basic form?
In order to answer these questions, we define variables using the stimulus (video lec-ture) presented to the students. These variables are defined using information from the stimulus with the different levels of details. Once, we have the variables, we perform mediation analysis to answer the first questions. To answer the second question, we utilize one of the most basic eye-tracking visualisations,“Heat-maps”(Špakov & Minio-tas, 2007) to extract features and use state-of-the-art machine learning algorithms to predict the students’learning gains.
Related work Video based learning
The use of educational videos has been widely employed in the past years. Educational videos is a vital element in several online learning forms (in a MOOC, or how-to video tutorial), students spend enormous amount of time watching various forms of educa-tional videos (Seaton, Bergner, Chuang, Mitros, & Pritchard, 2014). Educational videos have been studied extensively during the last decades, through the lenses of empirical studies and theories (Giannakos,2013). One of the most commonly acceptes theoretical angles it the one of the Cognitive Theory of Multimedia Learning (CTML, Mayer & Moreno, 2003), CTML provides several insights on how video-based learning (and multimedia in general) can be used effectively.
that visual information helps to process and remember verbal information and vice versa. This argument was strengthened by cue-summation theory showing that learning performance in the combined audio and pictures was better than in the combined audio and text, if the numbers of available cues or stimuli are increased (Severin,1967). The major benefits of video as a facilitator of educational content include presentation of detailed information (with text and image), efficient engagement of students’ atten-tion, simulating discussions and providing concrete real life examples with visualiza-tions (Schwartz & Hartman,2007).
During the last year, video-based learning practices are applied in a variety of ways, such as the flipped classroom, small private online courses (SPOCs), and xMOOCs. Today, advanced video repository systems have seen enormous growth (e.g. Khan Academy, PBS Teachers, Moma’s Modern Teachers, Lynda) through social software tools and the possibilities to enhance videos on them (Giannakos,2013).
Existing research on video-based learning involves many features of today’s MOOCs lectures. Volery and Lord (2000) identified 3 success factors in online education: usable and interactive technology design, instructors’enthusiasm and interest in the tool and students’exposure to the web. Tobagi (1995) developed an online distant learning sys-tem to capture lectures real time, compress them, store them on an on-demand syssys-tem and transmit the videos to internal server. The on-demand video system server elimi-nated distance limitations and provided time independent access to study material.
Tobagi (1995) compared different modalities of video lectures (interactive video, in-structional television and television) and preconceptions of difficulty for different modal-ities and found that there was no significant difference in the learning outcome but there was a significant difference in the level of preconceived difficulty in television and inter-active videos. Cennamo, Savenye, and Smith (1991) studied the effect of video based in-struction on students problem solving skills and attitude towards mathematics and instruction and concluded that there was a significant improvement after the treatment in students problem solving and mathematical skills as well as the instructional attitude.
Choi and Johnson (2005) compared learning outcome and learners motivation (atten-tion, relevance, confidence, satisfaction) in video based learning to traditional textual-instruction based learning and found no difference in learning outcome for the two conditions. However, the students wore more attentive in video based learning condi-tion that the textual-instruccondi-tion condicondi-tion.
Video lectures have several affordances besides those relying to traditional fast-forward and rewind interactions. Innovative features, such as slide-video separation, social categorization and navigation, and advanced search, have also been used recently in video learning platforms (Giannakos, Chorianopoulos, & Chrisochoides,2015). All this amount of interactions can be converted via analytics into useful information that can be used to support learning (Kim et al., 2014). As the number of learners and the diversity of col-lected data grows, our ability to capture richer and more authentic learning patterns grows as well, allowing us to create new affordances that amplify our learning capacity.
Eye-tracking and education
the learning processes and different levels of outcome in a multitude of learning scenar-ios. Prieto et al. (2016), used eye-tracking data to explain the cognitive load that the teachers experience during different classes and various scenarios. These scenarios in-clude different factors such as experience of the teacher, size of the class, presence of a new technology and presence of a teaching assistant. The results show that the eye-tracking data is an important source of information explaining different factors in teachers’orchestration load and experience.
Eye-tracking has also been used in online learning for both in individual (Kizilcec, Papa-dopoulos, & Sritanyaratana,2014) and collaborative (Sharma, Caballero, Verma, Jermann, & Dillenbourg,2015a,b) settings. Sharma et al. (2014) focus on capturing the attention of the individual learners in a video-based instructional setting to find the underlying mecha-nisms for positive learning outcome; Sharma et al. (2015a,b) also focus on joint attention in remote collaborative learning scenarios to predict the learning outcome.
In general, eye-tracking allows us to generate rich information, but it can be challen-ging to identify what information is processed and retained based on human’s gaze. The eye-mind hypothesis (Just & Carpenter, 1980) proposes that there is a connection between people gaze and attention, if people process the information that they visually attend to. In this contribution, we utilize eye-tracking to measure students’ attention and then address how students’attention (i.e.,“with-me-ne”) has the capacity to medi-ate the relationship between students’motivation and learning within a MOOC video.
Methodology
Participants and procedure
A total of 40 university students (12 females) from a major European university partici-pated in the experiment. The only criterion for selecting the participant was that each participant took the introductory Java course in the previous semester. This is also a prerequisite for taking the Functional Programming in Scala course at the university campus. The participants watched two MOOC videos from the course“Functional Pro-gramming Principles in Scala”and answered programming questions after each video.
Upon their arrival in the experiment site the participants signed a consent form and an-swered the study processes questionnaire (SPQ, Biggs, Kember, & Leung, 2001). Then watched the two MOOC videos and answered the quiz based on what they were taught in the videos. During their interaction with the MOOC videos their gaze was recorded, using SMI RED 250 eye-trackers.
Based on these reasons it is safe to say that 40 participants are indeed enough to arrive at the conclusions that our paper is deriving with the present study.
Moreover, in recent eye-tracking research we see similar sizes of the population used. For example, in two recent systematic reviews (Alemdag & Cagiltay,2018; Ashraf et al., 2018) with a combined 85 different eye-tracking studies the majority (84.71%) of the studies had between 8 and 60 participants. The papers cited in this contribution with eye-tracking research also have the number of participants between 10 and 40 partici-pants (except the collaborative studies where the researchers had 28 to 40 pairs).
Measures
The measures used in our study were: content coverage, scanpath (a combination of the fixations and saccades in the order of appearances) based variables, students/ teacher co-attention (i.e., with-me-ness) coming from eye-tracking, students’motivation coming from SPQ and students learning (coming from the final test).
The eye-tracking variables are defined using the semantics of the stimulus, that is the video lecture in our case. We define eye-tracking variables at four levels (see Table 1). First, the content coverage has no semantics from the video. Second, the scanpath based variables required us to define areas of interest on the video. Third, the percep-tual with-me-ness was computed using the areas of interest and the pointing gestures of the teacher. Finally, the conceptual with-me-ness was defined using the areas of interest definitions and the dialogue of the teacher.
Content coverage
Content coverage is computed using the heat-maps (for details on heat-maps see Holmqvist et al. 2011) of the participants. We divided the MOOC lecture in slices of 10 s each and computed the heat-maps for each participant. Following are the steps to compute attention points from the heat-maps:
1. Subtract the image without heat-map (Fig.1b) from the image that has the heat-map (Fig.1a).
2. Apply connected components on the resulting image (Fig.1c)
3. The resulting image with connected components identified (Fig.1d) gives the attention points.
4. The combined area of attention points in a given time window represents the content coverage of that time window.
Scanpath based variables
AOI misses An area of interest (AOI) was said to be missed by a participant who did not look at that particular AOI at all during the period the AOI was present on the screen. In terms of learning behaviour AOI misses would translate to completely ignor-ing some parts of the slides. We counted the number of such AOIs per slide in the MOOC video as a scan-path variable and compare the number of misses per slide across the levels of performance and learning strategy (for details on areas of interest see Holmqvist et al.2011).
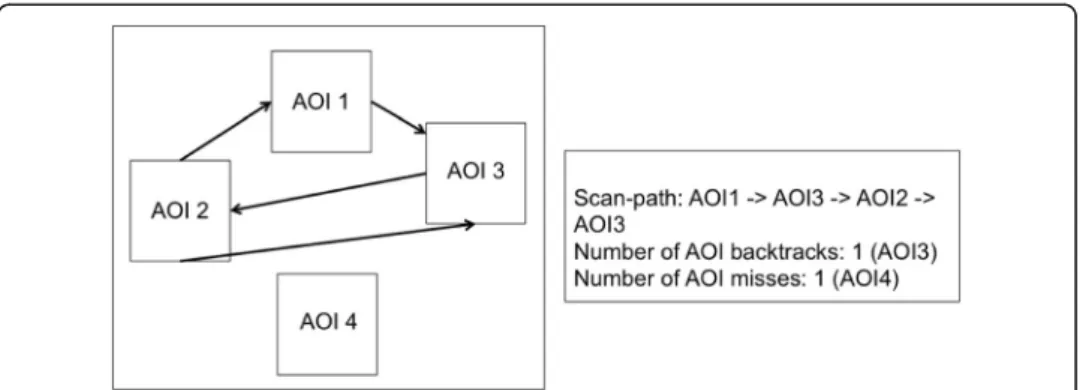
AOI backtracks A back-track was defined as a saccade that went to the AOI which is not in the usual forward reading direction and had already been visited by the student. For example, in the Fig.2, if a saccade goes from AOI3 to AOI2 it would be counted as a back-track. AOI back-tracks would represent rereading behaviour while learning from the MOOC video. The notion of term rereading in the present study was slightly differ-ent than what is used in existing research (for example, Millis and King (2001), Dow-hower (1987) and Paris and Jacobs (1984)). The difference comes from the fact that in the present study the students did not reread the slides completely but they can refer to the previously seen content on the slide until the slide was visible. We counted the number of back-tracks per slide in the MOOC video as a scan-path variable and
Fig. 1Top-left: An example slide. Top-right: the same slide overlaid with the heatmap. Bottom-left: Resulting image after subtracting image without the heat-map (top-left) from heat-map overlaid image (top-right). Bottom-right: applying connected components to the bottom-left image
Table 1Eye-tracking measurements and level and type of semantics involved in defining those variables
Eye-tracking Measurements Level of semantics Type of semantics involved
Content Coverage Low Only Stimulus
Scanpath based variables Medium Areas of interest definition
compared the number of back-tracks per slide across the levels of performance and motivation (Fig.3shows the typical AOIs on a slide).
With-me-ness
With-me-ness measures how much the student is paying attention to what the teacher is saying or pointing at (Sharma et al., 2014; Sharma et al.,2015a, b). With-me-ness is defined at two levels of teacher-student interaction: perceptual and conceptual.
Perceptual with-me-ness
Perceptual with-me-ness measures if the student looks at the items referred to by the teacher through deictic acts (sometimes accompanied by words like, here, this variable or only by verbal references, like, the counter, the sum). Deictic references are imple-mented by using two cameras during MOOC recording, one that captures the teacher’s face and one, above the writing surface, that captures the hand movements. In some MOOCs, the hand is not visible but teacher uses a digital pen whose traces on the dis-play (underlining a word, circling an object, adding an arrow) act as a deictic gestures.
Fig. 2A typical example of a scanpath (left); and the computation of different variables (right)
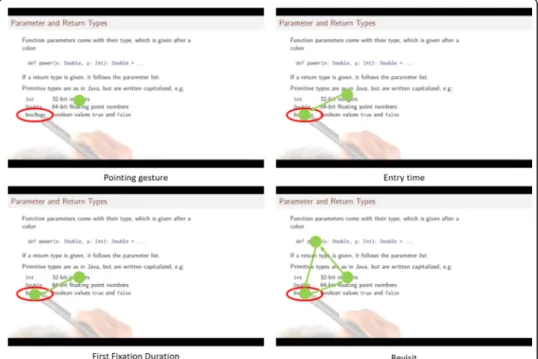
The perceptual“With-me-ness”has 3 main components: entry time, first fixation dur-ation and the number of revisits (Fig. 4). Entry time (Fig. 4 top-right) is the temporal lag between the times a referring pointer appears on the screen and stops at the re-ferred site (x,y) and the first time the student’s gaze stops at (x,y). First fixation dur-ation (Fig. 4bottom-left) is how long the student gaze stops at the referred site for the first time. Revisits (Fig. 4 bottom-right) are the number of times the student gaze comes back to the referred site. The measure of perceptual with-me-ness is an arith-metic combination of these components (FFD= First Fixation Duration; ET= Entry Time;NumRV= Number of revisits;RV= Re Visit duration):
Perceptual With me ness¼
FFD−ETþ X NumRV
i¼1
RVi
Total duration of the deictic reference
The with-me-ness measurement has also been used by Sharma et al. (2014 and 2015a,b) to measure how much time the students spent in following the teacher’s deic-tics and dialogues. Sharma et al. (2014 and 2015a,b) found this measure to be corre-lated to the learning gains of the students. We have extended the analyses to include the student motivation as an independent variable, learning as the dependent variable and gaze behavior as the mediating variable.
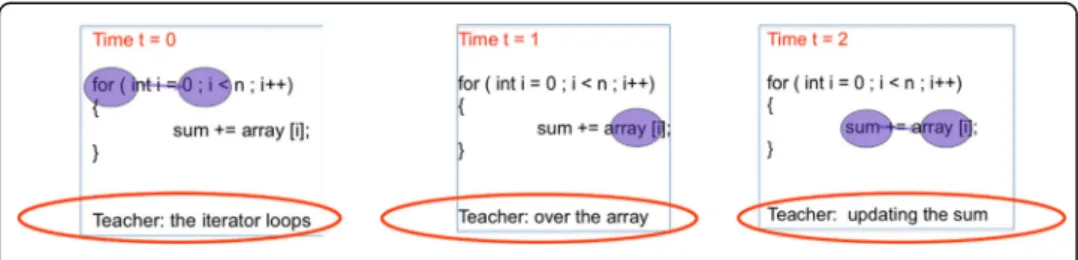
Conceptual with-me-ness
Conceptual with-me-ness is defined by the discourse of the teacher (i.e., to what extend students look at the object that the teacher is verbally referring to) Fig. 5provides an example. Thus, conceptual with-me-ness measures how often a student looks at the
objects verbally referred to by the teacher during the whole course of time (the complete video). In order to have a consistent measure of conceptual “With-me-ness” we normalize the time a student looks at the overlapping content by slide duration.
Motivation
We used the motivation scales from the SPQ (Biggs et al., 2001). This is a 5-point Likert scale questionnaire containing 10 questions (5 for deep and 5 for surface motiv-ation). Deep motivation is defined as having the intrinsic motivation towards learning, while the surface motivation is defined as fear of failing in the tests ((Biggs et al., 2001)). In this study we used the mean motivation (mean of deep and surface) that has an average value of 2.10 (Std. Dev. = 1.20).
Learning
At the end of the videos the students took a test about the content they were taught in the two videos. The score from this test was considered to be the learning performance in this paper. After this point, we would refer to this as learning. The mean learning value was 6.9 out of 10 (Std. Dev. = 1.6). For the test, the instructor of the MOOC helped the authors to create the multiple-choice quiz for the two videos. This quiz was similar to the one used in the MOOC running at Coursera platform.
Data analysis
Mediation analysis
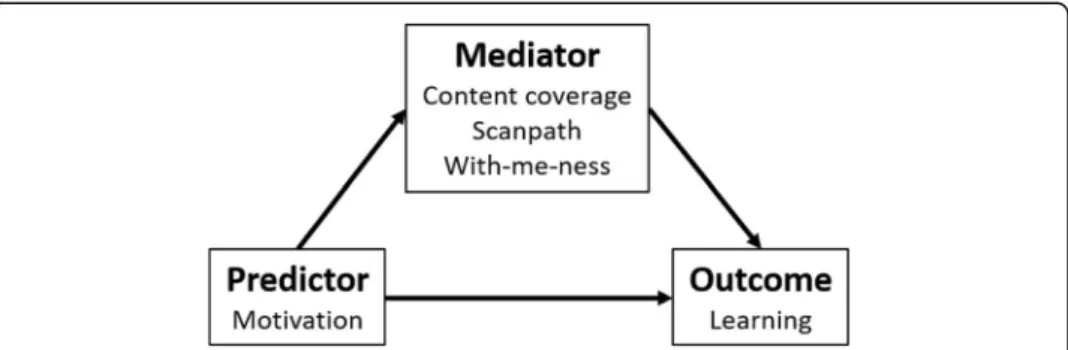
To identify how “with-me-ness” (measured by eye-tracking) mediates the relationship between students’motivation (measured by the questionnaire) and learning (measured by the post quiz) within a MOOC we employ mediation analysis proposed by Baron and Kenny (1986). In our analysis, we used motivation as the predictor, learning as the outcome and gaze behaviour as the mediating variables. Figure6 shows the schematic representation of the model.
To examine with-me-ness capacity to mediate the relationship between motivation and learning we followed Baron and Kenny (1986) three steps process: a) the predictor (i.e., motivation) must significantly influence the mediator (i.e., with-me-ness); b) the predictor (i.e., motivation) must significantly influence the outcome (i.e., learning); c) both predictor and mediator are employed to predict the outcome: if both of them sig-nificantly affect the dependent variable, then this mediator partially mediates the im-pact of the predictor independent variable on the outcome; if the influence of mediator is significant but the influence of predictor is not, then mediator fully mediates the im-pact of predictor on outcome.
Learning outcome and motivation prediction: feature extraction
For predicting the learning outcome from the behaviour data, we used the heat-maps and a pretrained deep neural network to generate the features. Figure7shows the basic working pipeline to extract the features from the heatmap image to the basic feature vector. Following are the steps to extract features from the eye-tracking data and the video lecture.
1. Overlay the eye-tracking data on the video to create the heatmap.
2. Create the heatmap image from every presentation slide in the video lecture (this step resulted into 15 heatmap image per participant).
3. Use the pretrained VGG-19 (Simonyan & Zisserman,2014) deep neural network architecture to extract the 1000 features per image.
4. Use a non-overlapping and sliding window of size 10 to reduce the number of fea-tures to 100.
Feature selection for learning outcome and motivation prediction: least absolute shrinkage selection operator
To select the most important features we employ the Least Absolute Shrinkage and Se-lection Operator (LASSO, Tibshirani,1996). LASSO is an extension of Ordinary Least Square (OLS) regression techniques fit for the cases where the number of examples is
Fig. 6Schematic representation of mediation effect and the example from the present contribution
less than the length of the feature vector (Tibshirani, 1996). To find the best fitting curve for a set of data points, OLS tries to minimize the Residual Sum of Squares (RSS) which is the difference between the actual values of the dependent variable y and the fitted valuesŷ. The formulation of the OLS is given as follows:
^
y¼α0þβ1x1þβ2x2þ…þβnxn
The objective of the OLS regression is to minimize the difference between Pð^y−yÞ2
with the constraint that Pβ2i≤s. Wheresis called the shrinkage factor. LASSO on the other hand performs similar optimization with the slight difference in the constraint, which is now ∑ ∣βi∣ ≤s. While using LASSO, some of theβi will be zero. Choosings
is like choosing the number of predictors in a regression model. Cross-validation can be used to estimate the best suited value for s. Here, we used a 10-fold cross-validation to select the appropriate value ofs.
Learning outcome and motivation prediction and prediction evaluation
In order to predict the learning outcome of the students, we used several prediction al-gorithms. These algorithms include Gaussian process models (Rasmussen, 2003) with linear and polynomial kernels, Support Vector machines (SVM, Scholkopf & Smola, 2001) also with linear and polynomial kernels, Random forest (Liaw & Wiener,2002), Generalised Additive Models (GAM, Hastie (1993) and Hastie and Tibshirani, 1990). The main reason for using these particular algorithms is that these are designed to han-dle datasets that have high frequency for fewer examples.
We divided the whole dataset into training (80%, 32 students) and testing (20%, 8 stu-dents). For removing the selection bias from the training set, we performed a 5-fold validation. The results reported are the average error rate for all the cross-validation iterations.
For evaluating our prediction results, we are using the Normalized Root Mean Squared Error (NRMSE). NRMSE is the proposed metric for student models (Pelánek,2015), and is used in most of the articles in learning technology (Moreno-Marcos, Alario-Hoyos, Muñoz-Merino, & Kloos,2018) for measuring the accuracy of learning prediction.
Results
To answer the first research question about the mediation effect of the gaze behaviour on the relation between learning and motivation, we will present the mediation analyses with content coverage, scanpath variables and with-me-ness. Further, to answer the second research question about the predicting ability of simplistic gaze variables, we will present the prediction results for both the students’motivation and their learning.
Content coverage
not significant when content coverage variable were added. In Table 2 we present the results of the mediation analyses (row one for content coverage).
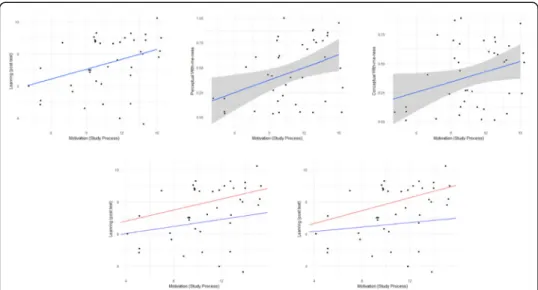
We observe that learning can be significantly predicted by motivation and that con-tent coverage can be predicted by motivation. Finally, there is a significant prediction of learning by motivation and content coverage, however the coefficient of motivation is not significant anymore. Thus we can conclude that the content coveragefully medi-ates the relation between motivation and learning. The positive correlation between the motivation and learning is higher for the students with the higher content coverage than the positive correlation between motivation and learning for the students with the lower content coverage. It is clear from Fig. 8 that the students with high motivation have higher chances of getting a high score if they have high content coverage than the students with lower motivation.
Scanpath variables
To examine the mediation effect of scanpath variables we tested the model shown in Fig.9 with both the AOI misses and the AOI backtracks of scanpath variables. As shown in Table 2, the direct link between motivation and both scanpath variables was significant and hence satisfied the first condition. The link between motivation and learning was also significant and hence satisfied the second condition as well. However, the direct relation-ship between motivation with learning was still significant when scanpath variables (mis-ses and backtracks) were added. In Table 2 we present the results of the two mediation analyses (row two for AOI misses and row three for AOI backtracks).
We observe that learning can be significantly predicted by motivation and that percep-tual with-me-ness can be predicted by motivation. Finally, there is a significant prediction of learning by motivation and AOI backtracks, however the coefficient of motivation is
Fig. 8Left: learning predicted by motivation. Middle: content coverage predicted by motivation. Right: learning predicted by motivation (red= high content coverage,blue= low content coverage)
Table 2Mediating effect tests
Predictor (Pr)
Mediator (M) Outcome
(O)
Pr➔ M
Pr➔ O
Pr + M➔O Mediating effect
Pr M
Motivation Content coverage Learning 3.98*** 2.40 * 1.35 3.09*** Full mediation Motivation AOI misses Learning −2.26** 2.40 * 2.04* −2.39* Partial mediation Motivation AOI backtracks Learning 2.41* 2.40 * 2.15* 2.58* Partial mediation Motivation Perceptual with-me-ness Learning 2.69** 2.40* 1.40 2.30** Full mediation Motivation Conceptual with-me-ness Learning 2.05** 2.40* 1.57 2.90** Full mediation
still significant. Thus we can conclude that the AOI backtracks only partiallymediates the relation between motivation and learning. We can see that the correlation between the motivation and the learning is more positive for the students with high number AOI backtracks than that for the students with low number of AOI backtracks. It is clear from Fig.9that the students with high motivation have higher chances of getting a high score if they perform more AOI backtracks than the students with lower motivation.
Next, we observe that that learning can be significantly predicted by motivation, and that AOI misses can be predicted by motivation. Also, there is a significant prediction of learning by motivation and AOI misses, however the coefficient of motivation is still significant anymore. Thus we can conclude that the AOI misses onlypartiallymediates the relation between motivation and learning. We can see that the correlation between the motivation and the learning is more negative for the students with high number AOI misses than that for the students with low number of AOI misses. It is clear from Fig.9that the students with low motivation have higher chances of getting a low score if they miss more AOIs than the students with higher motivation.
With-me-ness
To examine the mediation effect of with-me-ness we tested the model shown in Fig. 10 with both the perceptual and the conceptual variables of with-me-ness. As shown in Table 2, the direct link between motivation and both variables of with-me-ness was significant and hence satisfied the first condition. The link between motivation and learning was also significant and hence satisfied the second condition as well. Moreover, the direct relation-ship between motivation with learning was not significant when with-me-ness variables (perceptual and the conceptual) were added. In Table2we present the results of the two mediation analyses (row four for perceptual and row five for conceptual with-me-ness).
prediction of learning by motivation and perceptual with-me-ness, however the coeffi-cient of motivation is not significant anymore. Thus, we can conclude that the percep-tual with-me-ness fully mediates the relation between motivation and learning. We can see that the correlation between the motivation and the learning is more positive for the students with high perceptual with-me-ness than that for the students with low perceptual with-me-ness. It is clear from Fig.10that the students with high motivation have higher chances of getting a high score if they high perceptual with-me-ness than the students with lower motivation.
Next, we observe that that learning can be significantly predicted by motivation, and that conceptual with-me-ness can be predicted by motivation. Also, there is a signifi-cant prediction of learning by motivation and conceptual with-me-ness, however the coefficient of motivation is not significant anymore. Thus we can conclude that the conceptual with-me-ness fully mediates the relation between motivation and learning. We can see that the correlation between the motivation and the learning is more posi-tive for the students with high conceptual with-me-ness than that for the students with low conceptual with-me-ness. It is clear from Fig.10that the students with high motiv-ation have higher chances of getting a high score if they high conceptual with-me-ness than the students with lower motivation.
Prediction results
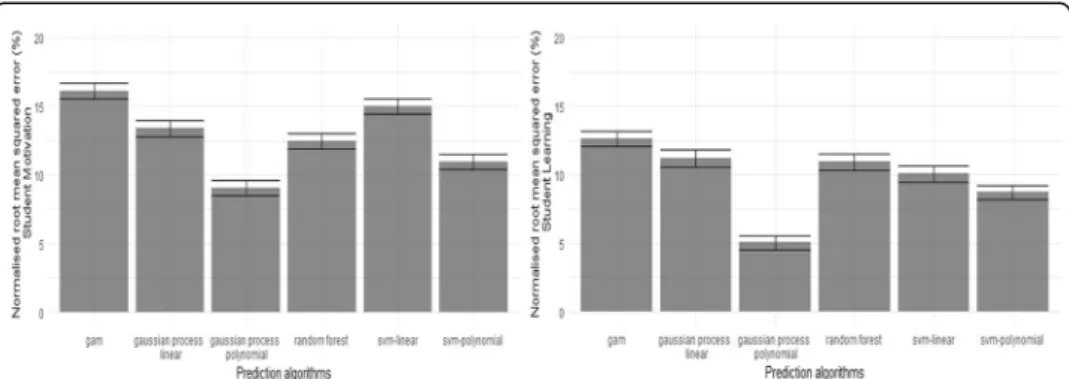
Figure 11 shows the prediction results for the students’ learning and motivation. For learning prediction, we observed a minimum error of 5.04% (SD = 0.52%) using the Gaussian Process Model with a polynomial kernel. The second least error of 8.07% (SD = 0.54%) was obtained using a Support Vector Machine also with a polynomial ker-nel. The worst error rate was found to be 11.18% (Sd = 0.63%) using the Generalised additive models. For motivation prediction, we observed similar performances with the prediction algorithms. We observed a minimum error of 9.04% (SD = 0.56%) using the
Gaussian Process Model with a polynomial kernel. The second least error of 10.98% (SD = 0.57%) was obtained using a Support Vector Machine also with a polynomial ker-nel. The worst error rate was found to be 16.11% (Sd = 0.63%) using the Generalised additive models.
Discussions and conclusions
The reported study developed and empirically explored two models, where teacher/stu-dent co-attention (i.e., with-me-ness) were found to mediate the relationship of motiv-ation and learning in MOOC videos. These two models demonstrated how the aspect of co-attention, not only influences learning, but also affects the effect of motivation in learning. Quantifying an often-overlooked element (i.e., instructor’s capacity to draw student’s attention) in online courses.
The attention points, derived from the heat-maps, were indicative of the students’ at-tention both in the terms of screen space and time. The area of the atat-tention points depended on the time spent on a specific area on the screen. Higher average area of the attention points could be interpreted as more reading time during a particular period. The good performing students having a higher motivation had the highest con-tent coverage (larger areas of the atcon-tention) among all the participants, despite having spent the similar time on the slides.
However, more reading time did not always guarantee higher performance. Byrne, Freebody, and Gates (1992) showed the inverse in a longitudinal reading study by prov-ing that the best performprov-ing students were the fastest readers. On the other hand, Reinking (1988) showed that there was no relation between the comprehension and reading time. As Just and Carpenter (1980) put “There is no single mode of reading. Reading varies as a function of who is reading, what they are reading, and why they are reading it.” The uncertainty of results about the relation between the performance and the reading time led us to find the relation between the reading time, performance and learning motivation. We found that the good-performers had more reading time than poor-performers and the high motivated-learners had more reading time than low motivated-learners. We could interpret this reading behaviour, based upon the reading time differences, in terms of more attention being paid by the good performing stu-dents having a high learning motivation than other student profiles. We could use
Fig. 11Different prediction algorithms to predict the student’s learning (from the tests) and their motivation (from the study process questionnaire). In both the case the top two prediction algorithms are Gaussian process models with polynomial kernel and the Support Vector Machine also with a
content coverage to give feedback to the students about their attention span. Moreover, one could use the content coverage for student profiling as well based on the perform-ance and the learning motivation.
The area of interest (AOI) misses and back-tracks were the temporal features com-puted from the temporal order of AOIs looked at. We found that good-performers with high motivation had significantly fewer AOI misses than the poor-performers with low motivation. AOI misses could be useful in providing students with the feedback about their viewing behaviour just by looking at what AOIs they missed.
The AOI back-tracks were indicative of the rereading behaviour of the students. We found that the good performers and highly motivated learners had significantly more back-tracks than the poor-performers. Moreover, some of the good-performers back-tracked to all the previously seen content, this explains the special distribution of AOI back-tracks for good-performers. Millis and King (2001) and Dowhower (1987) showed in their studies that rereading improved the comprehension. In the present study, the scenario is somewhat dif-ferent than Millis and King (2001) and Dowhower (1987). In the present study, the students did not read the study material again. Instead, the students referred back to the previously seen content again during the time the slide was visible to them. Thus, the relation between rereading of the same content and the performance should be taken cautiously, clearly fur-ther experimentation is needed to reach a causal conclusion.
One interesting finding in the present study was the fact that the content coverage had fully mediated the relation between the performance and the learning motivation. Whereas, the AOI misses and AOI back-tracks had partial mediation effects. This could be interpreted in terms of the type of information we considered to compute the respect-ive variables. For example, the content coverage computation took into account both the screen space and the time information and AOI back-tracks (and misses) computation re-quired only the temporal information. However, in the context of the present study, we could not conclude the separation between spatial and temporal information and how it effected the relation between the gaze variables and performance and learning strategy.
In addition, we found that high-performers (those who scored high in the test) had more perceptual with-me-ness on the referred sites than the low-performers. This is in accordance with the literature, where Jermann and Nüssli (2012), showed that better per-forming pairs had more recurrent gaze patterns during the moments of deictic references. We also found that the students who scored better in the test, were following the teacher, both in deictic and discourse, in an efficient manner than those who did not score well in the test. These results were not surprising, but could be utilised to inform the students about their attention levels during MOOC lectures in an automatic and objective manner. The results also contribute towards our long-term goal of defining the student profiles based on their performance and motivation using the gaze data. The attention points can serve the purpose of a delayed feedback to the students based on their attention span.
Another interesting finding of our study is that the conceptual with-me-ness has more percentage mediation than the perceptual with-me-ness (39% for conceptual as compared to 33% for perceptual with-me-ness). This shows that eye-tracking can not only provide access to students’attention but also to the students’information process-ing mechanisms as well. Thus, students gaze is an important source of information that can be used to inform online learning.
Finally, from the prediction results, we were able to show that the heat-maps cannot be only used as a popular visualization tools, but also as a source of features to predict performance and other traits, such as motivation. The best prediction results for the performance was with a 5.04% normalized error. In terms of a quiz-based evaluation of learning, which in our case are 10 questions, this error translates to less than one ques-tion. For example, if a student answers 9 questions correctly, our method will predict the score within the range of [8.5–9.5]. Similarly, on the motivation scale, which is a 5-point Likert scale making it in the range of [0 -- 50], the error of 9.04% would translate to one incorrect prediction out of ten on the scale proposed by Biggs et al. (2001).
Additionally, in this contribution, the eye-tracking variables we defined had different pre-processing requirement. These variables also have capacities in terms of being used within an adaptive and time system. The computation of content coverage is real-time and requires no pre-processing of the data or the stimulus. The Scan-path vari-ables can also be computed in real-time and there is small amount of pre-processing required in term of defining the area of interest (AOI) to be able to compute them. The pre-processing for computing the perceptual with-me-ness could be automatized since there are computer-vision methods to detect pointing/other deictic gestures of the teacher. Once this detection is done, the real-time computation of Perceptual with-me-ness if fairly straightforward. Finally, the conceptual with-me-with-me-ness, requires a few manual interventions in transcribing the teachers’ dialogues and mapping them to the content. This acts as a hindrance in the real-time computation of the conceptual with-me-ness, and therefore, this is the only gaze-based measure used in this study that requires further work to be used as within a personalised adaptive gaze-based feedback system.
To gain further insight into the design of MOOC videos and the affordances of the respective systems, we need to consider eye-gaze measurements (or can call them gaze analytics) that we found to not only strongly associated with learning, but also mediate the influence of other variables (i.e., motivation). Discussing these features from a tech-nical standpoint can give rise to practical implications for the design of MOOC videos (e.g., designed in a way to draw students’ attention (Kizilcec et al., 2014) and the re-spective video-based learning systems (e.g., offer an indication of students’ attention based on the web-camera).
Abbreviations
MOOC:Massive open online course; AI: Artificial intelligence; CTML: Cognitive theory of multimedia learning; SPOC: Special purpose online courses; xMOOC: eXtended massive open online course; SPQ: Study process questionnaire; 4 V: Volume, variety, velocity, and veracity; AOI: Area of interest; FFD: First fixation duration; ET: Entry time; NumRV: Number of ReVisits; RV: ReVisits; Std. Dev. Or SD: Standard Deviation; VGG: Visual Geometry Group; LASSO: Least absolute shrinkage and selection operator; OLS: Ordinary least squares; RSS: Residual sum of squares; GAM: Generalised additive models; NRMSE: Normalised root mean squared error
Acknowledgements
This work is supported from the Norwegian Research Council under the projects FUTURE LEARNING (number: 255129/ H20) and Xdesign (290994/F20).
Authors’contributions
KS designed and conducted the study, analysed the data and drafted the manuscript. MG participated in the analysis of the data and framing of the contribution. PD participated in the conceptualisation and design of the study. The authors read and approved the final manuscript.
Funding
No funding was received for this study.
Availability of data and materials
As it is possible to identify participants from the data, ethical requirements do not permit us to share participant data from this study.
Competing interests
Participation was voluntarily, and all the data collected anonymously. Appropriate permissions and ethical approval for the participation requested and approved.
There is no potential conflict of interest in this study.
Author details 1
Department of Computer Science, Norwegian University of Science and Technology, Trondheim, Norway.
2Department of Computer Science, École Polytechnique Fédérale de Lausanne, Lausanne, Switzerland.
Received: 4 September 2019 Accepted: 3 April 2020
References
Alemdag, E., & Cagiltay, K. (2018). A systematic review of eye tracking research on multimedia learning.Computers in Education, 125, 413–428.
Ashraf, H., Sodergren, M. H., Merali, N., Mylonas, G., Singh, H., & Darzi, A. (2018). Eye-tracking technology in medical education: A systematic review.Medical Teacher, 40(1), 62–69.
Astin, A. W. (1971).Predicting academic performance in college: Selectivity data for 2300 American colleges.
Baron, R. M., & Kenny, D. A. (1986). The moderator–mediator variable distinction in social psychological research: Conceptual, strategic, and statistical considerations.Journal of Personality and Social Psychology, 51(6), 1173.
Biggs, J., Kember, D., & Leung, D. Y. (2001). The revised two-factor study process questionnaire: R-SPQ-2F.The British Journal of Educational Psychology, 71(1), 133–149.
Byrne, B., Freebody, P., & Gates, A. (1992). Longitudinal data on the relations of word-reading strategies to comprehension, reading time, and phonemic awareness.Reading Research Quarterly, 27, 141–151.
Cennamo, K. S., Savenye, W. C., & Smith, P. L. (1991). Mental effort and video-based learning: The relationship of preconceptions and the effects of interactive and covert practice.Educational Technology Research and Development, 39(1), 5–16.
Choi, H. J., & Johnson, S. D. (2005). The effect of context-based video instruction on learning and motivation in online courses.American Journal of Distance Education, 19(4), 215–227.
Dillenbourg, P., & Traum, D. (2006). Sharing solutions: Persistence and grounding in multimodal collaborative problem solving.The Journal of the Learning Sciences, 15(1), 121–151.
Dowhower, S. L. (1987). Effects of repeated Reading on second-grade transitional readers' fluency and comprehension.
Reading Research Quarterly, 22, 389–406.
Finn, J. D. (1989). Withdrawing from school.Review of Educational Research, 59(2), 117–142.
Giannakos, M. N. (2013). Exploring the video-based learning research: A review of the literature.British Journal of Educational Technology, 44(6), E191–E195.
Giannakos, M. N., Chorianopoulos, K., & Chrisochoides, N. (2015). Making sense of video analytics: Lessons learned from clickstream interactions, attitudes, and learning outcome in a video-assisted course.The International Review of Research in Open and Distance Learning, 16(1), 260–283.
Good, T. L., & Beckerman, T. M. (1978). Time on task: A naturalistic study in sixth-grade classrooms.The Elementary School Journal, 78(3), 193–201.
Grabe, M., & Latta, R. M. (1981). Cumulative achievement in a mastery instructional system: The impact of differences in resultant achievement motivation and persistence.American Educational Research Journal, 18(1), 7–13.
Hastie. (1993).In chambers and Hastie (1993) statistical models in S. Chapman and Hall. Hastie and Tibshirani. (1990).Generalized additive models. Chapman and Hall.
Jermann, P., & Nüssli, M. A. (2012). Effects of sharing text selections on gaze cross-recurrence and interaction quality in a pair programming task. InProceedings of the ACM 2012 conference on computer supported cooperative work(pp. 1125–1134). ACM.
Just, M. A., & Carpenter, P. A. (1980). A theory of reading: From eye fixations to comprehension.Psychological Review, 87(4), 329.
Kaplan, R. M. (1982). Nader's raid on the testing industry: Is it in the best interest of the consumer?The American Psychologist, 37(1), 15.
Kim, J., Nguyen, P. T., Weir, S., Guo, P. J., Miller, R. C., & Gajos, K. Z. (2014). Crowdsourcing step-by-step information extraction to enhance existing how-to videos. InProceedings of the SIGCHI conference on human factors in computing systems(pp. 4017–4026). ACM.
Kizilcec, R. F., Papadopoulos, K., & Sritanyaratana, L. (2014). Showing face in video instruction: Effects on information retention, visual attention, and affect. InProceedings of the SIGCHI conference on human factors in computing systems(pp. 2095-2102). ACM.
Liaw, A., & Wiener, M. (2002). Classification and regression by randomForest.R news, 2(3), 18–22.
Mayer, R. E., & Moreno, R. (2003). Nine ways to reduce cognitive load in multimedia learning.Educational Psychologist, 38(1), 43–52.
Millis, K. K., & King, A. (2001). Rereading strategically: The influences of comprehension ability and a prior reading on the memory for expository text.Reading Psychology, 22(1), 41–65.
Moreno-Marcos, P. M., Alario-Hoyos, C., Muñoz-Merino, P. J., & Kloos, C. D. (2018). Prediction in MOOCs: A review and future research directions.IEEE Transactions on Learning Technologies,12(3), 384-401.
Paivio, A. (2013).Imagery and verbal processes. Psychology Press.
Paris, S. G., & Jacobs, J. E. (1984). The benefits of informed instruction for children's reading awareness and comprehension skills. Child development, 2083–2093.
Pelánek, R. (2015). Metrics for evaluation of student models.Journal of Educational Data Mining, 7(2), 1–19.
Prieto, L. P., Sharma, K., Dillenbourg, P., & Jesús, M. (2016). Teaching analytics: Towards automatic extraction of orchestration graphs using wearable sensors. InProceedings of the sixth international conference on Learning Analytics & Knowledge(pp. 148–157). ACM.
Rasmussen, C. E. (2003). Gaussian processes in machine learning. InSummer School on machine learning(pp. 63–71). Berlin, Heidelberg: Springer.
Reinking, D. (1988). Computer-mediated text and comprehension differences: The role of Reading time, reader preference, and estimation of learning.Reading Research Quarterly, 23, 484–498.
Richardson, D. C., Dale, R., & Kirkham, N. Z. (2007). The art of conversation is coordination.Psychological Science, 18(5), 407– 413.
Scholkopf, B., & Smola, A. J. (2001).Learning with kernels: Support vector machines, regularization, optimization, and beyond. MIT press.
Schwartz, D. L., & Hartman, K. (2007). It is not television anymore: Designing digital video for learning and assessment.Video Research in the Learning Sciences edited by Ricki Goldman, Roy Pea, Brigid Barron, Sharon J. Derry, 335–348.
Seaton, D. T., Bergner, Y., Chuang, I., Mitros, P., & Pritchard, D. E. (2014).Who does what in a massive open online course?
Severin, W. (1967). Another look at cue summation.AV Communication Review, 15(3), 233–245.
Sharma, K., Caballero, D., Verma, H., Jermann, P., & Dillenbourg, P. (2015a).Looking AT versus looking THROUGH: A dual eye-tracking study in MOOC context. In the proc. of the Computer Supported Collaborative Learning 205 (pp. 260-267). International Society of the Learning Sciences, Inc.[ISLS].
Sharma, K., Caballero, D., Verma, H., Jermann, P., & Dillenbourg, P. (2015b). Shaping learners’attention in massive open online courses.Revue internationale des technologies en pédagogie universitaire/International Journal of Technologies in Higher Education, 12(1–2), 52–61.
Sharma, K., Jermann, P., & Dillenbourg, P. (2014).“With-me-ness”: A gaze-measure for students’attention in MOOCs. In
Proceedings of international conference of the learning sciences 2014(no. CONF (pp. 1017–1022). ISLS.
Simonyan, K., & Zisserman, A. (2014).Very deep convolutional networks for large-scale image recognitionarXiv preprint arXiv: 1409.1556.
Špakov, O., & Miniotas, D. (2007). Visualization of eye gaze data using heat maps.Elektronika ir elektrotechnika, 74, 55–58. Tibshirani, R. (1996). Regression shrinkage and selection via the lasso.Journal of the Royal Statistical Society: Series B:
Methodological, 58(1), 267–288.
Tobagi, F. A. (1995). Distance learning with digital video.IEEE Multimedia, 2(1), 90–93.
Volery, T., & Lord, D. (2000). Critical success factors in online education.International Journal of Educational Management, 14(5), 216–223.
Wiley, D. E. (1976). Another hour, another day: Quantity of schooling, a potent path for policy. InSchooling and achievement in American society(pp. 225–265).
Publisher’s Note