WATER SYSTEM BREAKDOWN TYPOLOGY AND REHABILITATION PATHWAYS IN SUB-SAHARAN AFRICA
Victoria Leigh Klug
A thesis submitted to the faculty at the University of North Carolina at Chapel Hill in partial fulfillment of the requirements for the degree of Master of Science in the Department of Environmental Sciences and Engineering in the Gillings School of Global Public Health.
Chapel Hill 2016
Approved by: Jamie Bartram
iii
ABSTRACT
Victoria Leigh Klug: Water system breakdown typology and rehabilitation pathways in sub-Saharan Africa
(Under the direction of Jamie Bartram)
One in three handpump water systems in sub-Saharan Africa are non-functional at any given time. To better understand common water system breakdowns, data from Liberia, Nigeria, Tanzania, and Uganda (each N>3600) were used to create a breakdown typology. This typology was used to examine how breakdown type varies by water system and management
ACKNOWLEDGEMENTS
I would like to extend my gratitude to my advisor, Jamie Bartram, as well as Peggy Bentley and Pete Kolsky, for serving on my committee and providing me with essential guidance and feedback. Students and employees of The Water Institute at UNC, especially Kate Shields, Ryan Cronk, and Vidya Venkataramanan, provided insight and support without which my work would not have been possible.
I am grateful to the entire Processes for Sustainability research team (Kate Shields, Ryan Cronk, Nikki Behnke, Emma Kelly, Kristen Lee, Leah Everist, and Julian Oliver) for their hard work that made the second chapter of this thesis possible and for their perspective and support that made my work enjoyable. Special thanks are also due to World Vision national and ADP office staff, post-construction support providers, government officials, community leaders, and water committee and community members in Kenya, Ghana, and Zambia for sharing their time and experiences with UNC researchers. The contribution of the interpreters and transcribers in all three study countries also made this work possible.
v
TABLE OF CONTENTS
LIST OF TABLES ... viii
LIST OF FIGURES ... xi
LIST OF ABBREVIATIONS ... xii
INTRODUCTION ... 1
CHAPTER I: BREAKDOWN TYPOLOGY ... 3
Methods ... 3
Results ... 6
Discussion ... 14
CHAPTER II: REHABILITATION PATHWAYS ... 19
Methods ... 19
Results ... 27
Discussion ... 38
BREAKDOWNS AND REHABILITATION ... 44
CONCLUSIONS ... 45
APPENDIX A: GRAND TOUR AND COMMUNITY MAPPING GUIDE ... 48
APPENDIX B: INTERVIEW GUIDE – WASH COMMITTEE MEMBER ... 54
APPENDIX C: INTERVIEW GUIDE – POST-CONSTRUCTION SUPPORT AND SYSTEMS MAINTENANCE ... 61
vii
APPENDIX F: INTERVIEW GUIDE – OTHER COMMUNITY LEADERS ... 80
APPENDIX G: FOCUS GROUP DISCUSSION GUIDE – WASH COMMITTEE ... 88
APPENDIX H: FOCUS GROUP DISCUSSION GUIDE – COMMUNITY MEMBERS ... 96
APPENDIX I: CHI-SQUARE TABLES ... 102
Dependent variable: Conceptual breakdown category ... 102
Dependent variable: Specific part ... 109
LIST OF TABLES
Table 1 Water system functionality status frequency and percent for
Liberia, Nigeria, Tanzania, and Uganda water system datasets. ... 6 Table 2 Water system and management characteristics for Liberia,
Nigeria, Tanzania, and Uganda water system datasets. ... 7 Table 3 Detailed breakdown category by country for Liberia, Tanzania,
and Uganda water system datasets. ... 10 Table 4 Part named as a reason for breakdown for Liberia, Tanzania,
and Uganda water system datasets. ... 11 Table 5 Given conceptual breakdown category for Nigerian water systems ... 12 Table 6 Chi-square test results of breakdown type and water system and management
characteristics for Liberia, Nigeria, Tanzania, and Uganda water system datasets ... 13 Table 7 Topic covered by activity in qualitative data collection on
community-managed water systems in Ghana, Kenya, and Zambia. ... 21 Table 8 Number of activities of each type conducted during qualitative
data collection on community-managed water systems in Ghana, Kenya, and Zambia. ... 22 Table 9 Pathway for water system rehabilitation. Table derived from
qualitative data on community-managed water systems in Ghana,
Kenya, and Zambia. ... 28 Table 10 Pathway for water system management rehabilitation. Table
derived from qualitative data on community-managed water systems
in Ghana, Kenya, and Zambia... 35 Table 11 Chi-square results for conceptual breakdown category by water
system type for Nigeria water system dataset. ... 102 Table 12 Chi-square results for conceptual breakdown category by water
system type for Tanzania water system dataset. ... 103 Table 13 Chi-square results for conceptual breakdown category by water
ix
Table 15 Chi-square results for conceptual breakdown category by water
system age for Uganda water system dataset. ... 104 Table 16 Chi-square results for conceptual breakdown category by water
system management for Liberia water system dataset. ... 105 Table 17 Chi-square results for conceptual breakdown category by water
system management for Tanzania water system dataset. ... 105 Table 18 Chi-square results for conceptual breakdown category by water
system management for Uganda water system dataset. ... 106 Table 19 Chi-square results for conceptual breakdown category by fee
collection for Liberia water system dataset. ... 106 Table 20 Chi-square results for conceptual breakdown category by fee
collection for Nigeria water system dataset. ... 107 Table 21 Chi-square results for conceptual breakdown category by fee
collection for Tanzania water system dataset. ... 107 Table 22 Chi-square results for conceptual breakdown category by fee
collection for Uganda water system dataset... 108 Table 23 Chi-square results for conceptual breakdown category by fee
collection details for Liberia water system dataset. ... 108 Table 24 Chi-square results for conceptual breakdown category by fee
collection details for Tanzania water system dataset. ... 109 Table 25 Chi-square results for part at fault by water system type for
Tanzania water system dataset. ... 109 Table 26 Chi-square results for part at fault by water system age for
Liberia water system dataset. ... 110 Table 27 Chi-square results for part at fault by water system age for
Tanzania water system dataset. ... 110 Table 28 Chi-square results for part at fault by water system age for
Uganda water system dataset. ... 111 Table 29 Chi-square results for part at fault by water system management
for Tanzania water system dataset. ... 112 Table 31 Chi-square results for part at fault by water system management
for Uganda water system dataset. ... 112 Table 32 Chi-square results for part at fault by fee collection for Liberia
water system dataset. ... 113 Table 33 Chi-square results for part at fault by fee collection for Tanzania
water system dataset. ... 113 Table 34 Chi-square results for part at fault by fee collection for Uganda
water system dataset. ... 114 Table 35 Chi-square results for part at fault by fee collection details for
Liberia water system dataset. ... 114 Table 36 Chi-square results for part at fault by fee collection details for
xi
LIST OF FIGURES
Figure 1 Conceptual breakdown category by country for Liberia, Tanzania,
LIST OF ABBREVIATIONS
ADP Area Development Program
CEA Community Engagement Approach FGD Focus Group Discussion
KSH Kenyan Shilling
MDG Millennium Development Goal NGO Non-governmental organization PCS Post-construction support SDG Sustainable Development Goal
UNC University of North Carolina at Chapel Hill WaSH Water, sanitation and hygiene
1
INTRODUCTION
Sufficient, safe, and continuously available drinking water is important for human health and development (Bain et al., 2014; Bartram & Cairncross, 2010). In rural sub-Saharan Africa nearly 60,000 handpumps and many other water systems are installed every year; however, one in three of these handpumps are non-functional at any given time (Rural Water Supply Network, 2009; Sansom & Koestler, 2009). Water system breakdowns force users to revert to raw water sources, and even a few days of consuming water from unimproved sources during a water system breakdown undermines the health benefits of an improved water source (Hunter, Zmirou-Navier, & Hartemann, 2009).
Evidence suggests a number of factors are associated with water system
While the model of community management with spare parts and external technical expertise access has been championed, there is a limited understanding of the types of water system breakdowns that commonly occur and the ways that this management paradigm can address common breakdowns of water supplies in sub-Saharan Africa. To address these gaps in knowledge, I aimed to:
1. Create a typology of common water system breakdowns and examine how breakdown type varies by water system type, water system age, existence of a water committee, and fee collection details using data from Liberia, Nigeria, Tanzania, and Uganda.
2. Identify rehabilitation pathways for broken water systems and note actors involved in and barriers to completing specific rehabilitation steps using qualitative data from Ghana, Kenya, and Zambia.
3
CHAPTER I: BREAKDOWN TYPOLOGY
Methods
Data on water system breakdowns from Liberia, Nigeria, Tanzania, and Uganda were used to create a typology of water system breakdowns. This breakdown typology was then used to analyze differences in breakdown type based on characteristics such as system type, age, management type, and fee collection. Analysis focused only on non-functional water systems.
Data sources
Liberia. Data for Liberia were obtained from the Liberia Ministry of Public Works
Liberian Waterpoint Atlas (Liberia Ministry of Public Works, 2011). These data were a census of 10,000 waterpoints, or all improved waterpoints in Liberia. Data for the Liberian Waterpoint Atlas were collected in the first half of 2011.
Nigeria. Data for Nigeria were obtained from the Nigeria MDG Information System (NMIS) (Office of the Senior Special Assistant to the President on MDGs, 2015). These data were a census of 115,505 water systems in 661 of 774 local government areas (LGAs) in Nigeria and were collected from October 2011 to November 2012.
Uganda. Data for Uganda were obtained from the Uganda Water Supply Atlas (Uganda Ministry of Water and Environment, 2011). Data for the Atlas was collected in 2010, and the purpose of the Atlas is to inform the national planning and budgetary process for the government of Uganda. The data were a census of all water points in the country and include 111,665 water system observations.
Analysis
Stata (StataCorp, 2015) was used for statistical analysis. Analysis was focused on categorizing the major types of breakdowns of water systems and understanding the association between breakdown type and water system and management characteristics.
The Liberia, Tanzania, and Uganda datasets had qualitative free response options for the reason the water system was non-functional, and the Nigeria dataset had several true-false options for specific breakdown types. The qualitative breakdown reasons were coded into conceptual breakdown categories and breakdown categories focused on the specific part of the water system identified as a reason for breakdown. Breakdown types included in the survey of Nigerian water systems were used as guidance in the creation of the conceptual breakdown categories for the typology developed.
5
Only non-functional systems were included in analysis, as systems that were functional at the time of data collection were not experiencing a breakdown. In datasets in which there was a distinction between complete functionality and partial functionality (e.g. water system status variable included values of “Working but with problems”), partially functional systems were grouped with non-functional systems. All observations that were functional or did not have a value for water system status were removed from the dataset before proceeding with analysis; the sample size for each country dataset is effectively the number of non-functional systems.
Univariate analysis between specific breakdown type and the following factors were explored:
1. Type of water system (e.g. mechanized, handpump, gravity) 2. Age of system
3. Water system management type (community/committee vs. other forms of management) 4. Fee collection
a. Fees collected vs. fees not collected b. Proactive vs. reactive fee collection
Results
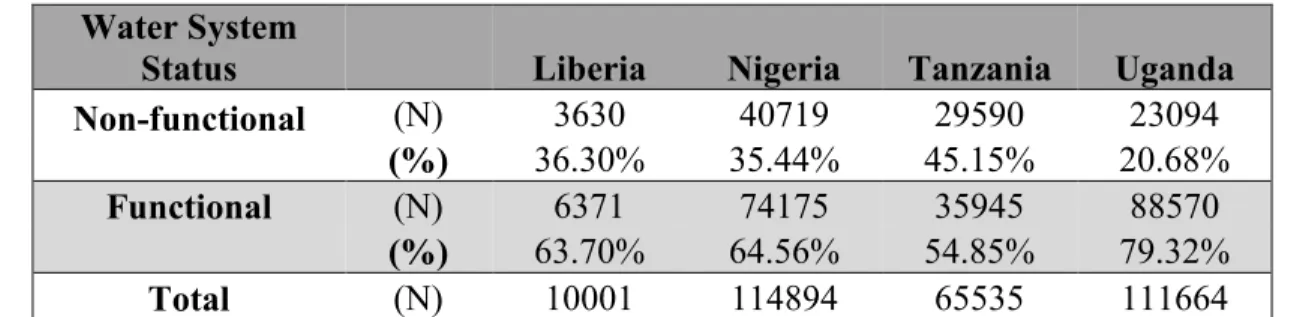
Only non-functional systems were included in the breakdown typology analysis, and the count and percent of non-functional and functional systems for each country dataset are shown in Table 1.
Water System
Status Liberia Nigeria Tanzania Uganda
Non-functional (N) 3630 40719 29590 23094
(%) 36.30% 35.44% 45.15% 20.68%
Functional (N) 6371 74175 35945 88570
(%) 63.70% 64.56% 54.85% 79.32%
Total (N) 10001 114894 65535 111664
Table 1 Water system functionality status frequency and percent for Liberia, Nigeria, Tanzania, and Uganda water system datasets.
Relevant descriptive statistics for non-functional water systems were calculated for each country dataset and are shown in Table 2. Where data were not included in the dataset at all or at the level of detail necessary to conform to the categories used for water system type, age,
7
Liberia Nigeria Tanzania Uganda
Water system type
Mechanized (N) 3007 4589
(%) 7.38% 15.51%
Handpump (N) 11286 6639
(%) 27.72% 22.44%
Gravity (N) -- 12775
(%) -- 43.17%
Other (N) 26426 5587
(%) 64.90% 18.88%
Total (N) 40719 29590
Water system age
0-2 years (N) 691 1158 388
(%) 21.75% 4.11% 1.82%
3-5 years (N) 1356 3621 2729
(%) 42.68% 12.85% 12.77%
6-8 years (N) 645 2605 4179
(%) 20.30% 9.24% 19.56%
9-11 years (N) 198 2233 5416
(%) 6.23% 7.92% 25.35%
12+ years (N) 287 18569 8656
(%) 9.03% 65.88% 40.51%
Total (N) 3177 28186 21368
Water system management
Community/committee (N) 1800 23171 18373
(%) 49.59% 85.56% 79.56%
Other (N) 1830 3909 4721
(%) 50.41% 14.44% 20.44%
Total (N) 3630 27080 23094
Water system fee collection
Yes (N) 1298 1162 9290 4029
(%) 35.97% 3.05% 38.40% 17.45%
No (N) 2311 36987 14900 19065
(%) 64.03% 96.95% 61.60% 82.55%
Total (N) 3609 38149 24190 23094
Water system fee collection, detailed
Yes, proactively (N) 460 7531
(%) 35.44% 81.07%
Yes, reactively (N) 838 1759
(%) 64.56% 18.93%
Total (N) 1298 9290
Conceptual categories of water system breakdowns were created for data from Liberia, Tanzania, and Uganda and can be seen in Figure 1. In the reasons for breakdown, hardware problems were mentioned more often than any cause of breakdown, making up more than 60% of the breakdown reasons in each dataset. Environmental problems, including water quality problems, drought or otherwise insufficient water, floods, and seasonality, are the second most frequently cited category. Intentional harm (i.e. theft or vandalism) was also frequently cited as a reason for breakdown.
Figure 1 Conceptual breakdown category by country for Liberia, Tanzania, and Uganda water system datasets.
The conceptual breakdown categories shown in Figure 1 summarize more detailed conceptual breakdown categories shown in Table 3; that is, each conceptual breakdown category is composed of one or several detailed breakdown categories. Damaged parts are the most common detailed conceptual category for all three countries. The total number included for each country is less than the number of non-functional systems because it excludes systems that 1) were under construction at the time of data collection, 2) had no breakdown reason given, or 3)
0% 20% 40% 60% 80% 100%
Leak or blockage Poor construction or location Abandoned, management, or financial
problem
Intentional harm Environmental problem Hardware problem
9
Detailed Breakdown
Category Liberia Tanzania Uganda Average
Damaged parts 78.78% 59.02% 38.66% 58.82%
Intentional harm 7.82% 11.33% 4.02% 7.72%
Water quality problem 7.62% 0.75% 2.34% 3.57%
Not enough water 3.45% 15.46% 8.43% 9.11%
Old or worn parts 1.31% 0.99% 10.23% 4.18%
Missing parts 0.36% 1.60% 13.74% 5.24%
Seasonal 0.33% 0.45% 0.16% 0.31%
Other environmental
problem 0.10% 0.29% 2.30% 0.90%
Abandoned 0.07% 3.44% 0.82% 1.44%
Parts fell into
borehole/well 0.07% 0.02% 2.38% 0.82%
Flood or overflow 0.03% 0.20% 0.62% 0.29%
Leakage 0.03% 0.78% 8.36% 3.06%
Poor construction 0.03% 0.14% 2.03% 0.73%
Blockage 0.00% 2.22% 1.48% 1.24%
Defective parts 0.00% 0.00% 2.85% 0.95%
Financial problem 0.00% 1.49% 0.16% 0.55%
Management problem 0.00% 0.44% 0.16% 0.20%
Poor siting 0.00% 1.38% 1.25% 0.88%
Total (N) 3044 17137 2561 100%
Table 3 Detailed breakdown category by country for Liberia, Tanzania, and Uganda water system datasets.
11
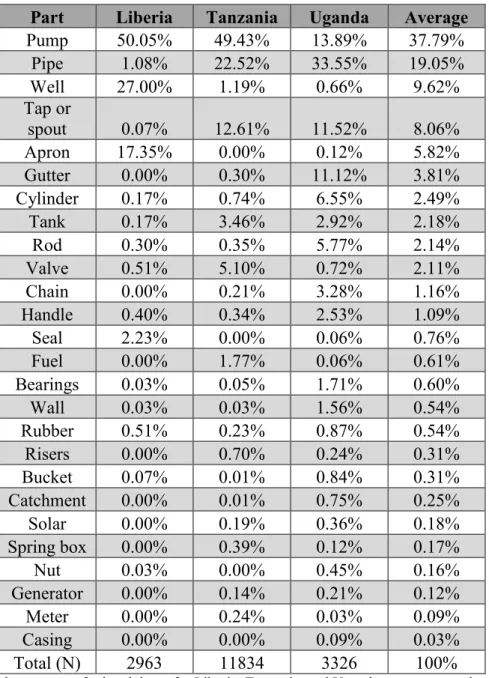
that reference a part in Tanzania and Uganda. The final column shows the non-weighted average of the percentages from each country.
Part Liberia Tanzania Uganda Average
Pump 50.05% 49.43% 13.89% 37.79%
Pipe 1.08% 22.52% 33.55% 19.05%
Well 27.00% 1.19% 0.66% 9.62%
Tap or
spout 0.07% 12.61% 11.52% 8.06%
Apron 17.35% 0.00% 0.12% 5.82%
Gutter 0.00% 0.30% 11.12% 3.81%
Cylinder 0.17% 0.74% 6.55% 2.49%
Tank 0.17% 3.46% 2.92% 2.18%
Rod 0.30% 0.35% 5.77% 2.14%
Valve 0.51% 5.10% 0.72% 2.11%
Chain 0.00% 0.21% 3.28% 1.16%
Handle 0.40% 0.34% 2.53% 1.09%
Seal 2.23% 0.00% 0.06% 0.76%
Fuel 0.00% 1.77% 0.06% 0.61%
Bearings 0.03% 0.05% 1.71% 0.60%
Wall 0.03% 0.03% 1.56% 0.54%
Rubber 0.51% 0.23% 0.87% 0.54%
Risers 0.00% 0.70% 0.24% 0.31%
Bucket 0.07% 0.01% 0.84% 0.31%
Catchment 0.00% 0.01% 0.75% 0.25%
Solar 0.00% 0.19% 0.36% 0.18%
Spring box 0.00% 0.39% 0.12% 0.17%
Nut 0.03% 0.00% 0.45% 0.16%
Generator 0.00% 0.14% 0.21% 0.12%
Meter 0.00% 0.24% 0.03% 0.09%
Casing 0.00% 0.00% 0.09% 0.03%
Total (N) 2963 11834 3326 100%
Table 4 Part named as a reason for breakdown for Liberia, Tanzania, and Uganda water system datasets.
*Part mentioned in at least 3% of the reasons for breakdowns that include a part name for each country and included in chi-square tests.
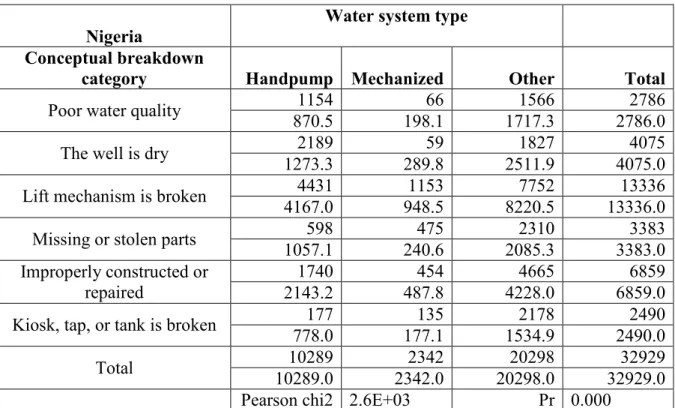
lift mechanism, which includes fuel-powered pumps, handpumps, and animal-powered lifts, is at fault for the breakdown most frequently; poor construction or repair is cited second most
frequently.
Nigeria
Given conceptual category Frequency Percent
Lift mechanism is broken 13336 32.75% Improperly constructed or
repaired 6859 16.84%
The well is dry 4075 10.01%
Missing or stolen parts 3383 8.31%
Poor water quality 2786 6.84%
Kiosk, tap, or tank is broken 2490 6.12% Still under construction or
construction never completed 3750 9.21% Information not
available/Don't know 4040 9.92%
Total 40719 100%
Table 5 Given conceptual breakdown category for Nigerian water systems
13
Dependent
Variable Independent Variable Liberia Nigeria Tanzania Uganda
Conceptual breakdown category
Water system type NA p<0.001 p<0.001 NA Age p<0.001 NA p<0.001 p=0.007** Management structure p<0.001 NA p<0.001 p<0.001
Fee collection p<0.001 p<0.001 p<0.001 p=0.010 Fee collection
(separation by reactive
and proactive) p=0.211 NA p<0.001 NA
Specific part*
Water system type NA NA p<0.001 NA
Age p<0.001 NA p<0.001 p<0.001** Management structure p=0.310 NA p<0.001 p<0.001
Fee collection p=0.764 NA p<0.001 p<0.001 Fee collection
(separation by reactive
and proactive) p=0.014 NA p<0.001 NA Table 6 Chi-square test results of breakdown type and water system and management characteristics for Liberia, Nigeria, Tanzania, and Uganda water system datasets
*Only the most commonly cited parts (>3% of total breakdown reasons with parts attributed) included for each country dataset as indicated in Table 4
**Expected values of <5 for several cells but >80% of cells had expected values of >=5, a requirement for chi-square testing
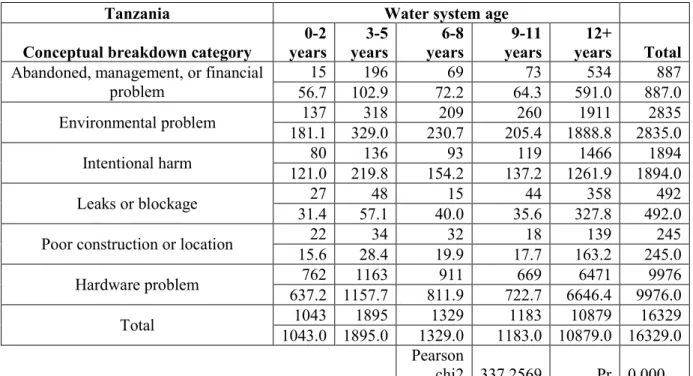
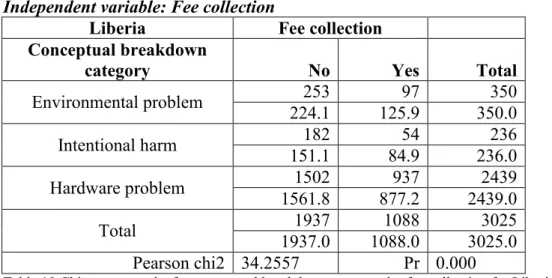
Differences in conceptual breakdown category and specific part at fault for breakdown based on independent variable allow for insight into which breakdowns are most commonly associated with different water system and management characteristics.
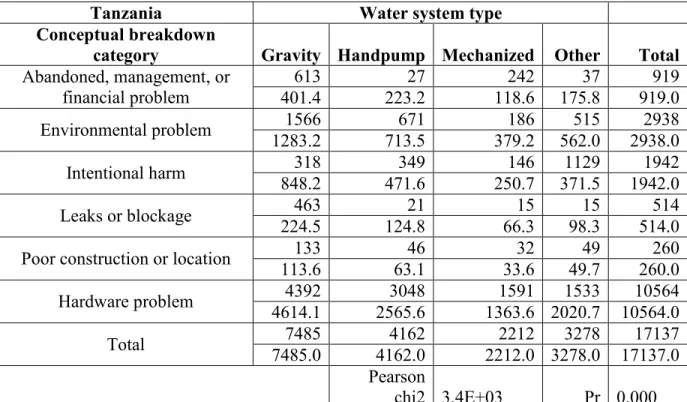
The chi-square test for conceptual breakdown category by fee collection in Tanzania, Liberia, and Uganda shows that the expected value for intentional harm is lower than the
observed value when fees not collected and that expected value higher than observed value when fees collected. This indicates that intentional harm is less likely to be a cause of breakdown when fees are collected. A similar relationship is present in the chi-square test results for conceptual breakdown category when the independent variable is proactive vs. reactive fee collection in Tanzania; the expected value for intentional harm is lower than the observed value when fees are collected reactively and that expected value higher than observed value when fees are collected proactively. This indicates that intentional harm is less likely to be a cause of breakdown when fees are collected proactively.
Appendix I contains the cross-tabulated tables for all chi-square tests, which can be examined further to explore associations such as those discussed above.
Discussion
The breakdown typology created based on the four country datasets identifies key conceptual breakdown types as well as specific parts at fault for water system breakdown. Frequent conceptual breakdown categories are hardware problems, environmental problems, and intentional harm to the system. Conceptual breakdown categories were created based on
breakdown reasons in the data and based on connections to underlying conditions of failure as described by Bonsor et al. (Bonsor et al., 2015). Poor construction or location of water systems is tied to poor decision-making during implementation and could be addressed with better
15
governments are at fault for breakdowns whose cause is attributed to poor construction or location, water system management should be able to address environmental problems that arise after implementation.
Differences in conceptual breakdown category by age, management, and fee collection were seen to be statistically significant (p<0.001) for Liberian water systems; by water system type and fee collection for Nigerian water systems; by water system type, age, management structure, fee collection, and proactive vs. reactive fee collection for Tanzanian water systems; and management structure for Ugandan water systems. Differences in conceptual breakdown category by age and fee collection were seen to be statistically significant (p<=0.01) for Ugandan water systems. These chi-square test results suggest that there are differences in the types of breakdowns that can be expected of water systems based on water system type, age,
management, and fee collection in some settings. These results build upon previous
understanding of factors that are associated with water system non-functionality (Bonsor et al., 2015; Fisher et al., 2015; Foster, 2013) by identifying differences in the conceptual type and part at fault for non-functional water systems.
Intentional harm was the third most common conceptual breakdown type in Tanzania and Liberia and the fourth most common in Uganda. This suggests that more could be done to
prevent vandalism and theft, which is often cited as a concern but not closely studied (Hoko & Hertle, 2006; Nekesa & Kulanyi, 2012).
Analysis of the water system hardware identified as a reason for breakdown showed that pumps are commonly cited in Liberia, Tanzania, and Uganda. Vague responses like “pump damaged” are not helpful for indicating specific parts that commonly require repair or
problem cannot be easily identified are often not rehabilitated. Problems with pipes and taps/spouts are common in Tanzania and Uganda, indicating that these parts should be more accessible for repair or replacement.
Some reasons for hardware breakdown indicate management failures; abandonment and management or financial problems are cited as a reason for breakdown in 5% of Tanzanian water systems captured in the breakdown typology. Viewing management failures as barriers to
rehabilitation (or reasons for continued non-functionality) and distinct from reasons for initial hardware breakdowns could help focus programming improvements on both decreasing breakdowns and increasing rehabilitation of broken water systems. Additionally, some reasons for breakdown given are directly tied to management failures. For example, responses of “no fuel” were classified as financial problems because lack of funds are likely what prevented fuel from being acquired.
The breakdown typology used for analysis of the Liberia, Tanzania, and Uganda datasets was created with the goal of avoiding ambiguous breakdown categories that provide confusing or misleading suggestions for improved support of water systems. The given conceptual categories from the Nigerian dataset have several such ambiguities. The category “missing or stolen parts” is not specific enough to guide informed improvements – it is unclear whether it is more
important to stock spare parts or to protect against theft by hiring security guards or constructing fences. “Kiosk, tap, or tank is broken” does not help to indicate the specific type of hardware that needs repair or replacement. The breakdown typology used for the other three dataset was
17 Limitations and generalizability
The reason for breakdown in several of the datasets (Liberia, Tanzania, and Uganda) is not separated by the specific part that broke and the reason why it broke; instead, the reasons for breakdown given either happen to include both categories or included only one of these
categories. Had these two categories been separated, analysis could have more effectively led to an understanding of what parts need to be focused on (in terms of spare parts availability and what parts local technicians and mechanics should be comfortable working with) and what breakdown causes should be safeguarded against (e.g. hiring a security guard to prevent theft or preventing children from playing with pumps). Different combinations of the two categories (e.g. regular wear-and-tear causing the gradual destruction of a particular part of the system, hiring a security guard to prevent theft of a specific part of the system) could have also been analyzed had the categories been separated.
Some reasons for breakdown given in the datasets were ambiguous and it is possible that they could fit into different categories than those into which they were placed. Responses such as “not enough water” could indicate that the water system was initially poorly sited, that the source aquifer was drawn down over time, or that recharge is not fast enough to allow for a groundwater system to serve all intended users. Responses indicating insufficient amounts of water were grouped as environmental problems; with more information given on the breakdown reason, these could also potentially be grouped with breakdowns due to poor siting.
19
CHAPTER II: REHABILITATION PATHWAYS
Methods
Study setting
Data were collected in eighteen study communities – six each in the three study countries: Ghana, Kenya, and Zambia. Study countries were selected by the research sponsor (World Vision) to include one country in western Africa, one in eastern Africa, and one in southern Africa. The researchers selected study communities using data from a representative survey of World Vision (WV) communities in 10 countries. Communities were eligible if they had a water system that was:
1. Implemented by WV
2. Observed to be functional at the time of the survey
3. Reported to be managed by a water committee at the time of the survey
Data collection
Study tools
Between February and April 2015, researchers created semi-structured interview guides and focus group discussion (FGD) guides for data collection. Guides were prepared for
2
1
Topics covered during activities
Water Committee
Community
Member PCS
Provider Interview Other Local Leader Interview WV Staff Interview Community Mapping and Grand Tour
Interview FGD Interview FGD
Structure and responsibilities of the
water committee X X
Individual water committee members' contribution to water system
sustainability
X
Interactions between:
Water committee
members X X
Water committee members and the community
X X X X X
Water committee members and external support actors
X X X X
Water committee members and internal support actors
X X X
Community members' household water
access and use X X X
Hardware rehabilitation processes X X X X X X
Management rehabilitation processes X X X X X X
Water system characteristics X X X X X
Study tool review
Study tools were reviewed and tested by researchers at the University of North Carolina at Chapel Hill (UNC) to ensure that tools focused on the study’s research questions, included open-ended questions, and did not include leading questions. Translators that worked with the researchers during data collection helped to ensure that questions were asked in a relevant, understandable, and respectful manner in the languages spoken in each study community.
Field implementation
Data were collected between June and August 2015 in selected study communities and consisted of semi-structured qualitative interviews and FGDs. Researchers spent approximately one week in each study community in which they conducted interviews and FGDs with water committee members, water system beneficiaries, and local leaders. Each community visit began with a tour and community mapping activities to enable the researchers to become familiar with the community, establish rapport, and begin data collection. Table 8 shows the number of activities of each type conducted.
Type of Activity Number of Recordings
Individual Interviews
Water Committee Member 92
World Vision Staff 34
Community Member 69
Other Local Leader 49
Post-Construction Support Provider 23
Focus Group Discussions
Water Committee Members 19
Community Members 20
Grand Tour and Community Mapping 18
Total Number of Recordings 324
23
Researchers wrote field notes at the end of each data collection day. These field notes were shared with members of the research team based at UNC during data collection, who were responsible for providing feedback and guidance to researchers in each study country.
Researchers based at UNC also had weekly calls with researchers in each study country to provide more extensive feedback and guidance and to share insight between study countries.
Participant selection and informed consent
All or nearly all water committee members in each community who were present at the time of the researchers’ visit and consented to participation were interviewed in order to triangulate responses between participants and to capture the variety of experiences and
perspectives of the members of each water committee. Water system beneficiaries were selected to include diverse experiences with the water system, such as distance between their home and the water system and use of alternative water sources. Community members were mobilized for FGDs through the water committee or other local leaders.
Researchers interviewed WV staff at both the national and ADP level if they focused on implementing or supporting water systems or WaSH programming. Snowball sampling, a sampling technique in which participants refer researchers to other relevant participants, was used to identify relevant government officials and other providers of PCS for community-managed water systems.
Translation
Most interviews and FGDs were carried out using translators to communicate between English and local languages spoken in each study community, with the exception of interviews and FGDs with participants that were fluent and comfortable speaking in English.
Researchers selected translators with support from WV using the following eligibility criteria: 1. Fluency in the language(s) spoken in each study community and English
2. Willingness to be trained by researchers before engaging in data collection 3. Ability to translate live interviews and FGDs
4. Willingness to sign a non-disclosure agreement
From those that fulfilled all eligibility criteria, translators were chosen based on their previous experience translating for data collection, assessment of their live translation abilities, and their ability to also transcribe recordings.
Data analysis
Transcription
All English audio recordings was transcribed directly and languages of the study communities was translated and transcribed into English by transcribers fluent in both the language(s) spoken in each study community and English. Some transcribers had previously served as field translators and others were identified after data collection was complete. All transcribers were required to transcribe a portion of an audio recording for the researchers to assess their abilities before they were hired to transcribe a set of recordings.
25
and FGDs to be included in the transcriptions. Additionally, translating and transcribing both the language(s) of the study communities and the English live field translation allowed for correction of any live translation errors. For two local languages, the researchers could not find qualified transcribers and thus transcription was only completed for the live translated English.
Coding
Researchers used Dedoose (“Dedoose,” 2015) to code the data. Since the analysis process was inductive, coding and data analysis was structured to allow themes to emerge from the data. A two-stage coding process was adopted to allow for thorough inductive coding and to ensure reliability within the coding group.
The first stage of coding began with codes identified from field notes and brief review of transcripts. One or two coders were assigned to a set of actors (e.g. WV staff, water committee members, PCS providers) and applied codes to all transcripts from interviews and focus group discussions with those actors from all three study countries. As they coded transcripts, all coders identified additional codes that emerged from the transcripts. The coding team had weekly meetings to discuss, edit, and approve potential new codes. The codebook was kept consistent following the completion of the first stage of coding. Approximately two-thirds of the total transcripts were included in both the first and second stage of coding, allowing for the codebook to be created based on a majority of the transcripts. Some transcripts were not included in the first stage of coding because transcription was not yet complete.
Thematic analysis
Researchers examined excerpts within groups of codes to analyze themes present in the data. Each researcher focused on a different thematic category and explored excerpts with relevant codes applied. Analysis led to the creation of rehabilitation pathways based on the type of support required to return the water system to functionality. Analysis also yielded
rehabilitation pathways to rehabilitate management failures.
All of the water systems of focus in the study communities experienced a hardware breakdown or management failure since implementation. In order to increase the functionality of community-managed water systems, it is important to understand how non-functional water systems are repaired and how management breakdowns can be addressed. Hardware and management rehabilitation pathways and were identified based on the type of support required. For this analysis, a broad definition of hardware breakdown that includes anything but complete functionality is used. This includes systems that are not functional or at reduced functionality (e.g. functional but turbid water or functional but hard to pump) as defined by Leclert’s
classification of operational status of a borehole (Leclert, 2012). As there are occasions when a water committee is mostly serving its purpose but could be improved, a similar approach is taken for management rehabilitation: anything less than complete functionality is considered applicable for rehabilitation.
Ethics statement
27
(physical permits, NACOSTI/P/15/8498/6556 and NACOSTI/P/15/8024/6557) and Zambian Ministry of Housing and Local Government (physical approval letter, reference number MLGH/101/18/22) were received.
Results
Hardware rehabilitation
For hardware breakdowns, four pathways were identified between the recognition of a breakdown and the return of a water system to functional based on the types of support actions involved in rehabilitation. The hardware rehabilitation pathways comprise:
1. Community-level support actions
2. Community-level support with external financial support actions 3. Community-level support with external technical support actions
4. Community-level support with external technical and financial support actions
Before support actions for rehabilitation can be undertaken, a community must recognize that a breakdown has occurred. Community-level support actions are involved in all successful
rehabilitation pathways; in no case in the data did an external actor rehabilitate the water system without involvement of the water committee or other community leaders in the study
communities.
Step Diagnose problem Contact technical support Acquire financial resources Acquire
materials Repair hardware
Actors involved Community members Mechanics Water committee members Local leaders (Government employees) (NGO employees) Water committee members Local leaders Government employees NGO employees Private sector technicians Water committee members Local leaders Government employees NGO employees Water committee associations Mechanics Water committee members Government employees NGO employees Mechanics Water committee members Community members Government employees NGO employees Constraints that slow rehabilitation Little knowledge of how water system should
operate
Confusion about which technical support actor should be contacted
Relevant technical support actors are located far from the
community More professional technical support is
expensive Mechanic has other job, lives in another
community or serves multiple communities Communication challenging Committee doesn’t have savings for parts
or tools immediately available Poor proposal writing abilities Confusion about which external support actor should be contacted Slow response from external support providers
Spare parts or tools only
available outside of community Far distance to hardware store Poor transportation options Unforeseen technical challenges Constraints that halt rehabilitation
Lack of use of system/interest in
rehabilitating system
Mechanic moved away or impossible
to reach
No knowledge of external support providers Unresponsive external support No money available for parts or tools
Lack of knowledge of system leads to worse
breakdown
29
For all pathways, specific rehabilitation steps are shown with the actors commonly involved in each step and the constraints that slow or halt rehabilitation at each step. Actors that rarely participate in a certain step are noted in parentheses. Constraints have been separated into two categories: those that slow the rehabilitation, resulting in a longer breakdown period, and those that halt rehabilitation, resulting in a terminal failure of the water system. These pathways are derived from our data; other pathways may exist outside of the study communities, and the details of the pathways might vary in other contexts.
Hardware rehabilitation pathway 1: Community-level support actions
Hardware rehabilitation requiring only community-level support is applicable for less complex repairs that require funds that water committees have either saved from regular resource mobilization or can raise in reaction to a breakdown. In the case that a mechanic or water
committee member with technical knowledge diagnoses the problem, the second step of contacting technical support is sometimes combined with the first. Technical support for this pathway is a mechanic within the community or a neighboring community, or a member of the water committee who has been trained or has the skills to repair a system.
Problem diagnosis prompts the rest of the rehabilitation process. One water system caretaker in Zambia stated that he learned from a training with WV that, “they have to take a 10 liter container and start pumping. They were taught that if you pump 14 times then the container is filled up – meaning the borehole is ok – but if you pump 14, the container is not filled –
The constraints that slow rehabilitation at each step mostly involve poor communication with technical support or limited transportation to acquire tools and spare parts. One of the most common reasons for slow rehabilitation was the lack of available funds to immediately purchase materials or pay for technical support. When one community member in Ghana was asked what caused up to month-long delays in repairs, they responded, “It is always about the money. We have to contribute and go and buy the spare parts but they are also expensive.”
The constraints that halt rehabilitation include complete lack of knowledge of or ability to acquire technical support and materials needed for rehabilitation.
While the specific actors involved in each step vary between water systems and between specific breakdowns, water committee members are involved in every step of rehabilitation for this pathway. The one exception in our data was a community whose water committee had been dissolved by a local leader. In this community, former water committee members and local leaders took action to rehabilitate hardware breakdowns.
Hardware rehabilitation pathway 2: Community-level support with external financial support
actions
Hardware rehabilitation carried out with community-level support with external financial support is applicable for repairs of relatively low complexity for which the water committee is unable or unwilling to raise funds within the community. Generally, water committee members submit proposals to or directly contact government or NGO offices for external financial support. Regional water committee associations are sometimes formed for the purpose of addressing challenges and supporting the management activities of member committees. Member
31
water system components such as pipes, pump handles, or fittings and, for mechanized systems, pumps or solar panels; in this case, acquiring financial resources and materials happens at the same time.
One water committee member in Kenya described a scenario in which external financial support supported rehabilitation, “When the motor broke down, we wrote an application to the CDF [Constituency Development Fund] and they responded positively and allocated Ksh 300,000 for repair of the motor. We could not afford Ksh 300,000.” In this case, community-level actors were aware of relevant financial support options.
One constraint for the additional step in this pathway is poor communication, either in terms of community-level actors not knowing which support actor to contact or not being able to write an effective proposal for support.
Hardware rehabilitation pathway 3: Community-level support with external technical support
actions
Hardware rehabilitation using community-level support with external technical support actions is applicable for repairs of higher complexity requiring funds that water committees have already saved from regular resource mobilization or can raise quickly in reaction to a breakdown. The steps for this pathway are the same as that of the rehabilitation pathway requiring only community-level support; however, contacting technical support involves different actors and constraints.
water affairs to go and work on the borehole.” This is one of many possible methods for engaging technical support.
One WV employee who helped to create the WV Community Engagement Approach (CEA) described differences between hardware breakdowns that require only community-level support and those that require external technical support:
“I think the help of some aspects of it are very simple to repairs so the community members having the ability to remove some of the parts and be able to fix the pump or even just routine maintenance of it – looking at the chain. There has to be that awareness within the communities but I think it is also too much for a community if there is
something very technical that they’re expected to repair. In those instances they should also know where the help is so that they can contact. Either is it district assembly or an entrepreneur.”
He specifically indicates that government and private sector actors are two sources of support for “very technical” repairs that prompt use of this rehabilitation pathway.
In Kenya, a company that supplies and installs pumps and solar panels for the water systems in study communities also played a role in providing technical support. The company has warranties on its products. Their NGO coordinator stated that their technicians visit broken water systems at no cost during the warranty period and charge a water committee after the warranty has expired. Some committee members were aware of this support, while others only stated that they would contact WV if there were a problem with the pumps or solar panels. WV would sometimes in turn contact the company.
In rare cases, community-level actors do not diagnose the problem themselves; instead, government or NGO employees visiting for monitoring trips or to work on other development projects diagnose the problem. This occurs when the system was operating at reduced
33
Additional constraints for this pathway are related to contacting external support and paying for their services. This is especially limiting for complex mechanized water systems (such as those including solar panels) that require high levels of expertise, often in the form of private sector technicians who are located far from rural communities.
Hardware rehabilitation pathway 4: Community-level support with external technical and
financial support actions
Hardware rehabilitation requiring community-level support with both external technical and financial support actions is applicable for repairs of higher complexity for which the water committee is unable or unwilling to raise funds within the community. The steps for this pathway are the same as that of the rehabilitation pathway requiring community-level support and
external financial support; however, contacting technical support involves different actors and limitations.
A water committee secretary in Kenya illustrated a scenario that follows this pathway, saying:
“We wrote another proposal, and before we wrote a proposal, we enquired skills from water officer to come and see what the problem was. Then he came he advised us. He told us we can buy it from Nairobi but by there we had no money. So we had to write another proposal to the World Vision, then World Vision replaced it.”
In this case, the government water officer acts as the technical support, and WV acts as financial support.
Management rehabilitation
The hardware rehabilitation pathways outlined earlier present the steps necessary to return a broken water system to functional. Water committee members are commonly involved in each step of hardware rehabilitation pathways. In order for a water committee to take action to address hardware breakdowns, the committee itself has to be operating effectively. Since several study communities had gone through periods when the water committee was not operating effectively, rehabilitation pathways to address management failures were also identified. Management failures include several scenarios that occurred in study communities, including committees dissolving and community members demanding change in leadership because of perceived mismanagement of funds.
Management rehabilitation pathways are sorted based on type of support actions necessary. The three management rehabilitation pathways identified comprise:
1. Community-level support actions
2. Community-level actors prompting external support actions 3. External actors prompting community-level actions
35 Step Diagnose problem
Contact local leaders or external
support
Meet with relevant actors Rehabilitate management Actors involved Government employees NGO employees Water committee associations Community members Local leaders Community members Water committee members Local leaders Water committee associations Government employees NGO employees Local leaders Water committee members Community members Water committee associations Government employees NGO employees Local leaders Water committee members Community members Constraints that slow rehabilitation Community members and leaders’ lack of awareness of water
committee responsibilities and
actions Infrequent monitoring/auditing
Confusion or lack of knowledge of relevant support actors Communication challenging No well-known oversight processes in
community
Constraints that halt rehabilitation
Lack of use of system/interest in having an effective
water committee (especially in rainy
season)
External support unresponsive Individuals that identify problem fear
pointing it out
External support actors not seen as agents of
change
New committee members not trained or prepared for their
role
Table 10 Pathway for water system management rehabilitation. Table derived from qualitative data on community-managed water systems in Ghana, Kenya, and Zambia.
Management rehabilitation pathway 1: Community-level support actions
rehabilitation pathways, management rehabilitation requires some form of community participation or water committee meeting in order to address the failure.
A local leader in Kenya described this process as beginning when either 1) a local leader (specifically, a chief or assistant chief) recognizes that the water committee is not effectively managing the water system and calls a meeting; or 2) the community “shouts” and reports to the chief’s office if the chairperson or the committee are not performing. The local leader went on to state that rehabilitation takes place when “the community are mobilized, then from there, they can do the election (sic).”
Constraints that slow or halt rehabilitation are mostly associated with a local leader’s lack of capacity or willingness to adequately select and prepare new committee members for their tasks.
Community-level actions taken to rehabilitate a water committee can give way for a local leader to dismantle or replace the water committee. This was seen in two study communities, one in which the water system management was largely being performed by a local leader, and one in which a local leader dissolved a committee and replaced committee members with appointed interim committee members. While the dissolved committees may not have been operating effectively before actions were taken by local leaders in these communities, local leaders not preparing new committee members for their roles prevents full rehabilitation of the committee.
Management rehabilitation pathway 2: Community-level actors prompt external support
actions
37
support is that external support actors are contacted instead of local leaders, and remain involved in subsequent steps.
Support actors are often government or NGO employees. Regional water committee associations sometimes play a role in management rehabilitation as well; specifically, they are sometimes charged with helping individual water committees resolve conflicts. A water committee member in Zambia described the role of zonal WaSH committees, which serve as regional water committee associations:
“Zonal committee mostly helps [sic] the WaSH committees for the borehole that if they don't cooperate, it becomes easy when they go there to help them with what they can do because in other places you can find that a committee has been chosen but it's not working well, they don't cooperate so they go to help with that problem concerning water.”
These water committee associations help to rehabilitate management failures that cannot be addressed effectively at the community-level.
In Kenya, a WV employee specifically indicated the role of government in management rehabilitation of water committees registered as community-based organizations (CBO), stating, “a CBO is a registered entity. So if they need to do an overhaul, then we need to engage the relevant ministries.” In this case, the water committee’s registration as a CBO requires the involvement of government ministries when the committee needs replacement.
Constraints for this management rehabilitation pathway involve confusion about support actors or challenges in contacting them, similar to hardware rehabilitation requiring external support.
Management rehabilitation pathway 3: External actors prompting community-level actions
address. These steps are the same as those for rehabilitation involving only community-level actions, but with external actors involved in the first step and being the main actor in the second.
While community-level actors requesting the support of external actors in management rehabilitation is more common in study communities, there were also examples of external actors alerting local leaders and community members about management breakdowns. This can occur when government employees are responsible for visiting the management committee or auditing committee funds, allowing for them to discover misappropriation that may go undetected or unproven by community-level actors. This auditing was specifically mentioned by a government water officer in Kenya. Auditing of management committees presents an opportunity to verify mismanagement of funds that can otherwise only be suspected. Constraints for this pathway are related to infrequent monitoring or lack of presence of external support actors that may diagnose management failure.
Even though external actors are responsible for problem diagnosis in this pathway, they alert local leaders, and, ultimately, responsibility for rehabilitation lies within the community.
Discussion
Hardware rehabilitation pathways
39
sustainability (Alexander, Tesfaye, Dreibelbis, Abaire, & Freeman, 2015; Fisher et al., 2015; Foster, 2013). The rehabilitation pathways presented show how these factors come into play in specific steps, and the specific ways in which the absence of, for instance, tools or spare parts, may slow the rehabilitation process.
No hardware rehabilitation pathways identified in the data include only external support actions – that is, in which NGO or government employees visit a community without being contacted by community-level actors, recognize and diagnose a hardware problem, and carry out the technical and financial support actions necessary to rehabilitate the system without any involvement of level actors. This finding emphasized the importance of community-level capacity within the community management paradigm that is common for rural water supplies (Lockwood et al., n.d.; Whittington et al., 2009).
All hardware rehabilitation pathways begin with problem diagnosis. Failure to complete this step prevents rehabilitation from starting and slow diagnosis means rehabilitation is delayed. Training water system caretakers or those that most frequently interact with the systems in more precise problem diagnosis could help support rapid rehabilitation.
The most common barrier to problem diagnosis is the community’s lack of use of the system and thus lack of interest in rehabilitating it. This lack of use and interest in rehabilitating the water system is related to a lack of community ownership and is associated with water system performance (Marks, Onda, & Davis, 2013). An example of this relationship can be seen in community members’ and water committee members’ discussion of PlayPumps, a type of water system. Participants describe PlayPump operation as burdensome; lack of interest in using the system was likely what prevented rehabilitation in all PlayPumps installed in study
existence of more than one water system in a community; more than one water system in the same vicinity has been shown to be associated with lower rates of functionality (Fisher et al., 2015).
In some cases, completion of one or more of the rehabilitation steps involved meetings of the water committee, community members, and/or mechanics or technicians to discuss: the nature of the problem; which technical or financial support actors should be contacted; which materials should be purchased; or who should participate in repair. These meetings were not seen to be necessary to complete rehabilitation in all communities, but may be helpful depending on the established method for decision-making within specific communities. Regular water
committee meetings have been shown to be associated with increased functionality of water systems, and decision-making processes for community-managed water systems have been shown to improve with frequency of and attendance at water committee meetings (Foster, 2013; Schweitzer & Mihelcic, 2012). It is possible that holding meetings to address hardware
breakdowns helps to more rapidly mobilize relevant community-level actors to complete rehabilitation steps.
Communication was seen as a constraint in all hardware rehabilitation pathways; poor communication between communities and mechanics or external support actors has been
41
the water committee chairperson was primarily responsible for contacting technical support. Effective communication was less common when external technical support actors were
necessary for rehabilitation; knowing which external actor to contact and by which means should be an emphasis of training for water committees.
Distance to a hardware store and poor transportation infrastructure was seen to slow rehabilitation, aligning with evidence of the association between non-functionality distance to urban centers (Foster, 2013). Also, lack of immediate funds to pay for spare parts, tools, or technical services was seen as a constraint in all hardware rehabilitation pathways, aligning with evidence of the association between fee collection and functionality (Foster, 2013).
In both hardware rehabilitation pathways that do not incorporate external technical support, worse breakdowns sometimes result from improper repair. Limited communication pathways to external support actors has been cited as an indication of overreliance on community-level actors (Bonsor et al., 2015). In order to best support community-managed water systems, it is necessary for community-level actors to better understand which repairs they are capable of handling and which repairs require external support. When external support is necessary, community-level actors must know which actors should be contacted and what means of communication are most effective.
Management rehabilitation pathways
All management rehabilitation pathways identified in the data require involvement of local leaders and were best executed when action was taken in a transparent, participatory manner. Nontransparent dissolving or replacement of committees, even when they were not functional led to distrust and, at times, decreased capacity of the committee to perform its tasks.
The pathways that involve external support actors, such as water committee associations, show alternatives to purely community-level actions that may better support full management rehabilitation in some cases. Some communities have excellent internal oversight processes and trusted local leaders that allow for all management failures to be addressed without external support. In other cases, water committee associations and government actors can act as effective external support in management rehabilitation. Post-construction support programs often focus on both technical and administrative guidance and assistance (Kayser, Moomaw, Miguel, Portillo, & Grif, 2014; Whittington et al., 2009). These programs can be improved with better understanding of how to best support water committee operations as well as water system functionality. Pragmatic programming should anticipate management failure and ensure that relevant support is in place to help communities maintain highly functional water committees.
Limitations and generalizability
43
water committee members, in both interviews and FGDs, in order to triangulate information between different activities and improve internal validity.
Study communities were chosen based on the presence of a functional water system at the time of a representative survey of WV systems. Thus, experiences of community-level actors with water systems that had failed terminally were not intended to be of focus in this study, although several study communities had additional water systems that were non-functional and researchers also collected data on participants’ experiences with these systems. It is possible that some of the rehabilitation constraints that lead to long-term or permanent non-functionality are not present in the data because of the focus on functional systems. Collecting data from
communities with non-functional systems could reveal other barriers to rehabilitation, but the specific steps to rehabilitation are intended to be relevant to all functional community-managed water systems that had, at one point, been rehabilitated.
Study communities were specifically chosen to have a water committee that manages the water system of focus; the rehabilitation pathways are intended to be relevant for community-managed water systems. Community management is prevalent for rural water systems in sub-Saharan Africa.
All study communities had engaged with World Vision in the implementation and support of at least one of their water systems. World Vision has a distinct community
Breakdowns and rehabilitation
Enhanced knowledge of common breakdown types can help to inform the specific breakdowns for which water systems must frequently be rehabilitated and what implementation errors commonly lead to breakdowns.
The frequency of conceptual breakdowns for which specific parts are at fault indicates that spare parts constraints identified in the rehabilitation pathways are frequently relevant. Better understanding of which specific parts often fail in different water systems of different ages helps to show what often needs repair or replacement in specific contexts. Easily accessed spare parts were shown as vital to rehabilitation in qualitative data from Ghana, Kenya, and Zambia and are often shown to be associated with long-term functionality of rural water systems (Fisher et al., 2015; Foster, 2013; Hoko & Hertle, 2006; Komives et al., 2008; Sara, Gross, & van den Berg, 1996). Pipes and taps/spouts commonly require repair or replacement in Tanzania and Uganda; these parts should be accessible in local hardware stores or spare parts warehouses and water system management should be encouraged to stock spares for rapid access. Vague
responses like “pump damaged” are not helpful for indicating specific parts that should be readily available locally to rehabilitate non-functional water systems. However, these breakdown reasons do suggest that better trained, easily accessible mechanics that are familiar with pump operation and failure could help to identify specific hardware problems and rehabilitate these systems.
Community-managed water systems often face hardware breakdowns and must be rehabilitated to serve their intended users. Better understanding common water system
45
Conclusions
The breakdown typology and rehabilitation pathways outlined in this paper can serve to guide programming to better support the sustainability of rural water systems.
Stocking spare parts and safeguarding against common reasons for hardware
breakdown. Identified common breakdowns can help multiple levels of actors – from national governments and international NGOs to local mechanics and water committees – better
anticipate and address frequent problems. Specifically, since pipes and taps/spouts are the parts most often responsible for breakdown, spare parts warehouses should be stocked with these parts to facilitate quick rehabilitation. As environmental problems and intentional harm to the systems (theft or vandalism) are often the cause of water system breakdown, implementers should focus implementation and continuing support for systems on preventing these problems. Community-level actors should be trained to either store or know how to quickly access commonly needed spare parts; water management committees should be trained on how to manage their water systems in a way that safeguards against common reasons for breakdowns. Data on water system breakdowns should be frequently analyzed in order to identify which conceptual breakdowns and which specific parts are primarily responsible for water system non-functionality in a country or region, and relevant actors should safeguard against these breakdown reasons.
Addressing slow rehabilitation and terminal failure. The rehabilitation pathways show specific barriers that slow or prevent rehabilitation steps should be addressed in programming and management for water system sustainability. Addressing barriers that slow rehabilitation steps should be of focus where repair time is lengthy; addressing barriers that prevent
rehabilitation entirely should be of focus where many systems have failed terminally.
Governments, NGOs, and private sector actors focused on implementing and supporting rural water systems should identify if terminal failure, slow rehabilitation, or both, are common for systems they support and work to eliminate barriers to rapid rehabilitation when breakdowns inevitably occur.
Making sure external support actors are accessible. Rehabilitation pathways involve different actors depending on the complexity and extent of the hardware breakdown. All systems included in the qualitative study conducted in Ghana, Kenya, and Zambia, even those with the best functioning, most long-established water committees, made use of external support to rehabilitate their system. This speaks to the importance of post-construction support that is accessible to community-level water management committees well after a water system is implemented. Governments, NGOs, and private sector actors should ensure that this vital backstopping is available in all cases and that community-level actors know exactly who to contact when external support is required to rehabilitate their system.
Programming focused on the long-term sustainability of water systems requires
47